. 2019 Jul 3;2(7):e196700.
doi: 10.1001/jamanetworkopen.2019.6700.

Quantifying Sex Bias in Clinical Studies at Scale With Automated Data Extraction

Affiliations

Quantifying Sex Bias in Clinical Studies at Scale With Automated Data Extraction

Sergey Feldman et al. JAMA Netw Open. .

Abstract

Importance: Analyses of female representation in clinical studies have been limited in scope and scale.

Objective: To perform a large-scale analysis of global enrollment sex bias in clinical studies.

Design, setting, and participants: In this cross-sectional study, clinical studies from published articles from PubMed from 1966 to 2018 and records from Aggregate Analysis of ClinicalTrials.gov from 1999 to 2018 were identified. Global disease prevalence was determined for male and female patients in 11 disease categories from the Global Burden of Disease database: cardiovascular, diabetes, digestive, hepatitis (types A, B, C, and E), HIV/AIDS, kidney (chronic), mental, musculoskeletal, neoplasms, neurological, and respiratory (chronic). Machine reading algorithms were developed that extracted sex data from tables in articles and records on December 31, 2018, at an artificial intelligence research institute. Male and female participants in 43 135 articles (792 004 915 participants) and 13 165 records (12 977 103 participants) were included.

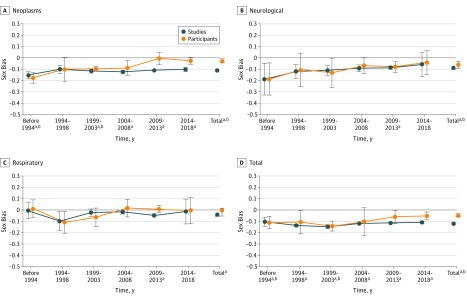
Main outcomes and measures: Sex bias was defined as the difference between the fraction of female participants in study participants minus prevalence fraction of female participants for each disease category. A total of 1000 bootstrap estimates of sex bias were computed by resampling individual studies with replacement. Sex bias was reported as mean and 95% bootstrap confidence intervals from articles and records in each disease category over time (before or during 1993 to 2018), with studies or participants as the measurement unit.

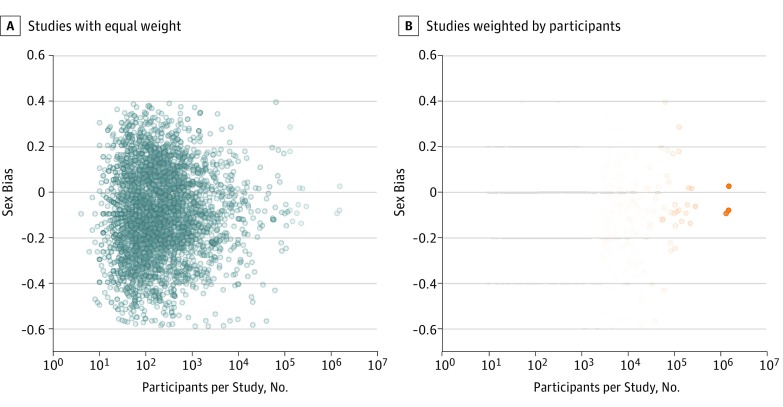
Results: There were 792 004 915 participants, including 390 470 834 female participants (49%), in articles and 12 977 103 participants, including 6 351 619 female participants (49%), in records. With studies as measurement unit, substantial female underrepresentation (sex bias ≤ -0.05) was observed in 7 of 11 disease categories, especially HIV/AIDS (mean for articles, -0.17 [95% CI, -0.18 to -0.16]), chronic kidney diseases (mean, -0.17 [95% CI, -0.17 to -0.16]), and cardiovascular diseases (mean, -0.14 [95% CI, -0.14 to -0.13]). Sex bias in articles for all categories combined was unchanged over time with studies as measurement unit (range, -0.15 [95% CI, -0.16 to -0.13] to -0.10 [95% CI, -0.14 to -0.06]), but improved from before or during 1993 (mean, -0.11 [95% CI, -0.16 to -0.05]) to 2014 to 2018 (mean, -0.05 [95% CI, -0.09 to -0.02]) with participants as the measurement unit. Larger study size was associated with greater female representation.

Conclusions and relevance: Automated extraction of the number of participants in clinical reports provides an effective alternative to manual analysis of demographic bias. Despite legal and policy initiatives to increase female representation, sex bias against female participants in clinical studies persists. Studies with more participants have greater female representation. Differences between sex bias estimates with studies vs participants as measurement unit, and between articles vs records, suggest that sex bias with both measures and data sources should be reported.


Conflict of interest statement

Conflict of Interest Disclosures: Dr Feldman reported serving as a consultant for the Bill & Melinda Gates Foundation outside the submitted work. No other disclosures were reported.

Figures

Figure 1.
Figure 1.. Sex Bias in Clinical Studies Over Time Determined From Published Articles for Cardiovascular Diseases, Diabetes, Digestive Diseases, and Hepatitis (Types A, B, C, and E)
An intercept-only linear model was fitted to sex bias values from before and during 1993 and subsequently in 5-year increments. Estimated sex bias intercept coefficients were plotted against time for studies (blue) and participants as measurement unit (orange), with error bars representing 95% confidence intervals for the mean coefficients. The points for total at the right of each graph represent the mean sex bias totals for each category. Sex bias was defined as female participant fraction (determined separately for studies and participants as measurement unit) minus female prevalence fraction (values for sex bias ranged from −1 to 1, with 0 indicating no bias; negative sex bias indicates that female participants were represented less than male participants). aDifference between sex bias value vs 0; P < .001 for studies as measurement unit. bDifference between sex bias value vs 0; P < .001 for participants as measurement unit.
Figure 2.
Figure 2.. Sex Bias in Clinical Studies Over Time Determined From Published Articles for HIV/AIDS, Kidney Diseases (Chronic), Mental Disorders, and Musculoskeletal Disorders
An intercept-only linear model was fitted to sex bias values from before and during 1993 and subsequently in 5-year increments. Estimated sex bias intercept coefficients were plotted against time for studies (blue) and participants as measurement unit (orange), with error bars representing 95% confidence intervals for the mean coefficients. For HIV/AIDS before or during 1993, sex bias values for studies (−0.40) and participants (−0.42) were not plotted because they were based on only 3 articles (total, 138 participants). Sex bias was defined as female participant fraction (determined separately for studies and participants as measurement unit) minus female prevalence fraction (values for sex bias ranged from −1 to 1, with 0 indicating no bias; negative sex bias indicates that female participants were represented less than male participants). aDifference between sex bias value vs 0; P < .001 for studies as measurement unit. bDifference between sex bias value vs 0; P < .001 for participants as measurement unit.
Figure 3.
Figure 3.. Sex Bias in Clinical Studies Over Time Determined From Published Articles for Neoplasms, Neurological Disorders, Respiratory Diseases (Chronic), and Total (All Categories Combined)
An intercept-only linear model was fitted to sex bias values from before and during 1993 and subsequently in 5-year increments. Estimated sex bias intercept coefficients were plotted against time for studies (blue) and participants as measurement unit (orange), with error bars representing 95% confidence intervals for the mean coefficients. The total number of published articles (all categories combined) increased from before or during 1993 (total, 482 articles) to 2014 to 2018 (18 627 articles). Sex bias in articles for all categories combined was unchanged over time with studies as measurement unit (range, −0.15 [−0.16 to −0.13] to −0.10 [−0.14 to −0.06]), but improved from before 1993 (−0.11 [−0.16 to −0.05]) to 2014 to 2018 (−0.05 [−0.09 to −0.02]) with participants as measurement unit. Sex bias was defined as female participant fraction (determined separately for studies and participants as measurement unit) minus female prevalence fraction (values for sex bias ranged from −1 to 1, with 0 indicating no bias; negative sex bias indicates that female participants were represented less than male participants). aDifference between sex bias value vs 0; P < .001 for studies as measurement unit. bDifference between sex bias value vs 0; P < .001 for participants as measurement unit.
Figure 4.
Figure 4.. Sex Bias vs Number of Study Participants for 14 371 Cardiovascular Clinical Studies, Estimated From Published Articles by the PubMed-Extract Algorithm
Each point represents 1 article. A, With studies as the measurement unit of sex bias, each study point has equal intensity of blue shade and contribution to the overall estimate of sex bias. B, With participants as the measurement unit of sex bias, study point orange shade intensity is proportional to the number of participants; small studies are essentially invisible and contribute little to the overall sex bias estimate.

Similar articles

Cited by

References

    1. Wallach JD, Sullivan PG, Trepanowski JF, Steyerberg EW, Ioannidis JP. Sex based subgroup differences in randomized controlled trials: empirical evidence from Cochrane meta-analyses. BMJ. 2016;355:. doi:10.1136/bmj.i5826 - DOI - PMC - PubMed
    1. Whitley H, Lindsey W. Sex-based differences in drug activity. Am Fam Physician. 2009;80(11):1254-. - PubMed
    1. Heinrich J. Drug safety: most drugs withdrawn in recent years had greater health risks for women. https://www.gao.gov/assets/100/90642.pdf. Published January 19, 2001. Accessed November 10, 2018.
    1. McGregor AJ. Sex bias in drug research: a call for change. Pharm J. 2016;296(7887). https://www.pharmaceutical-journal.com/opinion/comment/sex-bias-in-drug-.... Published March 16, 2016. Accessed November 9, 2018.
    1. Farkas RH, Unger EF, Temple R. Zolpidem and driving impairment—identifying persons at risk. N Engl J Med. 2013;369(8):689-691. doi:10.1056/NEJMp1307972 - DOI - PubMed

Publication types