

Decreased synthesis of ribosomal proteins in tauopathy revealed by non-canonical amino acid labelling
- PMID: 31268600
- PMCID: PMC6600635
- DOI: 10.15252/embj.2018101174
Decreased synthesis of ribosomal proteins in tauopathy revealed by non-canonical amino acid labelling
Abstract
Tau is a scaffolding protein that serves multiple cellular functions that are perturbed in neurodegenerative diseases, including Alzheimer's disease (AD) and frontotemporal dementia (FTD). We have recently shown that amyloid-β, the second hallmark of AD, induces de novo protein synthesis of tau. Importantly, this activation was found to be tau-dependent, raising the question of whether FTD-tau by itself affects protein synthesis. We therefore applied non-canonical amino acid labelling to visualise and identify newly synthesised proteins in the K369I tau transgenic K3 mouse model of FTD. This revealed massively decreased protein synthesis in neurons containing pathologically phosphorylated tau, a finding confirmed in P301L mutant tau transgenic rTg4510 mice. Using quantitative SWATH-MS proteomics, we identified changes in 247 proteins of the de novo proteome of K3 mice. These included decreased synthesis of the ribosomal proteins RPL23, RPLP0, RPL19 and RPS16, a finding that was validated in both K3 and rTg4510 mice. Together, our findings present a potential pathomechanism by which pathological tau interferes with cellular functions through the dysregulation of ribosomal protein synthesis.
Keywords: neurodegenerative disease; non-canonical amino acid labelling; protein synthesis; ribosomal proteins; tauopathy.
© 2019 The Authors. Published under the terms of the CC BY NC ND 4.0 license.
Conflict of interest statement
The authors declare that they have no conflict of interest.
Figures
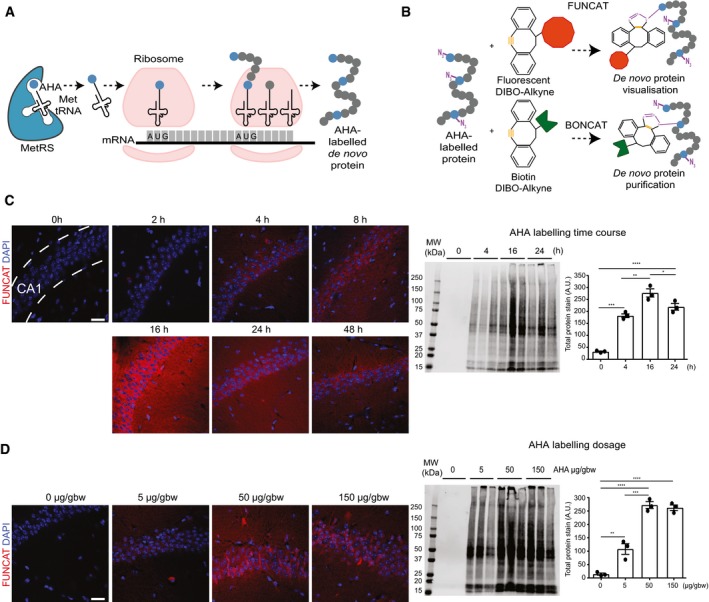
Schematic representation of AHA labelling as a tool to identify newly synthesised proteins. De novo synthesised proteins are labelled with AHA at the amino‐terminal and internal methionine residues using the endogenous translational machinery.
AHA‐labelled proteins can be covalently bonded through reaction of the azide group (purple) of AHA with the alkyne group (orange) of tags and either visualised using fluorescent non‐canonical amino acid tagging (FUNCAT) or purified using bio‐orthogonal non‐canonical amino acid tagging (BONCAT) for further analysis.
FUNCAT visualisation in wild‐type (WT) mice treated for varying time periods with 50 μg AHA per gram body weight (gbw). AHA incorporation can be observed as early as 4‐h post‐injection in the CA1 region of the hippocampus and is still observed 48‐h post‐injection. Western blot analysis of AHA‐labelled proteins purified from whole hemisphere (without the cerebellum) with BONCAT reveals that maximal AHA labelling occurs approximately 16‐h post‐injection (n = 3 mice, one‐way ANOVA, Tukey's multiple comparison test).
AHA‐labelled proteins in WT mice treated with ascending concentrations of AHA were visualised using FUNCAT. Scale bar: 40 μm. Western blot of AHA‐labelled proteins purified from whole hemisphere (without the cerebellum) using BONCAT reveals that maximal AHA labelling occurs when mice are administered 50 μg AHA/gbw (n = 3 mice, one‐way ANOVA, Tukey's multiple comparison test).
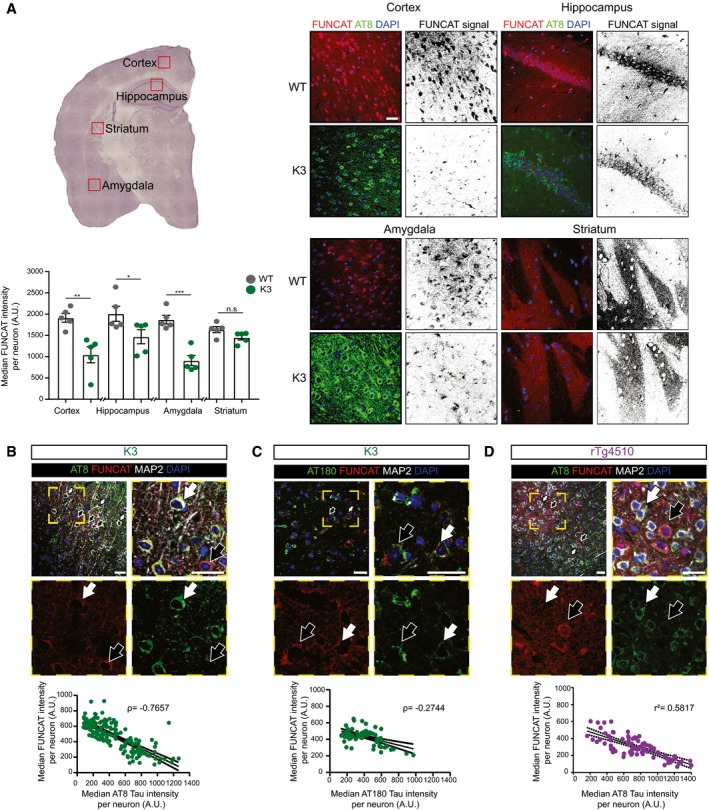
In 5‐month‐old K3 mice, brain regions analysed by microscopy corresponding to layer 2/3 of the cortex, the CA1 region of the hippocampus and the amygdala, which contain neurons with high levels of AT8‐positivity, show significantly less FUNCAT signal compared with WT brains. In the striatum, where no AT8 immunoreactivity is observed, there is no difference in FUNCAT signal between the two genotypes (two‐way ANOVA, Sidak's multiple comparison test, n = 5 animals, three sections per animal).
In layer 2/3 of the cortex of 5‐month‐old K3 mice, the FUNCAT signal negatively correlates with AT8 tau. Neurons with strong AT8 tau pathology and a low FUNCAT signal are indicated by white filled arrows, whereas neurons with low AT8 tau pathology and a high FUNCAT signal are indicated by black filled arrows (Spearman's correlation, ρ = −0.7657, standard error of correlation shown by black dotted line, n = 5 animals, 30 neurons per animal).
FUNCAT signal is negatively correlated with AT180 signal in layer 2/3 of the cortex of 5‐month‐old K3 mice. Neurons with high AT180 tau pathology and a low FUNCAT signal are indicated by white filled arrows, whereas neurons with low AT8 tau pathology and a high FUNCAT signal are indicated by black filled arrows (Spearman's correlation, ρ = −0.2744, p standard error of correlation shown by a black dotted line, n = 5 animals, 15 ≤ neurons per animal).
FUNCAT and AT8 tau signal are negatively correlated in layer 2/3 cortical neurons of 3‐month‐old rTg4510 mice. Neurons with strong AT8 tau pathology and a low FUNCAT signal are indicated by white filled arrows, whereas neurons with low AT8 tau pathology and a high FUNCAT signal are indicated by black filled arrows (Pearson's correlation, r 2 = 0.5817, standard error of correlation shown by a black dotted line, n = 3 animals, 30 neurons per animal).
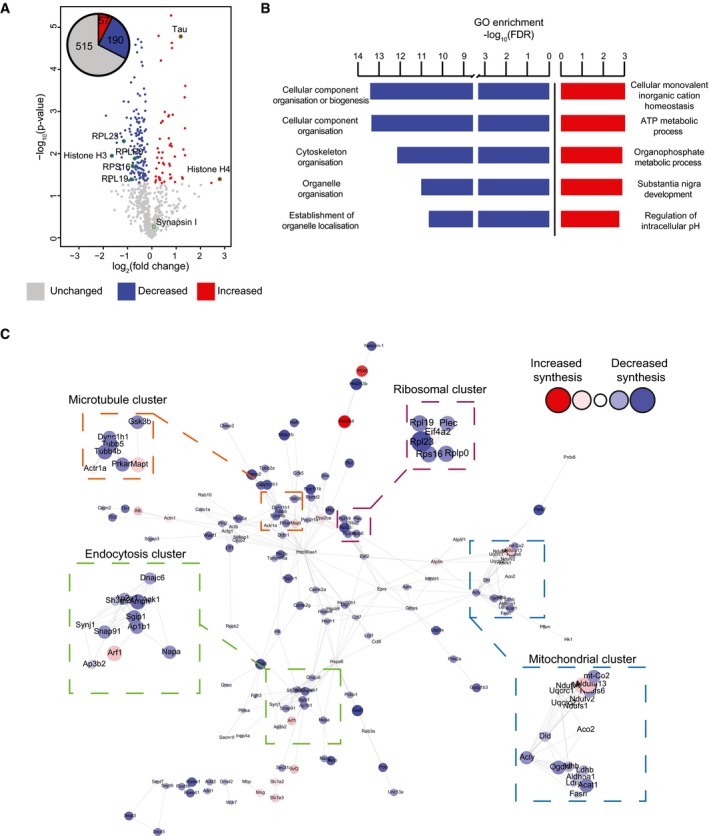
Relative abundance of de novo synthesised proteins in 5‐month‐old K3 and WT mice. 762 proteins were quantified using SWATH‐MS across 5 K3 and 5 WT samples. The fold‐change was calculated for individual proteins by comparing the relative protein abundance in K3 vs. WT mice. Proteins displaying significantly increased synthesis in K3 mice (fold‐change > 1, P ≤ 0.05) are shown in red, whereas those exhibiting significantly decreased synthesis (fold‐change < 1, P ≤ 0.05) are shown in blue. Candidate proteins are encircled in green.
Gene ontology (GO) analysis of proteins which were significantly altered in synthesis in K3 mice. GO analyses were performed separately for proteins exhibiting significantly increased or decreased synthesis in K3 mice using the STRING database. The 5 biological functions identified with the lowest false discovery rates (FDR) are displayed.
STRING network analysis of proteins with significantly altered synthesis in K3 mice. Only interactions with a STRING score ≥ 0.7 are shown. Evidence of interaction is represented by the distance between nodes, with more tightly packed nodes having a higher STRING score. Proteins that did not display interactions are not shown. Node size and colour are linearly related to fold‐change. The microtubule, endocytosis, mitochondrial and ribosomal clusters contain tightly packed nodes and are depicted magnified in the inserts.
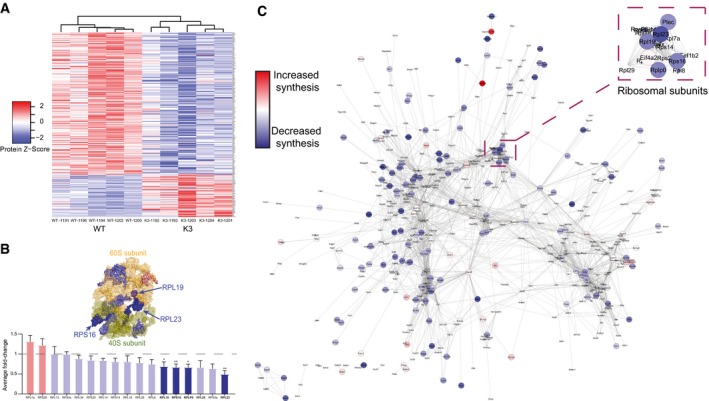
Heatmap of the relative abundance in individual samples of 247 proteins that are significantly altered in synthesis in K3 mice compared with WT controls. Clustering analysis using average linkage shows that K3 and WT samples cluster separately.
The average fold‐change in the synthesis of ribosomal proteins in K3 mice compared with WT mapped onto a surface representation of the structure of the ribosome complex (PDB: 3J7R). Proteins showing significantly decreased synthesis (fold‐change < 1, P ≤ 0.05) in K3 mice (RPL23, RPLP0, RPL19 & RPS16) are represented in dark blue (Student's t‐test, n = 5 animals).
Network analysis of all de novo synthesised proteins identified in SWATH‐MS analysis. Interactions between proteins (nodes) were examined using the STRING database, with only interactions with a STRING score ≥ 0.7 being shown. Evidence of interaction is represented by the distance between nodes, with more tightly packed nodes having a higher STRING score. Proteins not displaying interactions are not shown. Proteins that showed significantly altered synthesis in K3 mice compared with WT controls (P ≤ 0.05) are shown by large nodes. The node colour is linearly related to the fold‐change. The ribosomal node is detailed in the magnification.
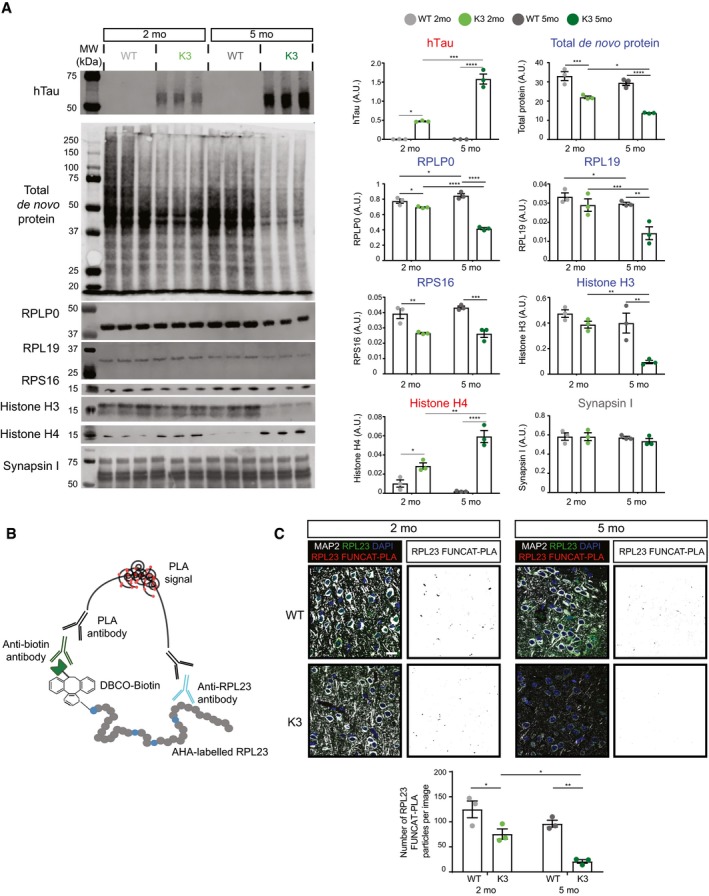
Western blot analysis of de novo synthesised proteins demonstrates age‐dependent alterations in protein synthesis in K3 mice compared with WT controls. AHA‐labelled proteins from 2‐ and 5‐month‐old K3 and WT mice were purified using BONCAT and probed by Western blotting (BONCAT‐WB). The synthesis of ribosomal proteins RPLP0, RPL19 and RPS16, as well as histone H3, was found to be significantly decreased in K3 mice, whereas that of histone H4 was increased and that of synapsin I was unaltered (two‐way ANOVA, Sidak's multiple comparison test, n = 3 animals).
Schematic representation of the FUNCAT‐PLA (proximity ligation assay) technique, showing that newly synthesised, AHA‐labelled RPL23 is biotinylated using DIBO‐biotin and subsequently co‐labelled with anti‐biotin and anti‐RPL23 primary antibodies. Co‐labelling is then detected using PLA antibodies, which results in a fluorescent signal when the two targets are in close proximity (i.e. < 40 nm apart).
Synthesis of RPL23 in K3 mice is decreased in an age‐dependent manner. Compared to WT mice, significantly lower numbers of RPL23 FUNCAT‐PLA punctae are detected in layer 2/3 cortical neurons of K3 mice at both 2 and 5 months of age (two‐way ANOVA, Sidak's multiple comparison test, n = 3 animals).
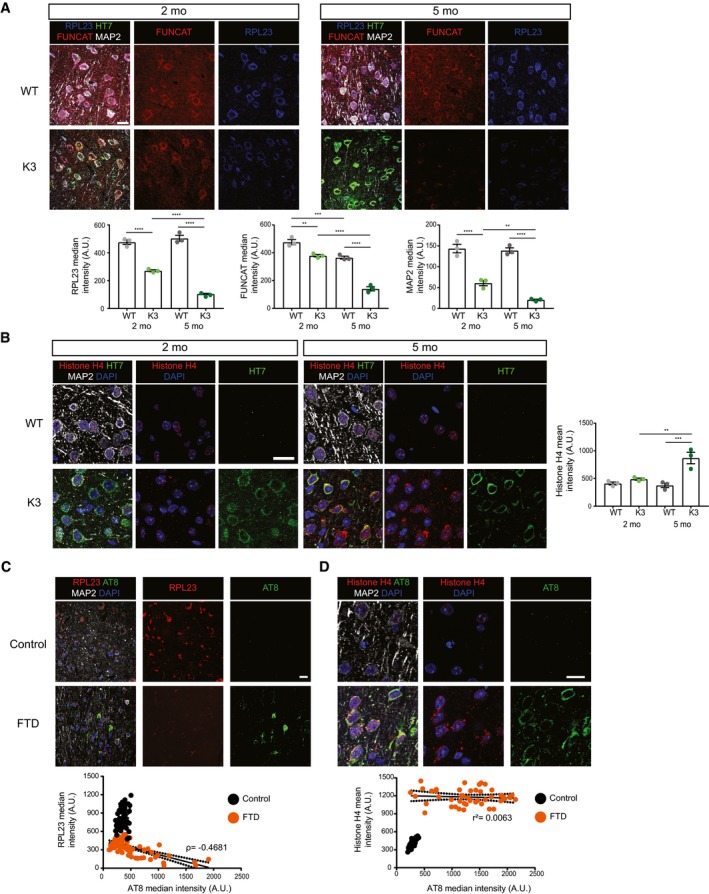
The total abundance of RPL23 is decreased in K3 mice compared with WT controls at both 2 and 5 months of age. RPL23, FUNCAT and MAP2 signal intensities are decreased in layer 2/3 cortical neurons of K3 mice in an age‐dependent manner (two‐way ANOVA, Sidak's multiple comparison test, n = 3 animals).
Histone H4 levels are increased in layer 2/3 of the cortex of K3 compared with WT mice at 5 months of age. This difference is not observed at 2 months of age (two‐way ANOVA, Sidak's multiple comparison test, n = 3 animals).
Levels of RPL23 are significantly decreased in neurons from the superior frontal cortex of human FTD brains compared with healthy controls. This decrease correlates with AT8 tau (Spearman's correlation, ρ = −0.4681, standard error of correlation represented by black dots, Student's t‐test, n > 3, ≥ 15 neurons per sample).
Histone H4 levels are significantly increased in neurons from the superior frontal cortex of human FTD brains compared with healthy controls (Student's t‐test, n = 3, ≥ 15 neurons per sample). This increase is not correlated with AT8 (Pearson's correlation r 2 = 0.0063, standard error of correlation represented by black dots).
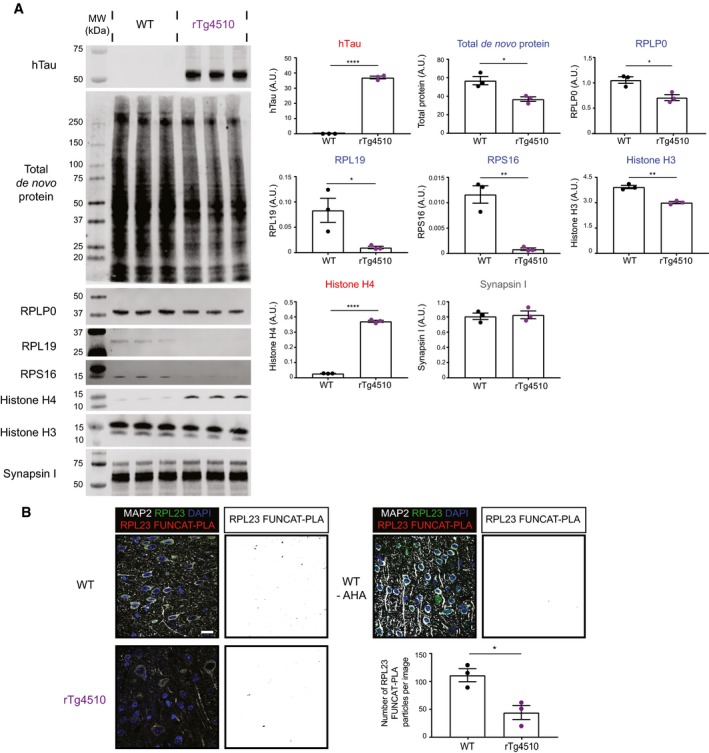
Western blot analysis of de novo synthesised proteins reveals altered protein synthesis in rTg4510 mice compared with WT controls. AHA‐labelled proteins from rTg4510 and WT mice were purified using BONCAT and probed via Western blotting. The synthesis of the ribosomal proteins RPLP0, RPL19 and RPS16, as well as histone H3, was significantly decreased in rTg4510 mice, whereas that of histone H4 was increased, and that of synapsin I was unaltered (Student's t‐test, n = 3 animals).
Synthesis of RPL23 is decreased in rTg4510 mice. Compared to WT mice, significantly lower numbers of RPL23 FUNCAT‐PLA punctae are detected in layer 2/3 cortical neurons of rTg4510 mice (Student's t‐test, n = 3 animals). A PBS‐treated WT control is also shown as a negative control.
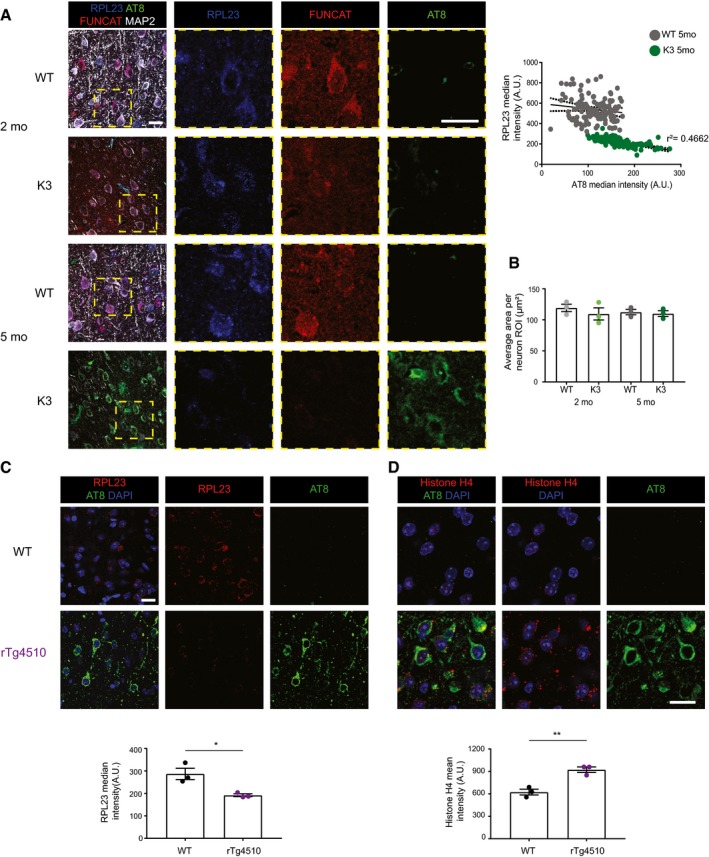
RPL23 levels are negatively correlated with AT8 phospho‐tau in the cortex of 5‐month‐old K3 mice (Pearson's correlation, r 2 = 0.4662, standard error of correlation represented by dotted black lines, n = 3 animals, ≥ 30 neurons per animal). AT8‐positive neurons were not detected in 2‐month‐old K3 mice.
The average area of regions of interest drawn around individual neurons using MAP2 labelling does not differ between K3 and WT mice (two‐way ANOVA, Sidak's multiple comparison test, n = 3 animals, ≥ 30 neurons per animal).
The total abundance of RPL23 is decreased in rTg4510 mice compared with WT controls (Student's t‐test, n = 3 animals).
Histone H4 levels are increased in layer 2/3 of the cortex of rTg4510 mice compared with WT mice (Student's t‐test, n = 3 animals).
References
-
- Alvarez‐Castelao B, Schanzenbächer CT, Hanus C, Glock C, tom Dieck S, Dörrbaum AR, Bartnik I, Nassim‐Assir B, Ciirdaeva E, Mueller A et al (2017) Cell‐type‐specific metabolic labeling of nascent proteomes in vivo . Nat Biotechnol 35: 1196–1201 - PubMed
-
- Anjo SI, Santa C, Manadas B (2017) SWATH‐MS as a tool for biomarker discovery: from basic research to clinical applications. Proteomics 17: 1600278 - PubMed
Publication types
MeSH terms
Substances
Grants and funding
- GNT1127999/Department of Health | National Health and Medical Research Council (NHMRC)/International
- DP160103812/Department of Education and Training | Australian Research Council (ARC)/International
- ACT900116/Federal Government of Australia/International
- R28 AA012725/AA/NIAAA NIH HHS/United States
- R28AA012725/National Institute of Alcohol Abuse and Alcoholism of the National Institutes of Health/International
LinkOut - more resources
Full Text Sources
Molecular Biology Databases
