. 2019 Aug 1;122(2):691-706.
doi: 10.1152/jn.00048.2019. Epub 2019 Jul 3.

Active membrane conductances and morphology of a collision detection neuron broaden its impedance profile and improve discrimination of input synchrony

Affiliations

Active membrane conductances and morphology of a collision detection neuron broaden its impedance profile and improve discrimination of input synchrony

Richard B Dewell et al. J Neurophysiol. .

Abstract

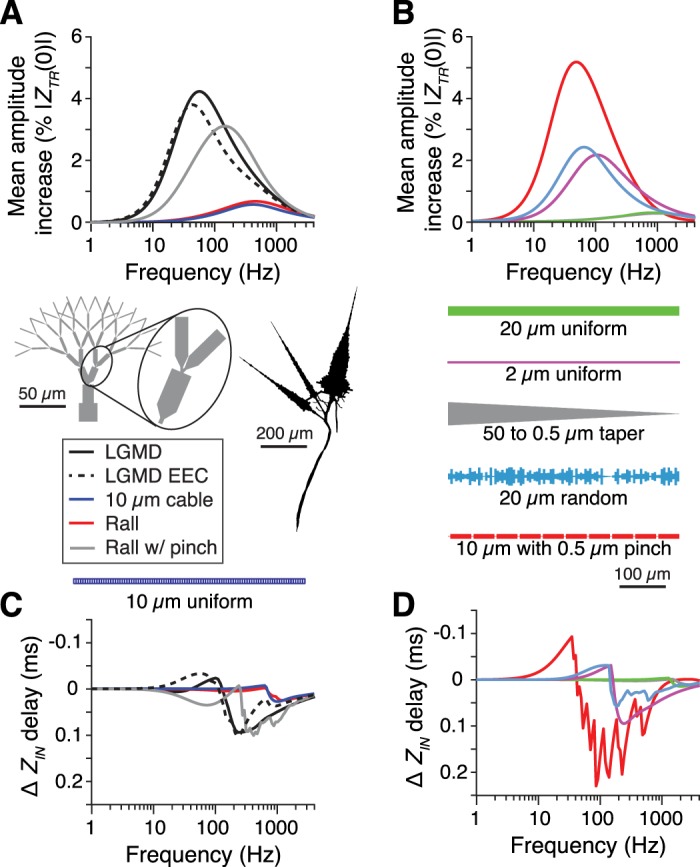
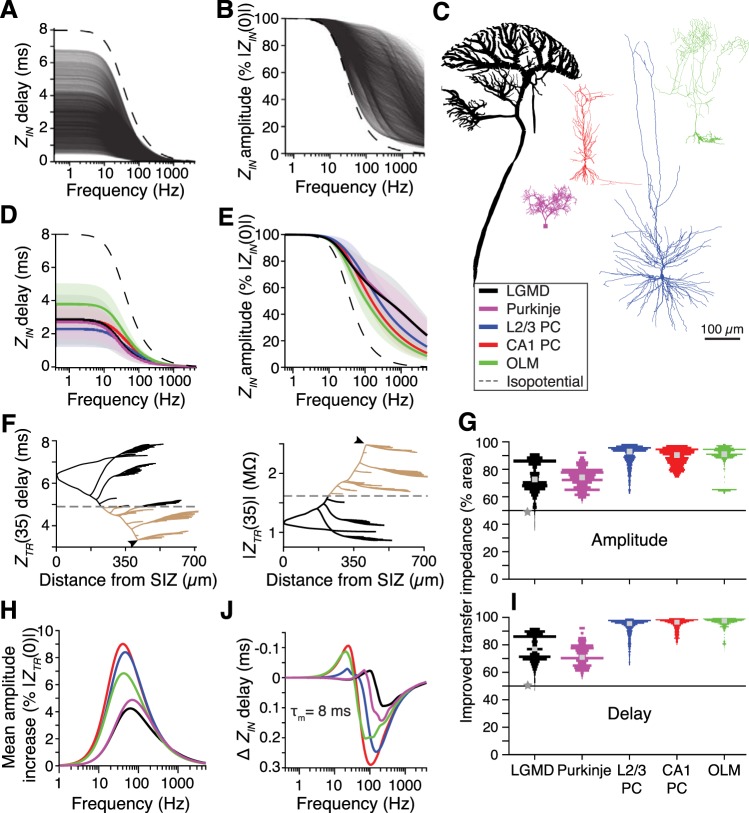
How neurons filter and integrate their complex patterns of synaptic inputs is central to their role in neural information processing. Synaptic filtering and integration are shaped by the frequency-dependent neuronal membrane impedance. Using single and dual dendritic recordings in vivo, pharmacology, and computational modeling, we characterized the membrane impedance of a collision detection neuron in the grasshopper Schistocerca americana. This neuron, the lobula giant movement detector (LGMD), exhibits consistent impedance properties across frequencies and membrane potentials. Two common active conductances gH and gM, mediated respectively by hyperpolarization-activated cyclic nucleotide-gated (HCN) channels and by muscarine-sensitive M-type K+ channels, promote broadband integration with high temporal precision over the LGMD's natural range of membrane potentials and synaptic input frequencies. Additionally, we found that a model based on the LGMD's branching morphology increased the gain and decreased the delay associated with the mapping of synaptic input currents to membrane potential. More generally, this was true for a wide range of model neuron morphologies, including those of neocortical pyramidal neurons and cerebellar Purkinje cells. These findings show the unexpected role played by two widespread active conductances and by dendritic morphology in shaping synaptic integration.NEW & NOTEWORTHY Neuronal filtering and integration of synaptic input patterns depend on the electrochemical properties of dendrites. We used an identified collision detection neuron in grasshoppers to examine how its morphology and two conductances affect its membrane impedance in relation to the computations it performs. The neuronal properties examined are ubiquitous and therefore promote a general understanding of neuronal computations, including those in the human brain.

Keywords: collision avoidance; dendritic processing; lobula giant movement detector; membrane impedance.


Conflict of interest statement

No conflicts of interest, financial or otherwise, are declared by the authors.

Figures

Fig. 1.
Fig. 1.
Spontaneous and looming stimulus-evoked spectral power density of the lobula giant movement detector’s (LGMD) membrane potential. A: micrograph of the LGMD, illustrating its dendritic fields (labeled A, B, and C), the spike initiation zone (marked with *) at the start of the axon, and the soma, which lies outside of the neuron’s electrical signal path (adapted from Gabbiani et al. 2002 with permission). Scale bar, 25 μm. B: example recording of dendritic membrane potential within the LGMD while the eye was exposed to uniform illumination (Vm low-pass filtered at 10 kHz and digitized at 40 kHz). C: Vm power was concentrated at frequencies below 5 Hz (black; axes on logarithmic scale). During looming stimuli, the signal power increased 125-fold but remained concentrated at low frequencies (blue). Inset: the data with a linear y-axis scale; solid lines and shaded regions are means ± SE (16 animals). D: a looming stimulus consists of a black square expanding symmetrically on the animal’s retina (bottom). It simulates an object of half-size l approaching on a collision course at constant velocity v (< 0), subtending an angular size 2θ(t) at the retina (top). E: looming stimuli produce an angular size that increases nonlinearly over time (top, blue line). Most of the response to looming stimuli occurs shortly before the projected time of collision, as can be seen in the average membrane potential (Vm, middle) and firing rate (f; bottom, displayed as mean ± SE for 59 looming stimuli in 16 animals). F: wavelet analysis of the Vm power density reveals that during spiking there is increased high-frequency power (dashed rectangle), but the peak power remains at frequencies <10 Hz. Plot displays the average power density map of the same 59 looming responses shown in C and E.
Fig. 2.
Fig. 2.
Characterization of lobula giant movement detector’s (LGMD) membrane impedance profile with in vivo dendritic recordings. A: either single or dual recordings were made from dendritic field A and the primary neurite connecting field A to the spike initiation zone. Image taken with a CCD camera during a dual recording after staining the LGMD with Alexa Fluor 594. The internal solution of both electrodes contained Alexa Fluor 594 for visualization. Red and green ellipses encompass the region sampled by the proximal and distal electrodes, respectively, across 11 recording pairs (8 animals). B: to measure membrane impedance, chirp currents (sine waveforms of increasing frequency) were injected at different steady-state membrane potentials (Vss). At top is an example of a linearly increasing chirp current (Im) followed by 4 recordings of the membrane potential (Vm) in response to this chirp current superposed on different holding currents (Ihold). The values of Ihold and Vss (dashed lines) were 2, 0, −2, −4 nA and −56, −64, −74, −86 mV, respectively (from top to bottom). C: example traces of low- and high-frequency sections of the measured membrane current and potential. At low frequencies the current and potential are synchronous (~0° impedance phase), but at high frequencies the potential trails the current (negative impedance phase). Note that at high frequencies the membrane potential is reduced relative to the current, indicating a reduction in impedance amplitude. D: impedance properties were similar when measured in voltage clamp. E: example traces of backpropagating action potentials (bAPs) from the 2 recording electrodes and bars indicating that the bAP amplitudes were measured from the resting membrane potential to their peaks. The trace colors correspond to the electrode positions in A. Mean bAP amplitudes were 32 and 26 mV for the proximal and distal electrode, respectively. F: as the relative electrotonic distance increased between recording electrodes (estimated by the difference in amplitudes of the bAP), there was an increase in attenuation (top; R2 = 0.40, P = 3.2 × 10⁻⁶), in the phase lag (middle; R2 = 0.17, P = 1.9 × 10⁻⁴), and in the time lag (bottom; R2 = 0.15, P = 2.7 × 10⁻⁴). Each point and error bar report the mean value and SD (across different Vss values) for a recording pair (11 recording pairs from 8 animals).
Fig. 4.
Fig. 4.
Lobula giant movement detector (LGMD) membrane synchrony and consistency across membrane potentials. A: input (ZIN) and transfer (ZTR) impedance phase profiles (mean ± SD) level off around −30° and −45°. ZIN: 53 recordings from 47 animals. ZTR: 13 recording pairs from 10 animals. B: the same data in A at an expanded scale show that the phases for both ZIN and ZTR were inductive (exhibited positive phase) at frequencies < 1 Hz. C: the phase increased slightly with depolarization. For ZIN the increase was 0.13°/mV (r = 0.42, P < 1 × 10⁻⁶) with 304 steady-state membrane potential (Vss) values from 53 recordings. ZTR increased 0.12°/mV (r = 0.46, P = 1.6 × 10⁻⁵) with 81 Vss values from 13 recordings. D and E: impedance locus plots show the real (resistance) and imaginary (reactance) components of the impedance, pooled across frequencies (dashed arrow). The membrane inductance at low frequencies is evidenced by the points with positive reactance. At hyperpolarized potentials, resistance increased but otherwise the LGMD maintained a consistent profile across membrane potentials. F: phase (ϕ) lag of membrane potential (Vm) at the “recording-only” location relative to that at the “recording and current injection” location. At frequencies <1 Hz there was a phase advance, with the more distant location preceding the input location (inset). The phase lag increased steadily with frequency. G: ZIN and ZTR delay are the lag between the input current and local Vm at the 2 recording locations. Vm transfer delay is the mean lag between Vm at the 2 recording locations. ZTR delay decreased with membrane depolarization (P = 0.0002), unlike ZIN (P = 0.22) or Vm transfer (P = 0.33).
Fig. 3.
Fig. 3.
Lobula giant movement detector (LGMD) membrane impedance amplitude and voltage attenuation decrease slightly with frequency and membrane potential (Vm). A: input (ZIN) and transfer (ZTR) impedance amplitude profiles displayed as means ± SD (lines and shaded regions): 53 recordings from 47 animals for ZIN and 13 recordings from 10 animals for ZTR. B: histogram of similarity of individual trials to the recording mean impedance profile measured at different steady-state membrane potentials (Vss, see Fig. 2B): 81 Vss values for ZTR and 304 Vss values for ZIN. C: the impedance amplitude (plotted relative to the recording mean) decreased with depolarization. Input amplitude decreased by 0.032 MΩ/mV (r = −0.40, P = 7.6× 10⁻⁹), and transfer amplitude decreased by 0.006 MΩ/mV (r = −0.32, P = 0.004; Pearson linear correlations). D: voltage attenuation (Vatt) had higher variation between recordings than impedance amplitude (mean coefficient of variation of 0.61 for attenuation and 0.22 for transfer amplitude), with ~20–35% reduction in voltage between dendritic locations. Same recordings as for ZTR. E: the frequency variation (fvar) of the input and transfer impedance amplitude as well as that of voltage attenuation decreased slightly with membrane depolarization. The fvar shows consistency across frequencies, with a value of 0 indicating an ideal resistor.
Fig. 5.
Fig. 5.
Blockade of either hyperpolarization-activated cyclic nucleotide-gated (HCN) or muscarine-sensitive (M) channels increased impedance frequency variation and delay between membrane current (Im) and potential (Vm). A: example chirp currents (top) and Vm responses (bottom) before (left, black) and after (right, red) ZD7288 application. Data from 9 recordings at 36 steady-state membrane potential (Vss) values from 6 animals. B: after block of HCN channels with ZD7288, input impedance (ZIN) increased 2-fold at low frequencies. Population average impedance (across animals and Vss) is shown as mean ± SE (solid line and shaded region). The gray line is the difference between the averages. C: impedance phase decreased at all frequencies after HCN blockade, reducing Im-Vm synchrony. D: example chirp currents (top) and responses (bottom) before (left) and after (right) XE991 application. Data include 6 recordings at 14 Vss values from 6 animals. E: after block of M channels with XE991, a large increase in low-frequency ZIN was seen with peak at 3.5 Hz. Arrowheads indicate resonant frequencies. F: after M channel block, impedance phase increased at low frequencies (<2 Hz) but decreased at higher frequencies. G: the increased low-frequency impedance after blockade of HCN or M channels produced higher ZIN frequency variations across Vss. ZIN frequency variation is displayed as linear fit (solid lines) and 95% confidence intervals (dotted lines). M channel blockade increased frequency variation mainly at depolarized potentials, whereas HCN blockade had a greater effect at hyperpolarized potentials. H: the resonance strength, calculated as the maximum impedance amplitude divided by steady-state impedance amplitude [|ZIN(0)|], was <1.2 for all membrane potentials under control conditions and after HCN-channel block. After M-channel block, however, a larger resonance was observed at depolarized membrane potentials. I: the mean absolute time lag between the input current and local membrane potential increased by ~1 ms after HCN-channel block (red) and ~2 ms after M-channel block (green). Control data (black) are the same as shown in F. Control data from 53 recordings at 181 Vss values from 47 animals.
Fig. 7.
Fig. 7.
Simplified morphology simulations reveal that local reduction of axial conductance increases the net transfer impedance (ZTR). A: the mean transfer amplitude was measured as in Fig. 6H, with the data from the full lobula giant movement detector (LGMD) model the same (black line). Compressing each of the LGMD's dendritic fields into an electrotonically equivalent cable (LGMD EEC, dashed line) produced little change in ZTR amplitude. A 10-µm-diameter uniform cable (blue) and a Rall branching model (red) had mean transfer amplitudes within 1% of an isopotential equivalent for all frequencies. Reducing the diameter at each branch point (Rall with pinch, gray) increased the mean transfer amplitude; inset shows detail of pinch. B: mean transfer amplitude was measured for a series of unbranched cables [2 with uniform 2- and 20-µm diameters are illustrated here (magenta and green)], a tapered cable (gray), a cable with random diameters with mean of 20 µm (blue), and a 10-µm cable with 10 points pinched to 0.5 µm (red). |ZTR(0)|, transfer impedance amplitude at 0 Hz. C and D: the mean transfer delay, plotted as in Fig. 6J. All manipulations that produced larger mean transfer amplitudes also produced shorter mean transfer delays.
Fig. 6.
Fig. 6.
Simulations of passive neurons reveal the influence of morphology on impedance characteristics. A: every section of the lobula giant movement detector (LGMD) model (thin black lines) had shorter input impedance (ZIN) delays than an isopotential model (dashed line). B: all sections of the LGMD model (thin black lines) exhibited a decrease in ZIN amplitude smaller than that of an isopotential model (dashed line). For each section the impedance amplitude is normalized to impedance at 0 Hz [|ZIN(0)|]. The difference between the ZIN amplitude and that of an isopotential model was maximal at ~200 Hz. C: the effect of neuronal morphology on impedance was tested in the LGMD (black) and 4 other cell morphologies of different size and shape: a cerebellar Purkinje cell (purple), a hippocampal CA1 pyramidal cell (PC) (red), a cortical layer 2/3 pyramidal cell (blue), and a CA1 oriens-lacunosum/moleculare interneuron (OLM; green). D: all neuron models tested had large decreases in input delay compared with an isopotential equivalent model. Data are color coded as in C and presented as means ± SD (solid lines and shaded regions). E: all morphologies had more consistent ZIN amplitude relative to their isopotential equivalents, with lower frequency variation. Data presented as in D. F: data from example dendritic segments of the LGMD model show that at 35 Hz the transfer impedance (ZTR) delay (left) increased and the amplitude (right) decreased with distance from the site of current injection (arrowheads). Segments for which ZTR had higher amplitude or shorter delay than that of an isopotential equivalent neuron (dashed line) are brown. Data in G and I were measured by summing the surface area of brown segments and dividing by the total surface area. G: for each neuron model segment, we summed the surface area of other model segments for which signal transfer was increased compared with an isopotential equivalent and divided by the neuron’s total surface area. Bar widths indicate how many model segments had improved transfer (higher gain and lower delay) for each percentage range, and gray squares mark the average segment. All morphologies had increased transfer amplitudes compared with an isopotential equivalent model (zero axial resistance), with the LGMD and Purkinje morphologies having improved transfer for a smaller percentage of the neuron segments. Gray stars indicate mean value for the LGMD model where the 3 dendritic fields were collapsed into 3 electrotonically equivalent cylinders. H: for all models, an average all-to-all ZTR was measured as a function of frequency and compared to the impedance of an isopotential equivalent. The increase of each cell's mean transfer amplitude as a function of frequency from isopotential reveals a band-pass increase in average transfer gain. I: the percentage of membrane area with reduced transfer delay for each morphology was similar to that with an increase in transfer gain. Plotted as in G. J: the average all-to-all transfer delay from membrane current to membrane potential for each model was similar, with no difference at low frequencies, a slightly longer delay near the frequency of the cell’s peak gain, and reduced delays at higher frequencies. In G and I, the black horizontal line marks the level of equal surface area with improved or reduced ZTR.
Fig. 8.
Fig. 8.
Lobula giant movement detector (LGMD) model simulations show influence of hyperpolarization-activated cyclic nucleotide-gated channel-mediated (gH) and muscarine-sensitive-channel-mediated (gM) conductances on sensitivity to synaptic input timing and impedance profile. A: example traces of model responses to 200 excitatory synaptic inputs with 25-ms jitter. In the full and the leak-with-inductance (gL) models no spike was generated. In models without gH or gM, or if they were replaced by a leak conductance (gleak) a burst of spikes was generated. Spikes are truncated at dashed line. B: in the full LGMD model (black) synchronous inputs reliably generated spikes, but for inputs with less reliable input timing (jitter > 20 ms) spikes were not produced. Removal of gH and gM (blue) reduced the timing discrimination. When the active conductances were replaced by a leak conductance the selectivity was partially restored (green). Replacing gH and gM with an inductive leak (magenta; see materials and methods) fully restored the sensitivity to synaptic timing. C: the full LGMD model generated spikes with a short latency after the inputs began. After gH and gM blockade spikes occurred later and with less reliable timing. Restoration of the conductance (green) and inductance (magenta) both reduced spike latency and timing variability. D and E: the frequency variation and mean absolute delay from membrane current to membrane potential of the full model (at −65 mV) matched that of LGMD experimental data (cf. Figs. 3E and 4G) and were both increased by the removal of gH and gM. ZIN, input impedance. F and G: the impedance amplitude and phase profiles (at −65 mV) for the full model were similar to experimental data (cf. Figs. 3A and 4A). The effects of blocking gH and gM were qualitatively similar to experimental data, but the changes were of smaller magnitude (cf. Fig. 5). For C–G, error bars and shaded regions are ± 1 SD. For C variability was measured across trials. For D–G, the variability was measured across different model sections corresponding to the same region of dendritic field A as the experimental recordings.

References

    1. Anderson WD, Galván EJ, Mauna JC, Thiels E, Barrionuevo G. Properties and functional implications of Ih in hippocampal area CA3 interneurons. Pflugers Arch 462: 895–912, 2011. doi:10.1007/s00424-011-1025-3. - DOI - PubMed
    1. Barrow AJ, Wu SM. Low-conductance HCN1 ion channels augment the frequency response of rod and cone photoreceptors. J Neurosci 29: 5841–5853, 2009. doi:10.1523/JNEUROSCI.5746-08.2009. - DOI - PMC - PubMed
    1. Branco T, Clark BA, Häusser M. Dendritic discrimination of temporal input sequences in cortical neurons. Science 329: 1671–1675, 2010. doi:10.1126/science.1189664. - DOI - PMC - PubMed
    1. Branco T, Häusser M. Synaptic integration gradients in single cortical pyramidal cell dendrites. Neuron 69: 885–892, 2011. doi:10.1016/j.neuron.2011.02.006. - DOI - PMC - PubMed
    1. Cole KS. Rectification and inductance in the squid giant axon. J Gen Physiol 25: 29–51, 1941. doi:10.1085/jgp.25.1.29. - DOI - PMC - PubMed

Publication types

MeSH terms

Substances

LinkOut - more resources