

Review
doi: 10.1056/NEJMra1809315.
Genetic Variation, Comparative Genomics, and the Diagnosis of Disease
Affiliations
- PMID: 31269367
- PMCID: PMC6681822
- DOI: 10.1056/NEJMra1809315
Item in Clipboard
Review
Genetic Variation, Comparative Genomics, and the Diagnosis of Disease
N Engl J Med.
.
No abstract available
Figures
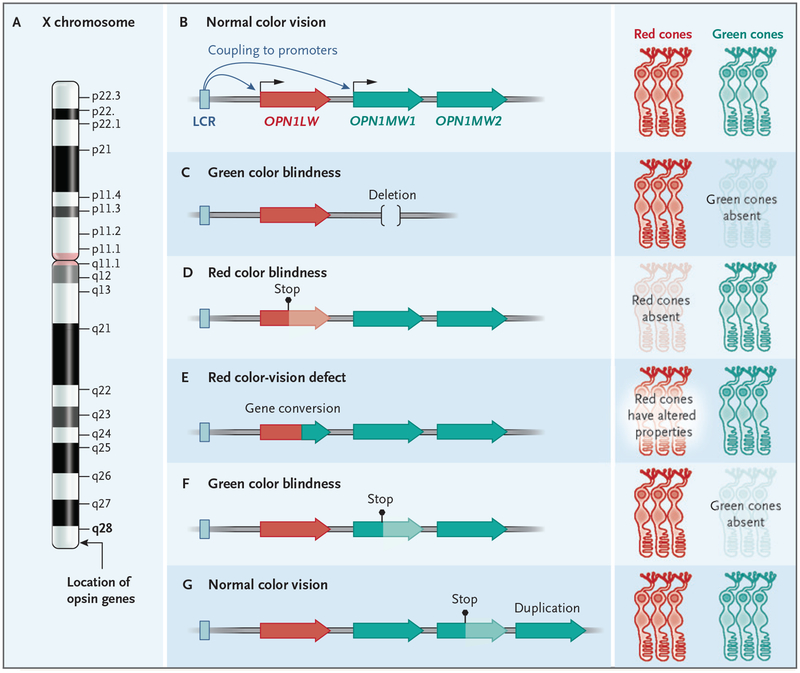
Genes encoding the red (OPN1LW) and green (OPN1MW1 and OPN1MW2) opsins are organized in a head-to-tail configuration on the X chromosome (Panel A). The locus control region (LCR) couples to the promoter of the red opsin or the first green opsin gene to drive transcription and leads to the formation of either red or green cones in the retina. Below the canonical organization (Panel B), five different human mutations are shown, including deletion of the green opsins, leading to green color blindness (Panel C); a stop codon mutation in the red opsin gene, resulting in red color blindness (Panel D); a gene conversion event creating a red–green hybrid gene, resulting in protanomalous color vision (Panel E); a stop codon in the most proximal gene, resulting in green color blindness (Panel F); and a duplication and stop mutation in distal green opsin genes, which have no effect on color vision because distal copy genes are rarely expressed in the retina (Panel G). The sequence structure, regulation, and copy-number variation are key to understanding the genotype–phenotype correlation of this human trait.
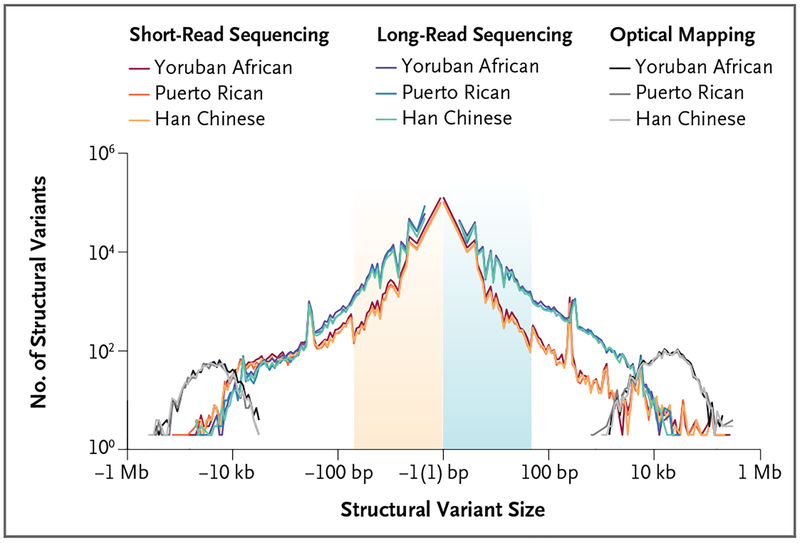
Shown is a comparison of the number of structural variants (gains or losses of DNA shown on a log scale) as a function of variant size among the same three human genomes, detected with the use of different variant discovery technologies. Structural variants, insertions, and deletions were discovered by short-read sequencing, long-read sequencing (e.g., PacBio), and optical mapping technology (e.g., Bionano Genomics). Short-read sequencing shows reduced sensitivity for the detection of structural variants, especially insertions of 50 bp to 2000 bp. Both technologies underperform for sequence resolution of larger multi-copy-number variants (>10,000 bp); optical mapping technology can be used to detected such variants but not to resolve their sequence organization. Adapted from Chaisson et al.
References
-
- Deeb SS. The molecular basis of variation in human color vision. Clin Genet 2005; 67: 369–77. - PubMed
Publication types
MeSH terms
Grants and funding
LinkOut - more resources
Full Text Sources
Medical