. 2019 Jul 2;28(1):132-144.e3.
doi: 10.1016/j.celrep.2019.05.109.

Ultra-Sensitive TP53 Sequencing for Cancer Detection Reveals Progressive Clonal Selection in Normal Tissue over a Century of Human Lifespan

Affiliations

Ultra-Sensitive TP53 Sequencing for Cancer Detection Reveals Progressive Clonal Selection in Normal Tissue over a Century of Human Lifespan

Jesse J Salk et al. Cell Rep. .

Abstract

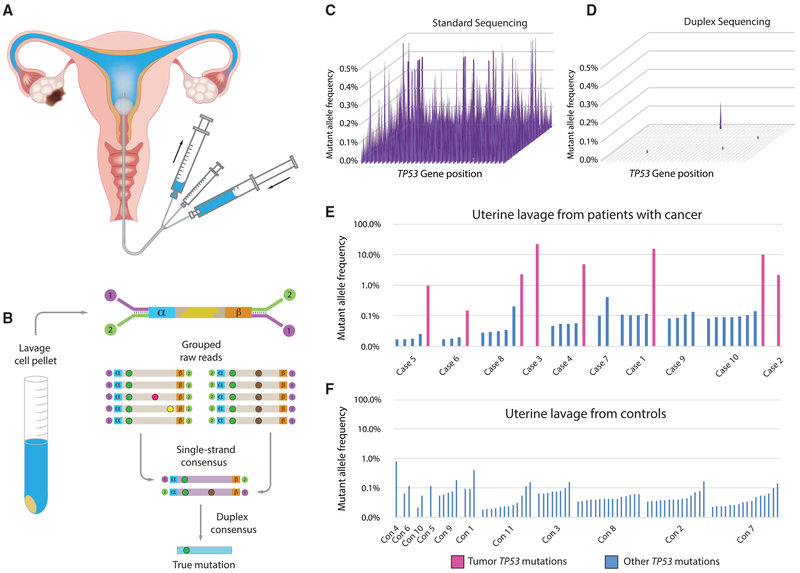
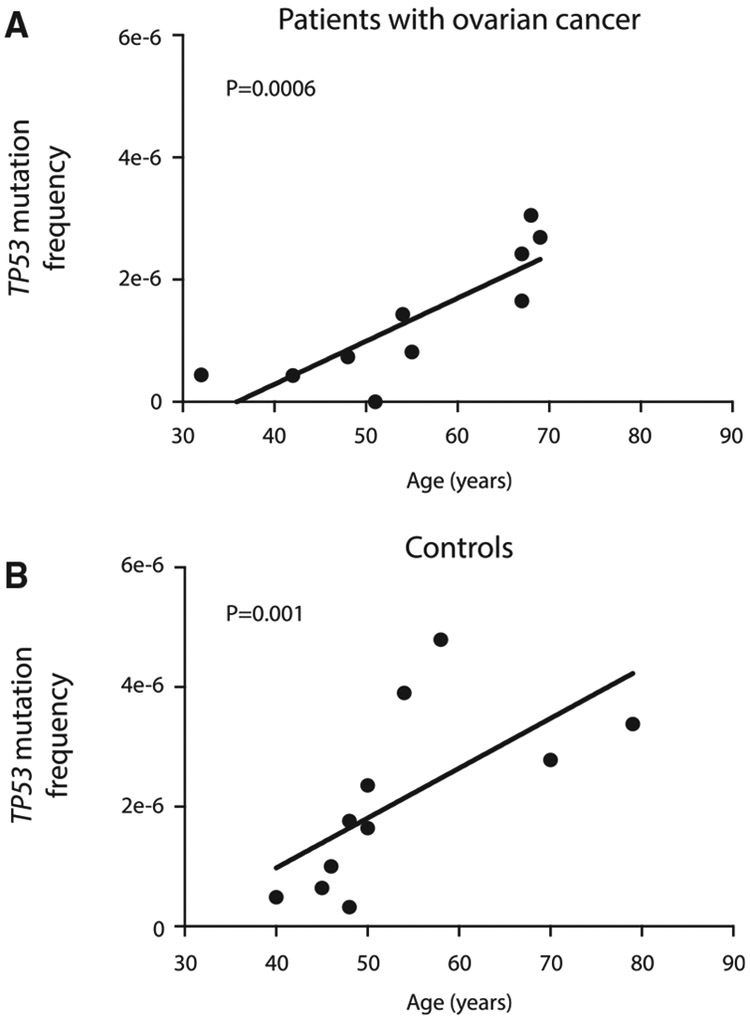
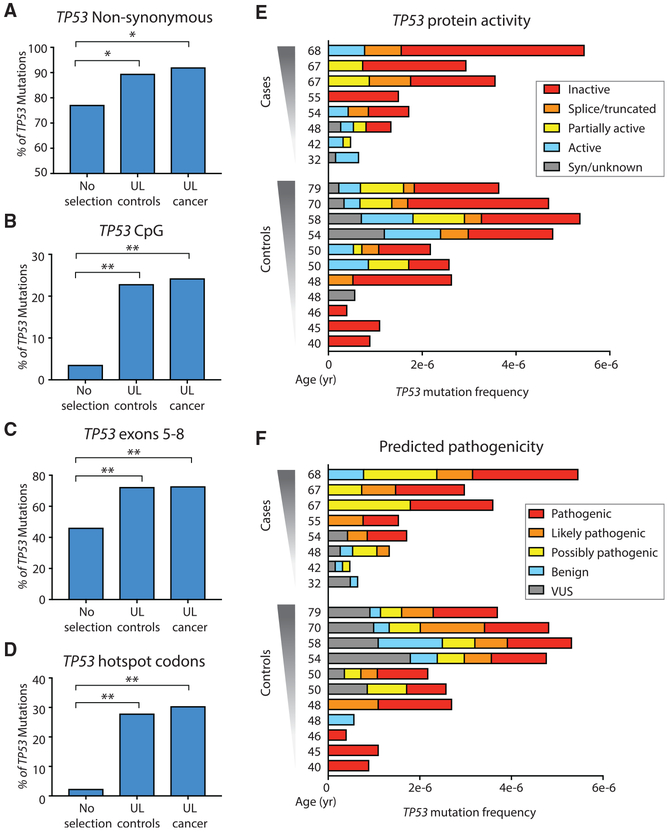
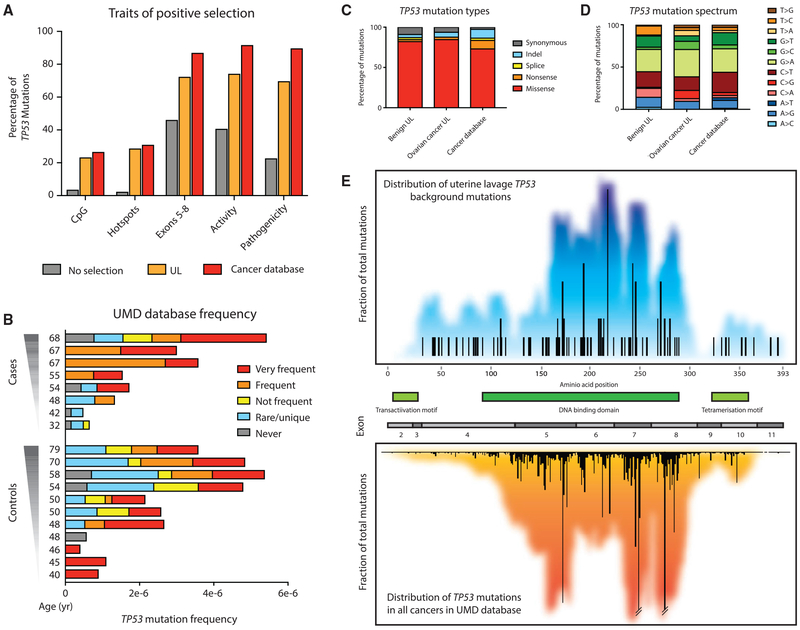
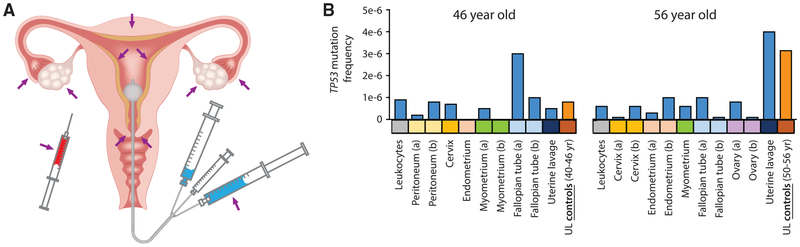
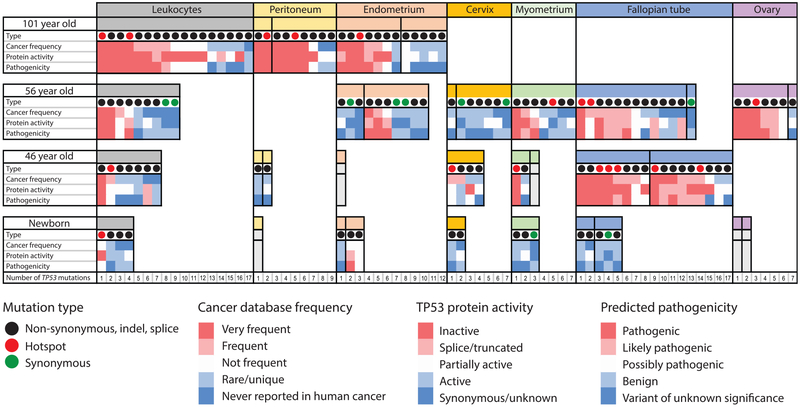
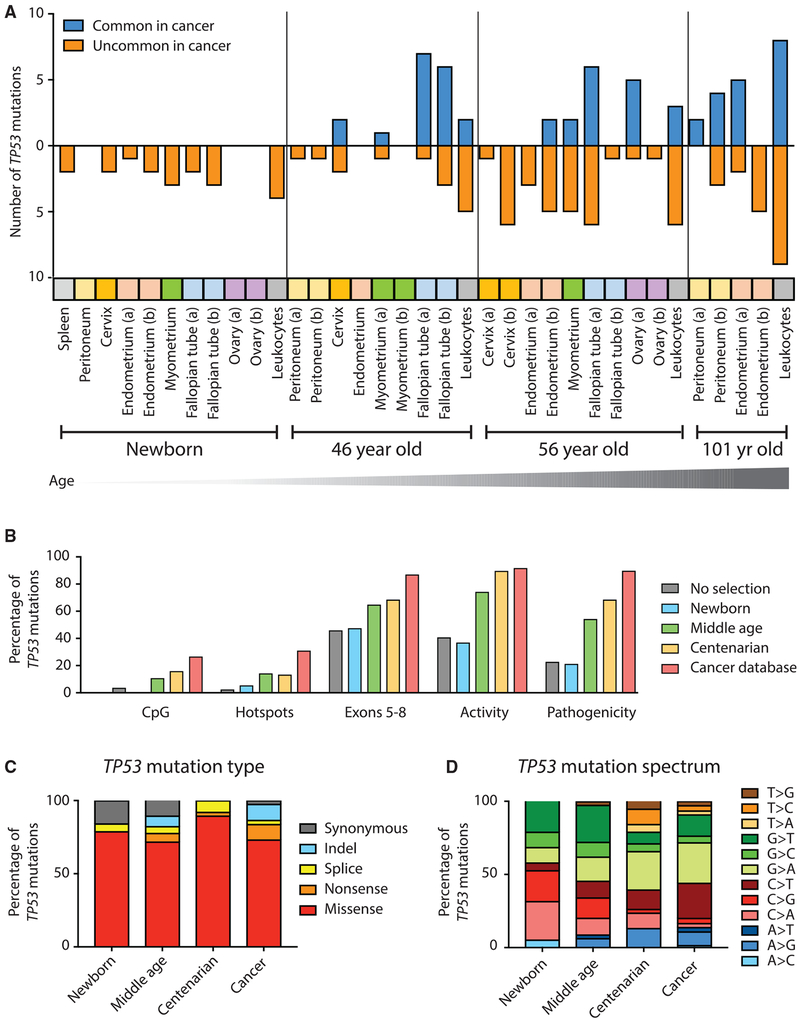
High-accuracy next-generation DNA sequencing promises a paradigm shift in early cancer detection by enabling the identification of mutant cancer molecules in minimally invasive body fluid samples. We demonstrate 80% sensitivity for ovarian cancer detection using ultra-accurate Duplex Sequencing to identify TP53 mutations in uterine lavage. However, in addition to tumor DNA, we also detect low-frequency TP53 mutations in nearly all lavages from women with and without cancer. These mutations increase with age and share the selection traits of clonal TP53 mutations commonly found in human tumors. We show that low-frequency TP53 mutations exist in multiple healthy tissues, from newborn to centenarian, and progressively increase in abundance and pathogenicity with older age across tissue types. Our results illustrate that subclonal cancer evolutionary processes are a ubiquitous part of normal human aging, and great care must be taken to distinguish tumor-derived from age-associated mutations in high-sensitivity clinical cancer diagnostics.

Keywords: Duplex Sequencing; TP53, clonal evolution; aging; early detection; gynecologic oncology; high-grade serous ovarian cancer; next-generation sequencing; somatic mutations; uterine lavage.


Conflict of interest statement

DECLARATION OF INTERESTS

J.J.S. and L.A.L. are founders and equity holders at TwinStrand Biosciences. J.J.S., C.C.V., L.N.W., and J.E.H. are employees and equity holders at TwinStrand Biosciences. P.S. is a founder and equity holder in Ovartec. R.Z. is a founder and equity holder in Oncolab GmbH. R.A.R. shares equity in NanoString Technologies and is the principal investigator in an NIH Small Business Innovation Research (SBIR) subcontract research agreement with TwinStrand Biosciences. Commercial uses of Duplex Sequencing are protected by multiple patents held or licensed by the University of Washington and TwinStrand Biosciences. Commercial uses of uterine lavage for cancer screening and diagnosis are protected by multiple patents licensed or held by the Medical University of Vienna and Ovartec.

Figures

Figure 1.
Figure 1.. Detection of Ovarian Cancer Using UL and DS
(A) UL is carried out by passing a small catheter through the cervix, followed by concurrent flushing and aspiration with 10 mL of saline. (B) After cell isolation by centrifugation, DNA is extracted, fragmented, and ligated with DS adapters, which include degenerate molecular tags (α and β). Following amplification, hybrid capture, and sequencing, reads sharing the same tags are grouped and mutations are scored only if present in both strands of each original DNA molecule. (C and D) Each spot on the 2D surface represents one of the 1,179 coding positions in TP53. The y axis indicates mutant allele frequency (MAF). By standard NGS, all positions show false mutations (C). DS of the same sample (case 6 in E) eliminates errors and reveals only true mutations (D). (E and F) TP53 mutations identified by DS in UL from women with ovarian cancer (E) and women who are cancer-free (controls; F). Fuchsia bars, matching tumor mutation; blue bars, biological background mutations. Mutations are sorted by ascending MAF within each patient and patients are sorted by age.
Figure 2.
Figure 2.. The Frequency of TP53 Mutations in UL Increases with Age
Frequency is calculated as the total number of unique TP53 mutations identified in each sample (including exons and flanking intronic regions) divided by the total number of DS nucleotides sequenced. (A) UL samples from patients with ovarian cancer; n = 10, r = 0.89, p = 0.0006 by Spearman’s correlation test. (B) UL samples from control patients without cancer; n = 11, r = 0.83, p = 0.001 by Spearman’s correlation test.
Figure 3.
Figure 3.. Evidence of Positive Selection in TP53 Background Mutations from ULs
(A–D) Percentage of non-synonymous TP53 mutations (A), and percentage of TP53 mutations localized in CpG dinucleotides (B), in exons 5–8 (C), and in hotspot codons (D). For (A–D), TP53 mutations identified in UL from controls and cancer significantly exceed expected values without selection. *p < 0.05, **p < 0.0001 by binomial exact test, n = 79 for UL controls, and n = 33 for UL cancer. (E and F) Protein activity (E) and predicted pathogenicity (F) color-coded as five groups from Seshat data. Patients are sorted by ascending age. For each patient, TP53 mutation frequency is calculated as the number of mutations in the coding region divided by the total number of DS nucleotides sequenced in that region. Two cancer patients with unusually low sequencing depth and no identified TP53 mutations are not shown. Nearly all cases and controls carry mutations that have an impact on protein activity and predicted pathogenicity.
Figure 4.
Figure 4.. TP53 Mutations in UL Are Very Similar to TP53 Mutations Found in Human Cancers
(A) Traits of positive selection are compared between all of the possible mutations in the TP53 coding region (no selection; n = 3,546), TP53 background mutations found in UL (n = 112), and TP53 mutations reported in the UMD cancer database (n = 71,051). (B) UL mutations in cases and controls color-coded by their abundance in the UMD TP53 database. For each sample, TP53 mutation frequency is calculated as the number of mutations in the coding region divided by the total number of DS nucleotides sequenced in that region. Most samples harbor TP53 mutations that are common in the database. (C and D) TP53 mutation type (C) and TP53 mutation spectrum (D) are compared between mutations identified in UL from controls (n = 79), UL from cases (n = 33), and the UMD database (n = 71,051). (E) TP53 mutation distribution map for UL (top) and the UMD cancer database (bottom). Bars quantify the frequency of mutations at each codon. Colored background reflects a 20-bp sliding window average of mutation density around each position. Gene exons and protein domains are indicated in the center section.
Figure 5.
Figure 5.. TP53 Mutations in Normal Tissues and UL from Two Middle-Aged Women
(A) Normal tissues collected included leukocytes, peritoneum, cervix, endometrium, myometrium, fallopian tube, ovary, and UL. (B) TP53 mutation frequency for each sample calculated as the number of TP53 mutations in the coding region divided by the total number of DS nucleotides sequenced. (a) and (b) indicate two spatially separated samples from the same tissue. The blue bars correspond to the samples in this study; the orange bars correspond to the mean values for ULs from control women in the first study.
Figure 6.
Figure 6.. Characterization of TP53 Mutations in Normal Tissues over a Century of Human Lifespan
TP53 mutations identified by DS in leukocytes and gynecological tissues are indicated as columns within each tissue. Each mutation is characterized by four parameters: type (synonymous, non-synonymous, and hotspots), frequency in cancer, protein activity, and predicted pathogenicity. The last three parameters are color-coded, with red indicating “cancer-like” mutations and blue indicating benign mutations. Vertical black lines separate different biopsies from the same tissue. Within each biopsy, mutations are ordered left to right by decreasing cancer frequency. The biopsies that were sequenced but no mutations were identified are shown in gray. Note that the female newborn in the study had no blood collected. The leukocytes included here correspond to a similarly aged newborn male.
Figure 7.
Figure 7.. Cancer-Associated TP53 Mutations Are Positively Selected during Normal Aging
(A) Across a variety of human tissues, TP53 mutations accumulate with age and are progressively enriched for mutations commonly found in cancers. Tissues are color-coded. (a) and (b) indicate two biopsies from the same tissue. (B) Traits of positive selection are compared between all of the possible mutations in the TP53 coding region (n = 3,546); TP53 mutations found in newborns (n = 19), middle-aged individuals (n = 85), and centenarian individuals (n = 38); and TP53 mutations reported in the UMD cancer database (n = 71,051). (C and D) Distribution of TP53 mutation type (C) and mutation spectrum (D) for newborn, middle-aged, and centenarian mutations compared to the UMD cancer database.

Similar articles

Cited by

References

    1. Abyzov A, Tomasini L, Zhou B, Vasmatzis N, Coppola G, Amenduni M, Pattni R, Wilson M, Gerstein M, Weissman S, et al. (2017). One thousand somatic SNVs per skin fibroblast cell set baseline of mosaic mutational load with patterns that suggest proliferative origin. Genome Res. 27, 512–523. - PMC - PubMed
    1. Acuna-Hidalgo R, Sengul H, Steehouwer M, van de Vorst M, Vermeulen SH, Kiemeney LALM, Veltman JA, Gilissen C, and Hoischen A (2017). Ultra-sensitive Sequencing Identifies High Prevalence of Clonal Hematopoiesis-Associated Mutations throughout Adult Life. Am. J. Hum. Genet 101, 50–64. - PMC - PubMed
    1. Ahmed AA, Etemadmoghadam D, Temple J, Lynch AG, Riad M, Sharma R, Stewart C, Fereday S, Caldas C, Defazio A, et al. (2010). Driver mutations in TP53 are ubiquitous in high grade serous carcinoma of the ovary. J. Pathol 221, 49–56. - PMC - PubMed
    1. Alexandrov LB, Jones PH, Wedge DC, Sale JE, Campbell PJ, Nik-Zainal S, and Stratton MR (2015). Clock-like mutational processes in human somatic cells. Nat. Genet 47, 1402–1407. - PMC - PubMed
    1. Alix-Panabières C, and Pantel K (2016). Clinical Applications of Circulating Tumor Cells and Circulating Tumor DNA as Liquid Biopsy. Cancer Discov. 6, 479–491. - PubMed

Publication types

MeSH terms