. 2019 Jul 2;28(1):172-189.e7.
doi: 10.1016/j.celrep.2019.06.007.

The Cardiac Microenvironment Instructs Divergent Monocyte Fates and Functions in Myocarditis

Affiliations

The Cardiac Microenvironment Instructs Divergent Monocyte Fates and Functions in Myocarditis

Xuezhou Hou et al. Cell Rep. .

Abstract

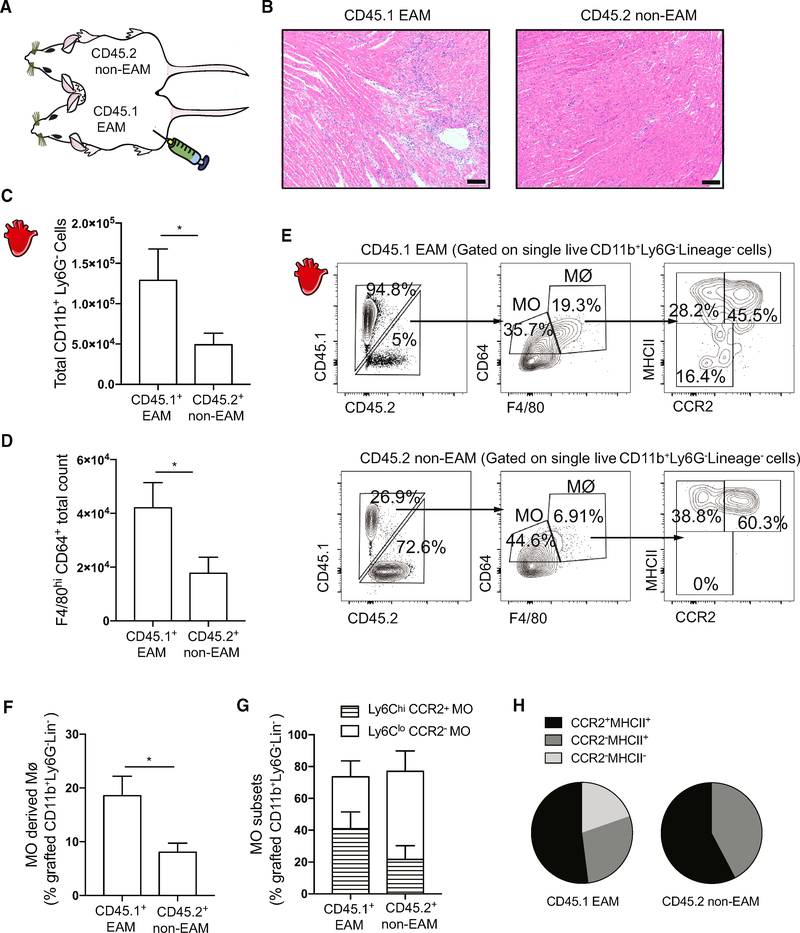
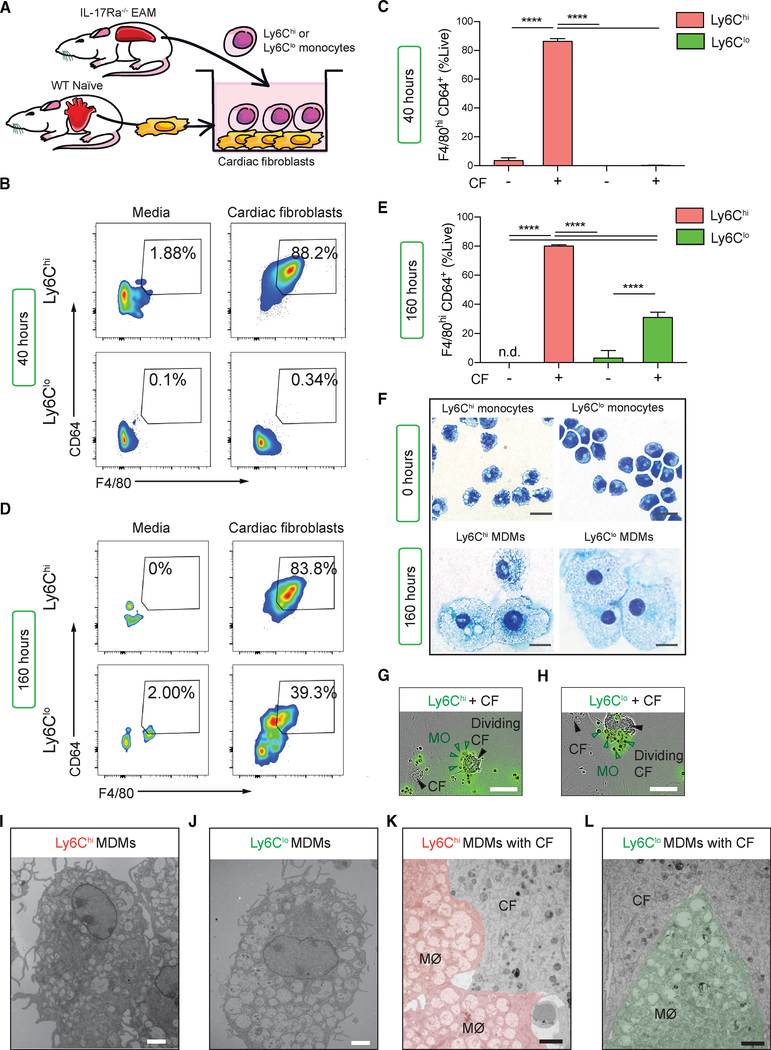
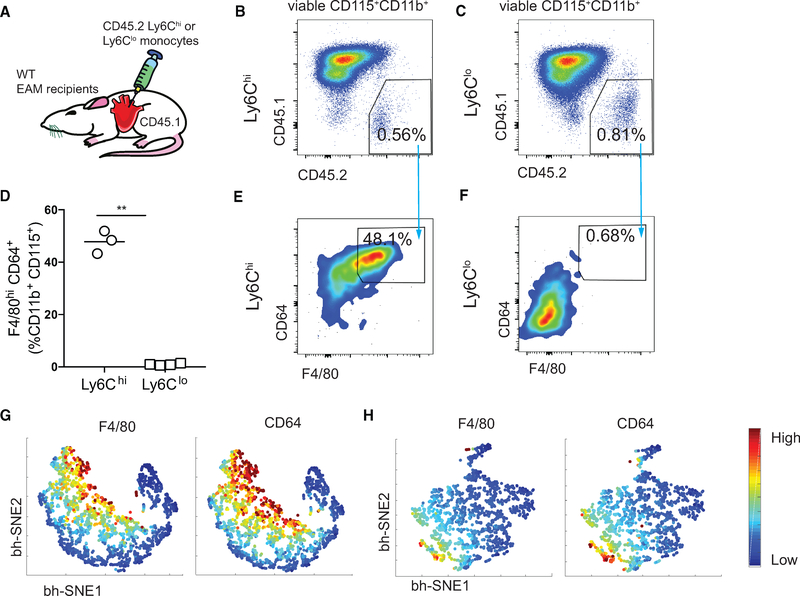
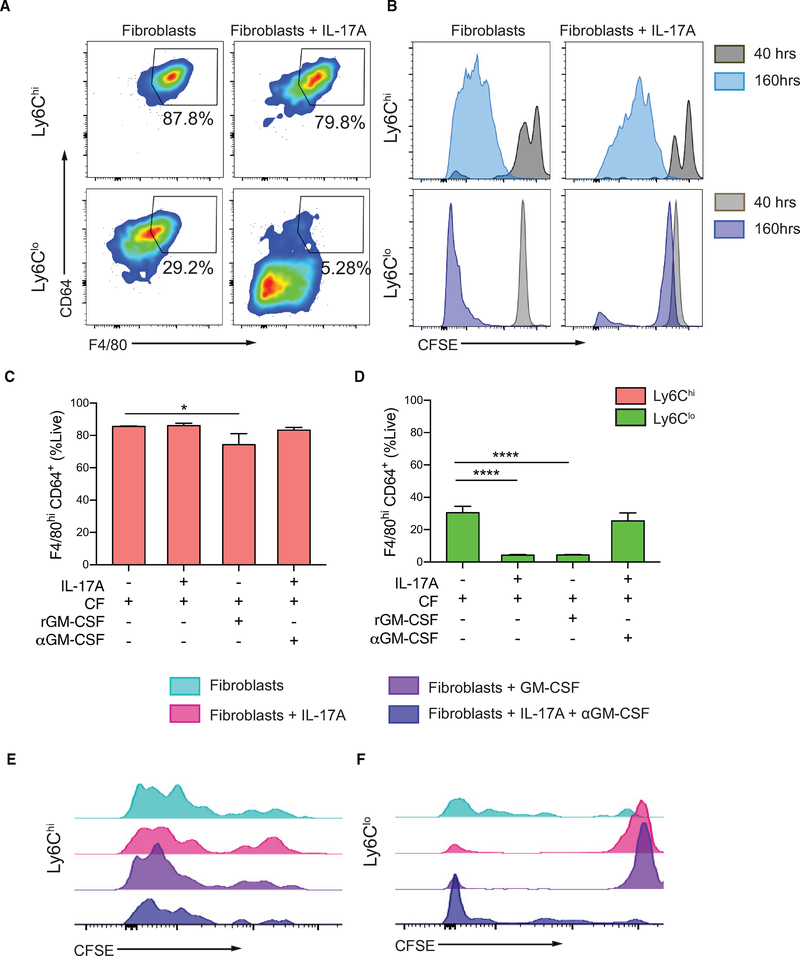
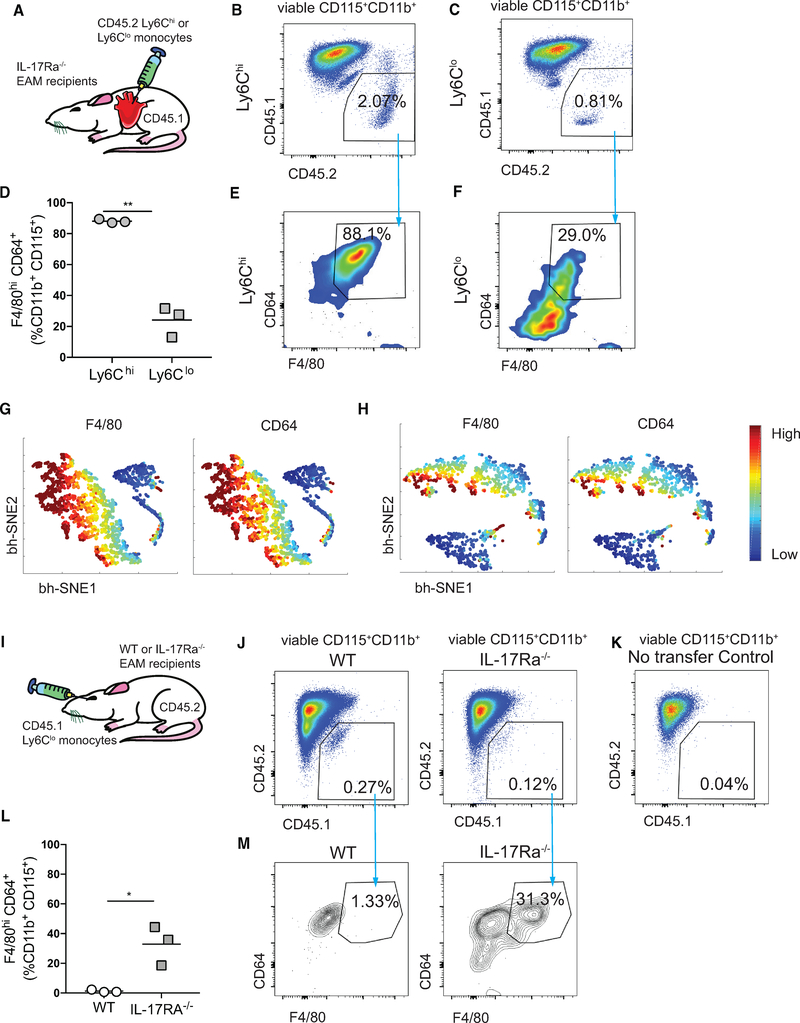
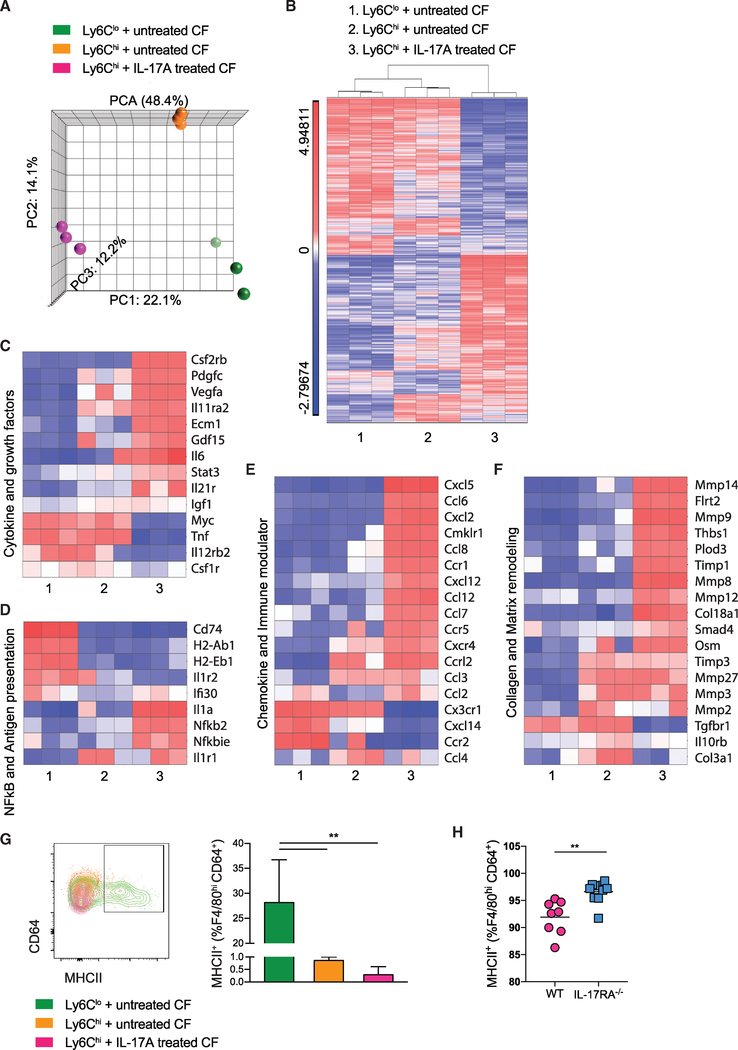
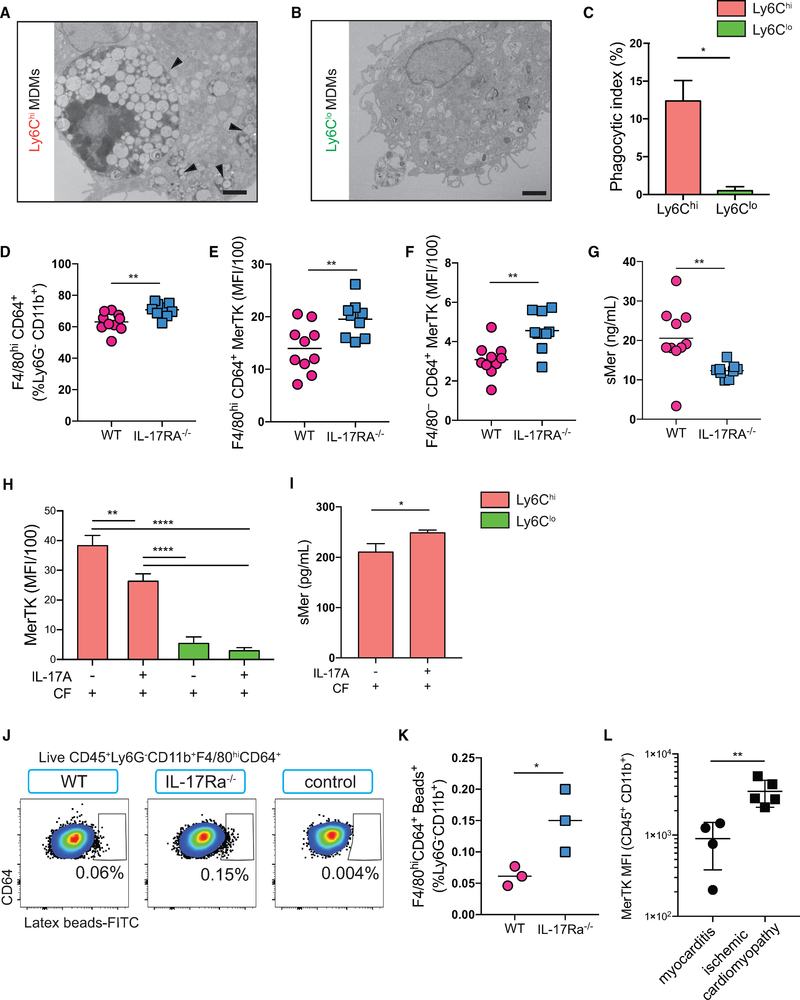
Two types of monocytes, Ly6Chi and Ly6Clo, infiltrate the heart in murine experimental autoimmune myocarditis (EAM). We discovered a role for cardiac fibroblasts in facilitating monocyte-to-macrophage differentiation of both Ly6Chi and Ly6Clo cells, allowing these macrophages to perform divergent functions in myocarditis progression. During the acute phase of EAM, IL-17A is highly abundant. It signals through cardiac fibroblasts to attenuate efferocytosis of Ly6Chi monocyte-derived macrophages (MDMs) and simultaneously prevents Ly6Clo monocyte-to-macrophage differentiation. We demonstrated an inverse clinical correlation between heart IL-17A levels and efferocytic receptor expressions in humans with heart failure (HF). In the absence of IL-17A signaling, Ly6Chi MDMs act as robust phagocytes and are less pro-inflammatory, whereas Ly6Clo monocytes resume their differentiation into MHCII+ macrophages. We propose that MHCII+Ly6Clo MDMs are associated with the reduction of cardiac fibrosis and prevention of the myocarditis sequalae.

Keywords: Ly6C; MerTK; heart; macrophages; monocytes; myocarditis.


Conflict of interest statement

DECLARATION OF INTERESTS

The authors declare no competing interests.

Figures

Figure 1.
Figure 1.. Infiltrating Monocytes Contribute to Three Subsets of Macrophages during Myocarditis
(A) Schematics of parabiosis mice. (B) Representative images of H&E-stained heart sections of the median CD45.1 (day 21 EAM) and CD45.2 (non-EAM) mice parabionts. Scale bars: 100 μm. (C) Comparison of total grafted CD11b+Ly6Gmyeloid cell counts between parabionts. (D) Comparison of total cardiac macrophage counts between parabionts. (E) Flow cytometry plots showing (top left) percentage of CD45.2+CD11b+Ly6GLineage (CD3e, B220, NKp46, CD90.2, and Ter119) grafted cells infiltrating the CD45.1 EAM hearts; (top middle) percentage of grafted cells in the hearts that differentiated into macrophages or remained as monocytes; (top right) percentage of grafted MDM subsets; (bottom left) percentage of CD45.1+CD11b+Ly6GLineage grafted cells infiltrating the CD45.2 non-EAM hearts; (bottom middle) percentage of grafted cells in the hearts that differentiated into macrophages or remained as monocytes; and (bottom right) percentage of grafted MDM subsets. (F) Percentages of grafted MDMs out of total number of grafted CD11b+Ly6GLineage myeloid cells. (G) Percentages of grafted Ly6Chi and Ly6Clo cells out of total number of grafted F4/80CD64+ monocytes. (H) Comparison of grafted MDM subsets defined by CCR2 and MHCII expressions between parabionts. Data are representative of two independent experiments with biological triplicates. n = 3. (C, D, F, G) Groups were compared using Student’s t test. *p < 0.05. All data were presented as mean ± SD. See also Figure S1.
Figure 2.
Figure 2.. Cardiac Fibroblasts Facilitate Ly6Chi and Ly6Clo Monocyte-to-Macrophage Differentiation
(A) Schematics of the monocytes and cardiac fibroblasts co-culture system. Cardiac fibroblasts were harvested from WT naive mice, whereas monocytes weresorted from EAM IL-17Ra−/− mice. (B) Flow cytometric analysis showing differentiation of viable Ly6Chi and Ly6Clo MDMs expressing F4/80hiCD64+ at 40 h. (C) Frequency of macrophage differentiation at 40 h. (D) Differentiation of viable Ly6Chi and Ly6Clo monocytes into MDMs at 160 h. (E) Frequency of macrophage differentiation at 160 h. (F) Giemsa staining of monocytes morphologies before culture and after 160 h co-culture with cardiac fibroblasts. Scale bars: (black) 8 μm. (G and H) IncuCyte results showing CFSE+Ly6Chi (G) and CFSE+Ly6Clo (H) monocytes are in close contact with cardiac fibroblasts. Scale bars: (white) 50 μm. (I–L) Representative EM images taken at 160 h of co-culture showing individual (I) Ly6Chi and (J) Ly6Clo MDMs and (K) Ly6Chi and (L) Ly6Clo MDMs interacting with cardiac fibroblasts. Scale bars: (white) 2 μm; (black) 2 μm. (A–F) Data are representative of five independent experiments with technical triplicates. (C and E) n = 3. Groups were compared using one-way ANOVA followed by Tukey test. ****p < 0.0001. All data were presented as mean ± SD. See also Figure S2 and Videos S1 and S2.
Figure 3.
Figure 3.. Inflammatory Monocytes Are the Main Precursors for MDMs during Myocarditis in Both Mice and Humans
(A) Schematics of intracardiac injection of Ly6Chi or Ly6Clo CD45.2+ splenic monocytes into the hearts of CD45.1 day 21 EAM WT recipient mice. (B and C) Gating of concatenated Ly6Chi (B) and Ly6Clo (C) donor cells from the total viable CD115+CD11b+ population. (D) Percentages of injected Ly6Chi or Ly6Clo monocytes differentiated into macrophages. (E and F) Flow cytometric analysis of the frequencies of Ly6Chi (E) and Ly6Clo (F) MDMs out of a viable CD45.2+CD115+CD11b+ population. (G and H) F4/80 and CD64 expression intensities of Ly6Chi (G) and Ly6Clo (H) MDMs using a bh-SNE-dimensional reduction algorithm. (D) Data are representative of three independent experiments. n = 3–4. Groups were compared using Student’s t test. **p < 0.01. All data were presented as mean ± SD. See also Figure S3 and Table S1.
Figure 4.
Figure 4.. IL-17A Signaling through Cardiac Fibroblasts Inhibits Ly6Clo Monocyte-to-Macrophage Differentiation and Ly6Clo Proliferation
Naive WT cardiac fibroblasts were co-cultured with monocytes sorted from EAM IL-17Ra−/− mice. All co-cultured cells were assessed using flow cytometry at 160 h. (A) Gating of concatenated Ly6Chi and Ly6Clo MDMs out of viable CD45+CD11b+. (B) Histograms of mean CFSE fluorescent intensity (MFI) of viable Ly6Chi cells and Ly6Clo cells after co-culturing with either cardiac fibroblasts or IL-17A-treated cardiac fibroblasts. (C and D) Percentages of Ly6Chi (C) and Ly6Clo (D) MDMs when co-cultured with cardiac fibroblasts only, IL-17A-stimulated cardiac fibroblasts, recombinant GM-CSF supplemented cardiac fibroblasts, and IL-17A-stimulated cardiac fibroblasts treated with anti-GM-CSF, respectively. (E and F) Histograms of CFSE MFI showing viable Ly6Chi MDMs (E) and Ly6Clo monocytes (F) in conditions described in (C) and (D). (C and D) Data are representative of three independent experiments with technical triplicates. n = 3. Groups were compared using one-way ANOVA followed by Dunnett test. *p < 0.05; ****p < 0.0001. All data were presented as mean ± SD. See also Figure S4.
Figure 5.
Figure 5.. The Absence of IL-17A Signaling Enables Ly6Clo Monocyte-to-Macrophage Differentiation In vivo
(A) Schematics of intracardiac injection of CD45.2+Ly6Chi or CD45.2+Ly6Clo monocytes into CD45.1 day 21 EAM IL-17Ra−/− recipient mice. (B and C) Gating of concatenated Ly6Chi (B) and Ly6Clo (C) donor cells from the total viable CD115+CD11b+ population. (D) Percentages of injected Ly6Chi or Ly6Clo MDMs. (E and F) Frequencies of Ly6Chi MDMs (E) and Ly6Clo MDMs (F) out of the viable CD45.2+CD115+CD11b+ population. (G and H) F4/80 and CD64 expression intensities of Ly6Chi (G) and Ly6Clo (H) MDMs using bh-SNE-dimensional reduction algorithm. (I) Schematics of retro-orbital injection of CD45.1+Ly6Clo monocytes into CD45.2 day 21 EAM WT or IL-17Ra−/− recipient mice. (J) Gating of concatenated Ly6Clo donor cells from the total viable CD115+CD11b+ population in WT and in IL-17Ra−/− recipient ice. (K) CD45.1+ monocytes were gated based on no injection control CD45.2+ mice. (L) Percentages of CD45.1+ Ly6Clo MDMs in the heart. (M) Frequencies of Ly6Clo MDMs out of the viable CD45.1+CD115+CD11b+ population in WT and in IL-17Ra−/− recipient mice. Data are representative of two independent experiments with biological triplicates. (D and L) n = 3. Groups were compared using Student’s t test. *p < 0.05, **p < 0.01. All data were presented as mean ± SD. See also Figure S5.
Figure 6.
Figure 6.. Distinct Gene Expression Profiles in Ly6Chi and Ly6Clo MDM Subsets Differentiated In vitro in the Presence of Untreated or IL-17A-Treated Cardiac Fibroblasts
(A) PCA analysis of microarray experiments. The principal components and their fraction of overall variability of the data (%) are shown on the x, y, and z axes. (B) Supervised hierarchical clustering highlighting differential gene expression profiles among three groups of in vitro MDMs, using a threshold of 2-fold change and p value < 0.05. Sample number scheme is identical to the legend in all heatmaps below. (C–F) Heatmaps showing relative fold changes in (C) genes associated with cytokines and growth factors, (D) NFκB pathway and antigen presentation, (E) chemokines and immune modulating activities, and (F) collagen production and matrix remodeling. (G) Gating of MHCII+CD64+ macrophages derived from monocyte-fibroblast co-culture. Frequencies of MHCII+ subset out of total in vitro co-culture MDMs were assessed by flow cytometry. (H) Frequencies of MHCII+ out of F4/80hiCD64+ macrophages were assessed by flow cytometry of the hearts of day 28 EAM mice. (B–F) All genes displayed on the heatmaps have one-way ANOVA p value < 0.05 among groups compared. Data are representative of three independent experiments with technical triplicates. (G) n = 3. (H) n = 8 – 9. (G) Groups were compared using one-way ANOVA followed by Dunnett test. **p < 0.01. (H) Groups were compared using Student’s t test. **p < 0.01. All data were presented as mean ± SD. See also Figure S6.
Figure 7.
Figure 7.. IL-17A Trans-Signaling through Cardiac Fibroblasts Downregulates MerTK expression on Monocytes and MDMs
(A and B) Representative EM images showing (A) apoptotic cells or apoptotic cellular debris internalized by Ly6Chi MDMs (arrowheads) and (B) engulfed cellular debris were largely absent in Ly6Clo MDMs. Scale bars: 2 μm. (C) Macrophage phagocytic index was calculated using the following formula: (number of engulfed apoptotic cells/total number of macrophages) × (number of macrophages with engulfed apoptotic cells/total number of macrophages) × 100. (D–G) Hearts from day 21 EAM mice. (D) Frequencies of F4/80hiCD64+ macrophages out of viable CD45+Ly6GCD11b+ cells were assessed by flow cytometry. (E and F) MerTK MFI of F4/80hiCD64+ macrophages (E) and F4/80CD64+ monocytes (F) in the hearts. (G) ELISA showing soluble Mer (sMer) in WT and IL-17Ra−/− EAM mice sera. (H and I) Cardiac fibroblasts were harvested from WT naive mice, whereas monocytes were sorted from EAM IL-17Ra−/− mice. (H) MerTK MFI of Ly6Chi or Ly6Clo monocytes and MDMs in vitro after 160 h post-co-culture with cardiac fibroblasts stimulated with or without IL-17A. (I) sMer detected in supernatants of the monocyte-fibroblast co-culture by ELISA. (J) Flow cytometric analysis of the frequencies of FITC+F4/80hiCD64+ macrophages in the myocardium of WT, IL-17Ra−/−, and non-treated controls. (K) Percentages of FITC+F4/80hiCD64+ macrophages out of viable CD45+Ly6GCD11b+ cells. (L) MerTK MFI in patients with either myocarditis or ischemic cardiomyopathy. (D–G) Data are representative of five independent experiments. n = 8 – 9. (H and I) Data are representative of three independent experiments with technical triplicates. n = 3. (J and K) Data are representative of two independent experiments. n = 3. (C–G, I, K, and L) Groups were compared using Student’s t test. *p < 0.05; **p < 0.01. (H) Groups were compared using one-way ANOVA followed by Dunnett test. **p < 0.01; ****p < 0.0001. All data were presented as mean ± SD. See also Figure S7 and Tables S2 and S3.

Similar articles

Cited by

References

    1. Amir AD, Davis KL, Tadmor MD, Simonds EF, Levine JH, Bendall SC, Shenfeld DK, Krishnaswamy S, Nolan GP, and Pe’er D (2013). viSNE enables visualization of high dimensional single-cell data and reveals phenotypic heterogeneity of leukemia. Nat. Biotechnol. 31, 545–552. - PMC - PubMed
    1. Amit I, Winter DR, and Jung S (2016). The role of the local environment and epigenetics in shaping macrophage identity and their effect on tissue homeostasis. Nat. Immunol. 17, 18–25. - PubMed
    1. Amoah BP, Yang H, Zhang P, Su Z, and Xu H (2015). Immunopathogenesis of Myocarditis: The Interplay Between Cardiac Fibroblast Cells, Dendritic Cells, Macrophages and CD4+ T Cells. Scand. J. Immunol. 82, 1–9. - PubMed
    1. Anzai A, Choi JL, He S, Fenn AM, Nairz M, Rattik S, McAlpine CS, Mindur JE, Chan CT, Iwamoto Y, et al. (2017). The infarcted myocardium solicits GM-CSF for the detrimental oversupply of inflammatory leukocytes. J. Exp. Med. 214, 3293–3310. - PMC - PubMed
    1. Anzai A, Mindur JE, Halle L, Sano S, Choi JL, He S, McAlpine CS, Chan CT, Kahles F, Valet C, et al. (2019). Self-reactive CD4+ IL-3+ T cells amplify autoimmune inflammation in myocarditis by inciting monocyte chemotaxis. J. Exp. Med. 216, 369–383. - PMC - PubMed

Publication types

MeSH terms