. 2019 Jul 2;28(1):218-230.e7.
doi: 10.1016/j.celrep.2019.06.018.

Nitric Oxide Modulates Metabolic Remodeling in Inflammatory Macrophages through TCA Cycle Regulation and Itaconate Accumulation

Affiliations

Nitric Oxide Modulates Metabolic Remodeling in Inflammatory Macrophages through TCA Cycle Regulation and Itaconate Accumulation

Jade D Bailey et al. Cell Rep. .

Abstract

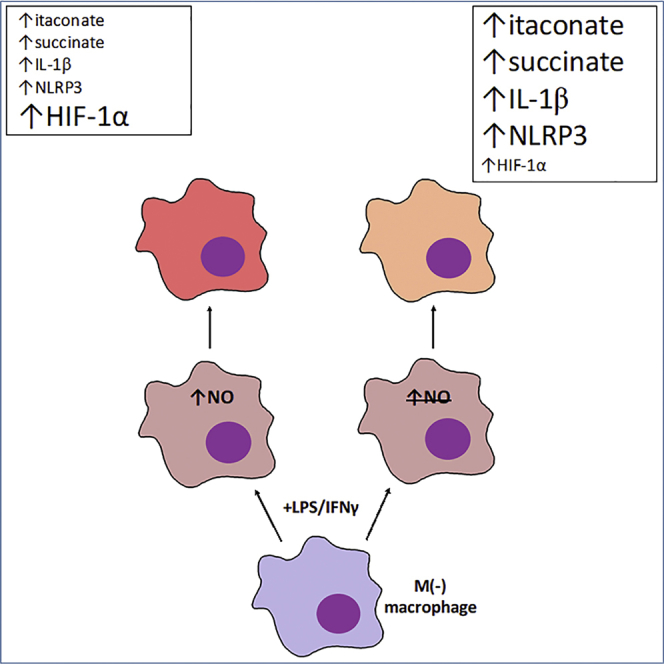
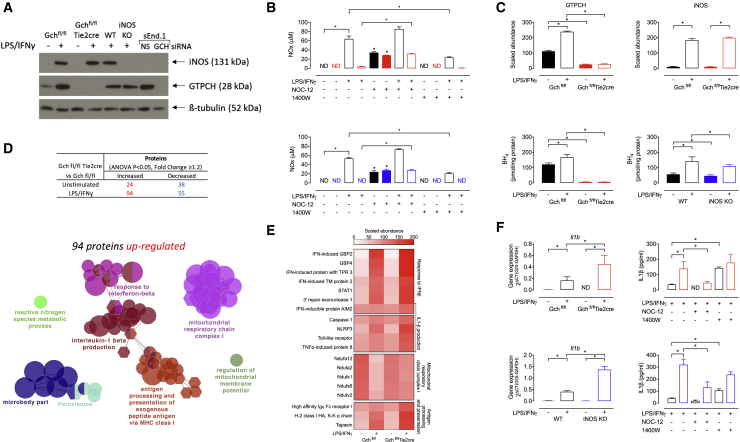
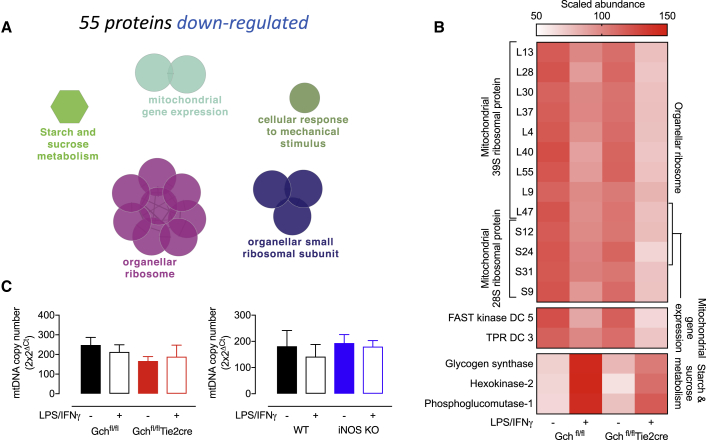
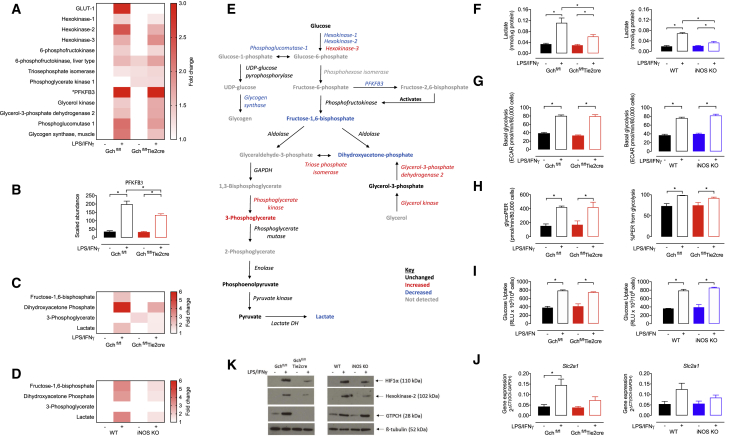
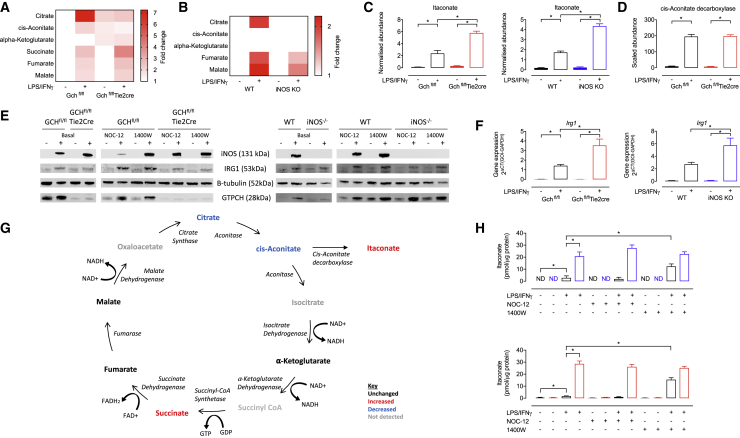
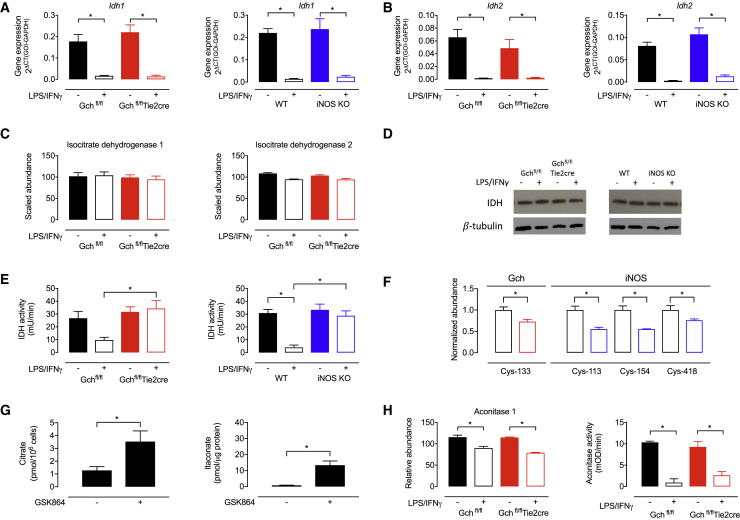
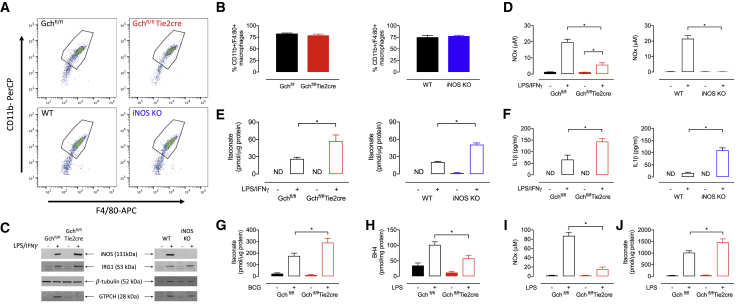
Classical activation of macrophages (M(LPS+IFNγ)) elicits the expression of inducible nitric oxide synthase (iNOS), generating large amounts of NO and inhibiting mitochondrial respiration. Upregulation of glycolysis and a disrupted tricarboxylic acid (TCA) cycle underpin this switch to a pro-inflammatory phenotype. We show that the NOS cofactor tetrahydrobiopterin (BH4) modulates IL-1β production and key aspects of metabolic remodeling in activated murine macrophages via NO production. Using two complementary genetic models, we reveal that NO modulates levels of the essential TCA cycle metabolites citrate and succinate, as well as the inflammatory mediator itaconate. Furthermore, NO regulates macrophage respiratory function via changes in the abundance of critical N-module subunits in Complex I. However, NO-deficient cells can still upregulate glycolysis despite changes in the abundance of glycolytic intermediates and proteins involved in glucose metabolism. Our findings reveal a fundamental role for iNOS-derived NO in regulating metabolic remodeling and cytokine production in the pro-inflammatory macrophage.

Keywords: immunometabolism; inflammation; macrophage metabolism; mitochondria; nitric oxide; tetrahydrobiopterin.


Figures

None
Graphical abstract
Figure 1
Figure 1
Proteomic Analysis of Upregulated Proteins Highlights BH4/NO Modulation of Inflammation, Mitochondrial Function, and Metabolism (A) Western blot analysis of iNOS and GTPCH protein levels in Gchfl/flTie2cre and iNOS KO BMDMs stimulated with LPS and IFNγ for 16 h. β-Tubulin was used as a loading control. sEnd.1 murine endothelial cells transfected with non-specific (NS) and GCH targeted siRNA were used as positive and negative controls for GTPCH (n = 3). (B) NOx (nitrite+nitrate) accumulation in the media measured using an NO analyzer (n = 5–6) (Black bars, Gchfl/fl or WT; Red bars, Gchfl/flTie2cre; Blue bars, iNOS KO). (C) The abundance of GTPCH and iNOS proteins were determined by mass spectrometry (n = 4) and intracellular BH4 quantified using HPLC (n = 5–6). (D) Number of proteins significantly (ANOVA, p < 9x10⁻⁶) changed in abundance as determined by mass spectrometric analysis (n = 4) and GO term enrichment analysis of significantly upregulated proteins in Gchfl/flTie2cre BMDMs stimulated with LPS/IFNγ. The most significant term in each cluster is annotated. (E) Heatmap showing the scaled abundance of proteins identified in the mostly significantly enriched GO terms from the analysis of upregulated proteins. (F) Il1b gene expression in Gchfl/flTie2cre and iNOS KO cells measured using qRT-PCR (n = 5) and levels of IL-1β in supernatants from Gchfl/flTie2cre and iNOS KO cells measured by ELISA (n = 5). Data are mean + SEM; p values calculated using 2-way ANOVA with Tukey’s post-test (p < 0.05).
Figure 2
Figure 2
Proteomics Analysis of Downregulated Proteins Highlights BH4/NO Modulation of Mitochondria and Metabolism (A) GO term enrichment analysis of significantly downregulated proteins in Gchfl/flTie2cre BMDMs stimulated with LPS/IFNγ. The most significant term in each cluster is annotated. (B) Heatmap showing the scaled abundance of proteins identified in the mostly significantly enriched GO terms from the analysis of downregulated proteins (n = 4). (C) mtDNA content was determined in Gchfl/flTie2cre and iNOS KO cells (n = 4).
Figure 3
Figure 3
NO-Dependent Inhibition of NADH Dehydrogenase and Mitochondrial Respiration (A) Structure of the modules (N, Q, PP, and PD) making up NADH dehydrogenase (Complex I). (B) Fold change of N module subunits relative to unstimulated Gchfl/fl cells (n = 4, denotes subunits not significantly changed by ANOVA). (C) Ndufv2 protein levels determined by western blotting in Gchfl/flTie2cre and iNOS KO cells (n = 4). (D) Ndufv2 mRNA levels determined by qRT-PCR in Gchfl/flTie2cre and iNOS KO cells (n = 5). (E) Complex I (labeled I) in gel activity assay with digitonin to demonstrate supercomplex (SC) abundance and DDM (n-dodecyl-β-D-maltoside) to demonstrate isolated complex I activity in Gchfl/flTie2cre cells. (F and G) Oxygen consumption rate (OCR) was measured using XFe96 Seahorse bioanalyzer with compounds used to determine basal, ATP-linked and maximum respiration in (F) Gchfl/flTie2cre (black solid line, unstimulated Gchfl/fl; red solid line, unstimulated Gchfl/flTie2cre; black dashed line, M(LPS+IFNγ) Gchfl/fl; red dashed line, M(LPS+IFNγ) Gchfl/flTie2cre cells) and (G) iNOS KO macrophages (black solid line, unstimulated WT; blue solid line, unstimulated iNOS KO; black dashed line, M(LPS+IFNγ) WT; blue dashed line, M(LPS+IFNγ) iNOS KO cells) (n = 5–6). Data are mean + SEM; p values calculated using 2-way ANOVA with Tukey’s post-test (p < 0.05).
Figure 4
Figure 4
Glycolytic Rate Is Unaffected by Loss of NO Signaling Despite Changes in the Levels of Glycolytic Proteins and Metabolites (A) Heatmap showing fold changes in abundance of enzymes significantly changed relative to Gchfl/fl unstimulated cells (n = 4, p < 0.05, PFKB3 = fold change > 3). (B) Abundance of PFKFB3 protein (n = 4). (C and D) (C) Fold change heatmaps of significantly changed (p > 0.05) metabolites relative to unstimulated Gchfl/fl or (D) unstimulated WT cells (n = 6). (E) Glucose metabolism pathway representing changes (>20%) in abundance of enzymes and metabolites in LPS/IFNγ stimulated Gchfl/flTie2cre versus Gchfl/fl macrophages. (F) Lactate accumulation measured in medium supernatants from macrophages following overnight stimulation (n = 4). (G) Basal glycolysis determined using 2-deoxyglucose inhibitable ECAR measured using XFe96 Seahorse bioanalyzer in Gchfl/flTie2cre and iNOS KO cells (n = 6). (H) Basal glycolytic rate determined in Gchfl/flTie2cre cells by calculating glycolytic proton efflux rate (glycoPER) (n = 3). (H) The contribution of glycolysis to acidification of media in Gchfl/flTie2cre cells (n = 3). (I) Measurement of glucose uptake in Gchfl/flTie2cre and iNOS KO cells (n = 4). (J) qRT-PCR mRNA measurement of Slc2a1 gene encoding GLUT-1 protein in Gchfl/flTie2cre and iNOS KO cells (n = 5). (K) Western blot analysis of HIF1α and hexokinase 2 proteins in Gchfl/flTie2cre and iNOS KO cells (n = 4). Data are mean + SEM; p values calculated using 2-way ANOVA with Tukey’s post-test (p < 0.05).
Figure 5
Figure 5
NO Modulates Levels of TCA Cycle Metabolites and Itaconate (A and B) Fold change heatmaps of significantly changed (p < 0.05) metabolites relative to (A) Gchfl/fl or (B) WT unstimulated cells (n = 6, itaconate fold change > 8) as measured using mass spectrometry. (C) Itaconate metabolite abundance in Gchfl/flTie2cre and iNOS KO cells measured using mass spectrometry (n = 6). (D) Abundance of cis-aconitate decarboxylase protein in Gchfl/flTie2cre cells measured using mass spectrometry (n = 4). (E) Western blot analysis of cis-aconitate decarboxylase (IRG1), iNOS, and GTPCH protein (n = 4). β-tubulin was used as a loading control. (F) Irg1 gene expression in Gchfl/flTie2cre and iNOS KO cells (n = 5). (G) TCA cycle pathway showing changes (>20%) in abundance of enzymes and metabolites in LPS/IFNγ stimulated Gchfl/flTie2cre versus Gchfl/fl macrophages. (H) Itaconate measured using HPLC in Gchfl.flTie2cre and iNOS KO cells treated with 1400W and NOC-12 (n = 4). Data are mean + SEM; p values calculated using 2-way ANOVA with Tukey’s post-test (p < 0.05).
Figure 6
Figure 6
NO Modulates IDH Activity (A) Idh1 gene expression in Gchfl/flTie2cre and iNOS KO cells (n = 5). (B) Idh2 gene expression in Gchfl/flTie2cre and iNOS KO cells (n = 5). (C) IDH1 and IDH2 protein abundance measured using mass spectrometry in Gchfl/flTie2cre cells (n = 4). (D) Western blot analysis of IDH1 protein in Gchfl/flTie2cre and iNOS KO cells (n = 3). (E) IDH1 and IDH2 combined activity in Gchfl/flTie2cre and iNOS KO cells (n = 3). (F) Normalized abundance of IDH peptides containing nitrosated cysteine residues, in samples from Gchfl/flTie2cre and iNOS KO macrophages (n = 4). (G) Citrate and itaconate levels in WT unstimulated macrophages treated with the IDH inhibitor GSK864 (n = 4). (H) Abundance of aconitase 1 protein measured using mass spectrometry (n = 4) and aconitase 1 and 2 activity in Gchfl/flTie2cre cells (n = 3–5). Data are mean + SEM; p values calculated using 2-way ANOVA with Tukey’s post-test (p < 0.05).
Figure 7
Figure 7
NO Modulates Levels of Itaconate in M(LPS+IFNγ) Peritoneal Macrophages, Mice Infected with BCG, and Mice Experiencing LPS-Induced Acute Endotoxaemia (A) FACS analysis of peritoneal macrophages isolated from Gchfl/flTie2cre and iNOS KO mice. (B) The percentage of CD11b+/F4:80+ peritoneal macrophages isolated from Gchfl/flTie2cre and iNOS KO mice measured using FACS (n = 4). (C) Western blot analysis of iNOS, IRG1 and GTPCH protein in peritoneal macrophages stimulated with LPS/IFNγ (n = 4). β-tubulin was used as the loading control. (D) NOx measurements in medium supernatants from stimulated Gchfl/flTie2cre and iNOS KO peritoneal macrophages (n = 4). (E) Itaconate measured by HPLC in stimulated Gchfl/flTie2cre and iNOS KO peritoneal macrophages (n = 4). (F) IL-1β secreted from stimulated Gchfl/flTie2cre and iNOS KO peritoneal macrophages (n = 4). (G) Itaconate measured by HPLC in lung tissue from Gchfl/flTie2cre mice infected with BCG (n = 4–12). (H–J) (H) BH4 (H), NOx (I), and itaconate (J) measured in lung tissue from Gchfl/flTie2cre mice treated with 12.5 mg/kg LPS to induce acute endotoxaemia (n = 6). Data are mean + SEM; p values calculated using 2-way ANOVA with Tukey’s post-test (p < 0.05).

References

    1. Arts R.J.W., Novakovic B., Ter Horst R., Carvalho A., Bekkering S., Lachmandas E., Rodrigues F., Silvestre R., Cheng S.-C., Wang S.-Y. Glutaminolysis and Fumarate Accumulation Integrate Immunometabolic and Epigenetic Programs in Trained Immunity. Cell Metab. 2016;24:807–819. - PMC - PubMed
    2. Arts, R.J.W., Novakovic, B., Ter Horst, R., Carvalho, A., Bekkering, S., Lachmandas, E., Rodrigues, F., Silvestre, R., Cheng, S.-C., Wang, S.-Y., et al. (2016). Glutaminolysis and Fumarate Accumulation Integrate Immunometabolic and Epigenetic Programs in Trained Immunity. Cell Metab. 24, 807-819. - PMC - PubMed
    1. Bailey J., Shaw A., Fischer R., Ryan B.J., Kessler B.M., McCullagh J., Wade-Martins R., Channon K.M., Crabtree M.J. A novel role for endothelial tetrahydrobiopterin in mitochondrial redox balance. Free Radic. Biol. Med. 2017;104:214–225. - PMC - PubMed
    2. Bailey, J., Shaw, A., Fischer, R., Ryan, B.J., Kessler, B.M., McCullagh, J., Wade-Martins, R., Channon, K.M., and Crabtree, M.J. (2017). A novel role for endothelial tetrahydrobiopterin in mitochondrial redox balance. Free Radic. Biol. Med. 104, 214-225. - PMC - PubMed
    1. Bambouskova M., Gorvel L., Lampropoulou V., Sergushichev A., Loginicheva E., Johnson K., Korenfeld D., Mathyer M.E., Kim H., Huang L.H. Electrophilic properties of itaconate and derivatives regulate the IκBζ-ATF3 inflammatory axis. Nature. 2018;556:501–504. - PMC - PubMed
    2. Bambouskova, M., Gorvel, L., Lampropoulou, V., Sergushichev, A., Loginicheva, E., Johnson, K., Korenfeld, D., Mathyer, M.E., Kim, H., Huang, L.H., et al. (2018). Electrophilic properties of itaconate and derivatives regulate the IκBζ-ATF3 inflammatory axis. Nature 556, 501-504. - PMC - PubMed
    1. Chen C., Pore N., Behrooz A., Ismail-Beigi F., Maity A. Regulation of glut1 mRNA by hypoxia-inducible factor-1. Interaction between H-ras and hypoxia. J. Biol. Chem. 2001;276:9519–9525. - PubMed
    2. Chen, C., Pore, N., Behrooz, A., Ismail-Beigi, F., and Maity, A. (2001). Regulation of glut1 mRNA by hypoxia-inducible factor-1. Interaction between H-ras and hypoxia. J. Biol. Chem. 276, 9519-9525. - PubMed
    1. Chouchani E.T., Methner C., Nadtochiy S.M., Logan A., Pell V.R., Ding S., James A.M., Cochemé H.M., Reinhold J., Lilley K.S. Cardioprotection by S-nitrosation of a cysteine switch on mitochondrial complex I. Nat. Med. 2013;19:753–759. - PMC - PubMed
    2. Chouchani, E.T., Methner, C., Nadtochiy, S.M., Logan, A., Pell, V.R., Ding, S., James, A.M., Cocheme, H.M., Reinhold, J., Lilley, K.S., et al. (2013). Cardioprotection by S-nitrosation of a cysteine switch on mitochondrial complex I. Nat. Med. 19, 753-759. - PMC - PubMed

Publication types

MeSH terms