. 2019 Jul 2;28(1):51-64.e4.
doi: 10.1016/j.celrep.2019.06.013.

Neuronal Soma-Derived Degradative Lysosomes Are Continuously Delivered to Distal Axons to Maintain Local Degradation Capacity

Affiliations

Neuronal Soma-Derived Degradative Lysosomes Are Continuously Delivered to Distal Axons to Maintain Local Degradation Capacity

Tamar Farfel-Becker et al. Cell Rep. .

Abstract

Neurons face the challenge of maintaining cellular homeostasis through lysosomal degradation. While enzymatically active degradative lysosomes are enriched in the soma, their axonal trafficking and positioning and impact on axonal physiology remain elusive. Here, we characterized axon-targeted delivery of degradative lysosomes by applying fluorescent probes that selectively label active forms of lysosomal cathepsins D, B, L, and GCase. By time-lapse imaging of cortical neurons in microfluidic devices and standard dishes, we reveal that soma-derived degradative lysosomes rapidly influx into distal axons and target to autophagosomes and Parkinson disease-related α-synuclein cargos for local degradation. Impairing lysosome axonal delivery induces an aberrant accumulation of autophagosomes and α-synuclein cargos in distal axons. Our study demonstrates that the axon is an active compartment for local degradation and reveals fundamental aspects of axonal lysosomal delivery and maintenance. Our work establishes a foundation for investigations into axonal lysosome trafficking and functionality in neurodegenerative diseases.

Keywords: active lysosomal hydrolase; autophagic stress; autophagosome; axonal transport; cathepsin; degradative lysosome; lysosomal trafficking; α-synuclein.


Conflict of interest statement

DECLARATION OF INTERESTS

The authors declare no competing financial interests.

Figures

Figure 1.
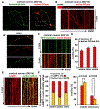
Figure 1.. Lysosomal Hydrolases Are Positioned in Axons and Abundant in Distal Tips
(A) Diagram and representative images of the microfluidic device that physically separates axons from cell bodies and dendrites. Cell bodies and dendrites labeled by MAP2 (green) at DIV7 are restricted to the soma chamber, whereas axons labeled by β3-tubulin (red) grow into the axon chamber through 450-μm-long microgrooves. (B) Images showing lysosomal hydrolases distributed in axonal terminals. Cortical neurons in microfluidic devices were co-immunostained at DIV7 with antibodies against β3-tubulin and cathepsin D (top), cathepsin B (middle), or loaded with MDW933 (500 nM for 1 h; bottom) to label active GCase. Three separated soma, microgroove, and axonal terminal compartments were imaged as indicated. Acquisition parameters were adjusted for optimal detection of lysosomes along the axons, and therefore, the signal in the soma is saturated. (C) Quantitative analysis showing the distribution of degradative lysosomes containing cathepsin B or active GCase in the majority of axonal tips. (D) Axonal distribution of degradative lysosomes containing active forms of both cathepsin D and GCase. Cortical neurons in microfluidic devices were loaded at DIV7 with MDW941 (5 nM) and BODIPY-FL-pepstatin A (1 μM) for 30 min in both the soma and axon chambers, followed by live imaging of distal axons in the axon chamber. Note that the majority of degradative lysosomes in distal axons are co-labeled by two active lysosomal probes (arrows) that specifically bind active GCase and cathepsin D. Data were analyzed from the total numberof axon tips indicated in the bars, from 3 independent experiments (C). Error bars, SEM, scale bars, 5 μm. See also Figures S1A and S2.
Figure 2.
Figure 2.. Specific Labeling of Active Hydrolases in Neurons
(A and B). Representative images (A) and quantitative analysis(B) showing the specificity of MDW941 for detecting active GCase. Cortical neurons at DIV14 were treated with DMSO or CBE (100 μM), a selective GCase inhibitor, for 24 h, followed by co-loading MDW941 (100 nM) and BODIPY-FL-pepstatin A (1 μM) for 30 min to label active GCase and cathepsin D, respectively. Note that inhibiting GCase activity with CBE abolished MDW941 labeling (p < 0.001), but had no effect on BODIPY-FL-pepstatin A labeling. See also Figure S1. (C and D). Representative images (C) and quantitative analysis (D) showing the specificity of BODIPY-FL-pepstatin A for detecting active cathepsin D. Cortical neurons at DIV14 were treated for 24 h with DMSO or pepstatin A (10 μM), an inhibitor of aspartic proteases, including cathepsin D, followed by co-loading BODIPY-FL-pepstatin A (1 μM) and MDW941 (100 nM) for 30 min to label active forms of cathepsin D and GCase. Note that blocking cathepsin D activity abolished the labeling of BODIPY-FL-pepstatin A (p < 0.001) but had no effect on the labeling of MDW941. (E and F). Representative images (E) and quantitative analysis (F) showing the specificity of Magic Red cathepsin B for detecting cleaved cathepsin B substrate. Cortical neurons at DIV14 were treated for 24 h with DMSO or E64d (10 μM), an inhibitor of cysteine proteases, including cathepsin B, followed by co-loading Magic Red cathepsin B(1:4,000) and BODIPY-FL-pepstatin A (1 μM) for 30 min. Notethat blocking cathepsin B activity selectively abolished the labeling of Magic Red (p < 0.001) but had no effect on the labeling of BODIPY-FL-pepstatin A. Integrated density was measured at the soma region, and data are presented as mean integrated density normalized to control from a total of 15 neurons (B and D) or 17 neurons (F); the Mann-Whitney test was used to assess significance. Error bars, SEM, Scale bars, 10 μm. n.s., p > 0.05.
Figure 3.
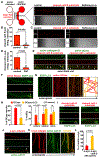
Figure 3.. Degradative Lysosomes Are Rapidly Delivered from the Soma into Axons and Accumulate in Distal Tips
(A) Diagram (left), a representative single-frame live image (top right), and a corresponding kymograph (bottom right) showing the anterograde flux of degradative lysosomes from the soma chamber through long axon bundles toward distal tips. Cortical neurons were cultured in the microfluidic device and somato-dendritic lysosomes were labeled with the active GCase probe MDW941 (5 nM, 1 h) at DIV7-8, followed by 5-min time-lapse imaging with 1.3-s intervals to capture lysosome flux through axon bundles along the microgrooves (red box). The first frame and kymograph depicting the 5-min live imaging period are shown, where anterograde moving lysosomes are represented by slanted lines with a negative slope, retrograde moving ones by slanted lines with a positive slope, and stationary organelles by vertical lines. (B) A histogram of anterograde velocities of soma-labeled degradative lysosomes in distal axons. Data were collected from a total of 337 degradative lysosomes from 30 axon bundles in 3 independent experiments. The mean anterograde velocity (1.9 ± 0.04 μm/s) was measured from active GCase-labeled motile lysosomes with net displacement ≥ 10 μM. (C and D) Representative images (C) and quantitative analysis (D) showing the time course of degradative lysosome accumulation in distal axon tips following their labeling in the soma chamber. The soma chamber of neurons at DIV7-8 was briefly labeled by the active GCase probe MDW933 (500 nM for 15 min). Neurons were then washed and fixed after 0, 30, 60, 90, 120, or 180 minutes and immunostained for β3-tubulin. Note that active GCase signal in axon tips progressively increased following extended durations after wash, indicating the delivery of degradative lysosomes from the soma to axon tips. Data were quantified from 60 axon tips per time point and expressed as mean ± SEM. (E and F) Representative kymograph (E) and quantitative analysis (F) showing the relative motility of degradative lysosomes in distal axons. BODIPY-FL-pepstatin A (1 μM) was applied for 30 min in both soma and axon chambers at DIV7 to label active cathepsin D. Kymographs were generated from distal axon segments over a 3-min time-lapse imaging (181.82 ms for each frame with 1-s intervals). Note that a similar portion of degradative lysosomes move in the anterograde (antero) or retrograde (retro) direction, or remain in stationary (statio) status. Data were quantified from a total of 673 lysosomes in 53 axons from four experiments and expressed as mean ± SEM. Scale bars, 10 μm (A and E), 5 μm (C). See also Figure S3 and Videos S1, S2, and S3.
Figure 4.
Figure 4.. The Motility of Degradative and Nondegradative Lysosomes in Synaptically Connected Axons of Mature Neurons
(A) Distribution of synapses and degradative lysosomes in mature cortical neurons at DIV14. Cortical neurons at DIV14 were loaded with MDW941 to label active GCase, followed by im munostaining of synaptophysin. (A’) A magnified image shows the distribution of presynapses and degradative lysosomes along an axon. (B) Representative image of the soma and proximal axon region (upper) and corresponding kymograph (lower) showing delivery of degradative lysosomes exiting the soma into the proximal axon. Cortical neurons at DIV14 were labeled with the active GCase probe MDW941 (100 nM for 30 min), followed by 3-min time-lapse imaging. Slanted lines with a negative slope represent anterograde movement toward distal tips. See also Video S4. (C and D) Dual-channel kymographs (C) and quantitative analysis (D) showing the motility of degradative lysosomes and presynapses in distal axons. Cortical neurons were transfected with GFP-synapsin at DIV10 and labeled with MDW941 (100 nM for 30 min) at DIV14 prior to 3-min time-lapse imaging. Green vertical lines indicate stationary presynaptic terminals and slanted red lines represent motile degradative lysosomes. (E and F) Dual-channel kymographs (E) and quantitative analysis (F) showing the different motility patterns of degradative and non-degradative lysosomes along axons of mature neurons. Cortical neurons were transfected with mApple-LAMP1 at DIV10 and loaded with BODIPY-FL-pepstatin A at DIV14 (1 μM for 30 min) prior to 3-min time-lapse imaging. Red lines represent LAMP1-organelles and yellow lines represent degradative lysosomes containing both LAMP1 and active cathepsin D. Degradative lysosomes are more motile than the total pool of LAMP1 organelles (p = 0.04). Note that some green signals might originate from LAMP1-untransfected neurons. Data were quantified from a total of 838 LAMP1 organelles and 366 degradative lysosomes in 21 neurons from three experiments (D and F). Error bars, SEM. Mann-Whitney test. Scale bar: 5 μm (A′, B, C, and E) and 10 μm (A).
Figure 5.
Figure 5.. Distal Axons Are Degradative Compartments for Autophagosomes and α-Synuclein Cargos
(A–D) Representative images (A and C) and quantitative analyses (B and D) showing the cleavage of cathepsins B and L substrates in acidic lysosomes in distal axons. DIV7 cortical neurons cultured in microfluidic devices were loaded in both soma and axonal chambers with bafilomycin A (50 nM) for 60 min to block lysosomal acidification, followed by loading the axon chamber with Magic Red cathepsin B (A) or L (C) fluorogenic substrates (1:4,000) for 30 min. Live imaging was performed to assess acidic degradative lysosomes with cleaved Magic Red substrate. Note that bafilomycin treatment abolishes substrate cleavage. Data were quantified from the total number of axons indicated in bars. See also Figures S1C and S1D and Videos S5, S6, S7, and S8. (E) Co-localization of active hydrolases with cleaved substrates within distal degradative lysosomes. BODIPY-FL-pepstatin A (1 μM) or MDW933 (500 nM) was applied for 30 min in both the soma and axon chambers to label degradative lysosomes. Magic Red cathepsin B or L fluorogenic substrate (1: 4,000) was applied for 30 min in the axon chamber to label cathepsin B- and cathepsin L-mediated degradation. Arrows point to degradative lysosomes containing both active cathepsins D and B (left) or active cathepsin L and GCase (right). Note that several cathepsin D organelles that do not colocalize with Magic Red may represent newly delivered lysosomes from the soma. (F–H) Images (F), kymographs (G), and quantitative analyses (H) showing co-localization and co-migration of degradative lysosomes and autophagic vacuoles in distal axons. Cortical neurons were infected with a lentivirus encoding EGFP-LC3 and plated in microfluidic devices. At DIV7-8, MDW941 (5 nM for 1 h) was applied in the soma chamber to label active GCase. The arrow points to an autolysosome in the distal axon tip (F). Kymographs (G) represent 3 min of time-lapse imaging (2-s intervals) acquired ~100 μm away from the axon tip. Note that anterograde transport of degradative lysosomes (31.3% ± 3.8%) is largely abolished (p < 0.0001) when they fuse with autophagosomes to become autolysosomes (H), so that the majority of autolysosomes remain stationary (50.8% ± 5.8%) or undergo retrograde motility (42.3% ± 5.5%). Datawere quantified from 37 axons in three independent experiments. (I) Distal autolysosomes with cleavage activity. Cortical neurons were infected with a lentivirus encoding EGFP-LC3 and plated in microfluidic devices. At DIV7-8, Magic Red cathepsin B (left panel) or L (right panel) fluorogenic substrate (1: 4,000) was applied for 30 min in the axon chamber to visualize cathepsin B- and cathepsin L-mediated degradation within autolysosomes. Arrows point to autolysosomes containing cleaved substrates in the distal tip. (J–L) Images (J), kymographs (K), and quantitative analysis (L) showing the co-localization and co-migration of degradative lysosomes and α-synuclein cargos in distal axons. Cortical neurons were infected with a lentivirus encoding α-synuclein-mApple and plated in microfluidic devices. Neurons were then loaded at DIV7-8 with BODIPY-FL-pepstatin A (1 μM) for 30 min, followed by live imaging in distal axonal segments. Arrows indicate degradative lysosomes containing μ-synuclein. Kymographs were generated from 5-min time-lapse imaging with 2-s intervals at the most distal axonal segments. To exclude non-vesicular α-synuclein, co-localization was quantified from motile cargos (displacement > 2 μM) in a total of 46 axons from four independent experiments. Error bars, SEM; unpaired t test. Scale bars, 20 μm (A and C), 10 μm (G and K), and 5 μm (E, F, I, and J). n.s., p > 0.05.
Figure 6.
Figure 6.. Characterization of Axonal Degradative Lysosomes in DRG Neurons
(A–C) Enzymatically active lysosomes are positioned in axon terminals of DRG neurons isolated from P30-40 adult mice. Neurons were loaded at DIV2-3 with MDW933 (500 nM) for 1 hour, followed by immunostaining for β3-tubulin (A), co-incubated with BODIPY-FL-pepstatin A (1 μM) and MDW941 (100 nM) (B), or co-loaded with BODIPY-FL-pepstatin A (1 μM) and the fluorogenic cathepsin B substrate Magic Red (C) (1:4000) for 30 min prior to live-imaging. Differential interference contrast (DIC) images (bottom panels) show axon growth cones. Arrows point to co-localization of active forms of cathepsin D and GCase (B) or active cathepsin D and cleaved cathepsin B substrate (C). (D and E) Representative kymograph (D) and quantitative analysis (E) showing the bidirectional motility of degradative lysosomes in distal axons of DRG neurons. Neurons were incubated with MDW941 (100 nM) for 30 min before live-imaging at DIV2-3. Time-lapse images were collected every 1.5 s for 180 frames. See also Video S9. (F–I) Images (F), kymographs (H), and quantitative analyses (G and I) showing colocalization of degradative lysosomes and autophagosomes as well as the relative motility of autolysosomes and autophagosomes in distal axons of DRG neurons. Neurons were nucleofected with EGFP-LC3 at DIV0 and incubated with MDW941 (100 nM) for 30 min priorto live-imaging at DIV3. Note that ~82% of autophagosomes in distal axons were co-labeled by active GCase (arrows), indicative of autolysosomes that display increased retrograde motility (p = 0.02) compared to autophagosomes. Data were quantified from the total number of autophagosomes (green), degradative lysosomes (red), and autolysosomes(yellow) indicated in parentheses from 27 neurons (G and I) in three independent experiments. Error bars, SEM. Mann-Whitney test. Scale bars, 10 μm.
Figure 7.
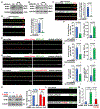
Figure 7.. Impaired Axonal Delivery of Degradative Lysosomes Induces Autophagic Stress
(A and B) Immunoblots of DRG neuron lysates showing effective depletion of Arl8a/b by siRNA#1 (A) and siRNA#2 (B). DRG neurons were nucleofected with Arl8a/b-siRNA#1, -siRNA#2, or scrambled control (ctrl) at DIV0, and knock down was evaluated at DIV3 by immunoblotting equal amounts of cell lysates (6 μg) with antibodies against Arl8 and GAPDH or β3-tubulin. (C and D) Effective Arl8 depletion in DRG neurons by siRNA#1 (C) or siRNA#2 (D). DRG neurons were co-nucleofected with EGFP-LC3 and siRNA. Knock down was assessed by immunostaining for endogenous Arl8 at DIV3-4. Integrated density of Arl8 fluorescence was measured at axonal tips by using ImageJ, and data are presented as mean integrated density normalized to ctrl-siRNA. (E and H) Axonal autophagic stress induced by disrupting the axonal delivery of degradative lysosomes. DRG neurons were co-nucleofected at DIV0 with EGFP-LC3 together with siRNA#1 (E and F) or siRNA#2 (G and H) directed against Arl8a/b or scrambled control (ctrl). Neurons were then incubated with MDW941 (100 nM) for 30 min priorto live-imaging at DIV3-4. Note that depleting Arl8 with either siRNA#1 or siRNA#2 consistently reduced the axonal density of degradative lysosomes (p < 0.001), resulting in an increase in AV density in distal axons (p < 0.001) under non-starvation conditions. (I and J) Axonal accumulation of mutant α-synuclein A53T caused by inhibiting the axonal delivery of degradative lysosomes. DRG neurons were co-nucleofected with α-synuclein-A53T-RFP and Arl8a/b-siRNA#1 or scrambled control (ctrl-siRNA) at DIV0. Neurons were then incubated with BODIPY-FL-pepstatin A(1 μM) for 30 min prior to live-imaging at DIV3. Note that disrupting the axonal delivery of degradative lysosomes induces axonal accumulation of mutant α-synuclein. (K) Characterization of siRNA-resistant Arl8b mutant (R-Arl8b). R-Arl8b was generated by substituting nine nucleotides in the Arl8b-siRNA#1-targeting sequence (G459A, T462C, A463C, A465T, A468G, T471C, C474T, C477T, and T480C) without changing the amino acid sequence. HEK293T cells were co-transfected with Arl8b-mCherry and ctrl-siRNA or Arl8a/b-siRNA#1, or R-Arl8b-mCherry and ctrl-siRNA or Arl8a/b-siRNA#1 as indicated, followed by immunoblotting 3 days after transfection. Equal amounts (20 μg) of cell lysates were loaded. The intensities of Arl8b-mCherry and R-Arl8b-mCherry were normalized to α-tubulin levels under the control condition (first bar). Data were from three independent experiments; unpaired Student’s t test. (L and M). Rescue of axonal autophagic stress by expressing R-Arl8b. Expressing R-Arl8b-mCherry in Arl8-depleted neurons rescues autophagic stress, as indicated by the reduced axonal density of LC3 vesicles (p < 0.0001) compared to un-rescued neurons. Data were collected from the total number of axons indicated within bars in three independent experiments. Error bars, SEM. One-way ANOVA. Scale bars, 10 μm. n.s., p > 0.05.

References

    1. Abounit S, Bousset L, Loria F, Zhu S, de Chaumont F, Pieri L, Olivo-Marin JC, Melki R, and Zurzolo C (2016). Tunneling nanotubes spread fibrillar α-synuclein by intercellular trafficking of lysosomes. EMBO J. 35, 2120–2138. - PMC - PubMed
    1. Arantes RM, and Andrews NW (2006). A role for synaptotagmin VII-regulated exocytosis of lysosomes in neurite outgrowth from primary sympathetic neurons. J. Neurosci 26, 4630–4637. - PMC - PubMed
    1. Ashrafi G, Schlehe JS, LaVoie MJ, and Schwarz TL (2014). Mitophagy ofdamaged mitochondria occurs locally in distal neuronal axons and requires PINK1 and Parkin. J. Cell Biol 206, 655–670. - PMC - PubMed
    1. Bagshaw RD, Callahan JW, and Mahuran DJ (2006). The Arf-family protein, Arl8b, is involved in the spatial distribution of lysosomes. Biochem. Biophys. Res. Commun 344, 1186–1191. - PubMed
    1. Beard H, Hassiotis S, Gai WP, Parkinson-Lawrence E, Hopwood JJ, and Hemsley KM (2017). Axonal dystrophy in the brain of mice with Sanfilippo syndrome. Exp. Neurol 295, 243–255. - PubMed

Publication types

MeSH terms