

Analysis of Allergen-Specific T Cell and IgE Reactivity to Different Preparations of Cow's Milk-Containing Food Extracts
- PMID: 31269726
- PMCID: PMC6679079
- DOI: 10.3390/cells8070667
Analysis of Allergen-Specific T Cell and IgE Reactivity to Different Preparations of Cow's Milk-Containing Food Extracts
Abstract
Background: cow's milk allergy (CM) is among the most common food allergies in young children and is often outgrown by adulthood. Prior to developing a tolerance to CM, a majority of CM-allergic children may tolerate extensively-heated CM. This study aims to characterize the IgE- and T cell-reactivity to unheated CM and the progressively more heated CM-containing foods.
Methods: CM-containing food extracts from muffin, baked cheese, custard and raw, pasteurized CM commercial extract were tested for skin prick test reactivity, IgE binding and T cell reactivity as assessed by IL-5 and IFNγ production.
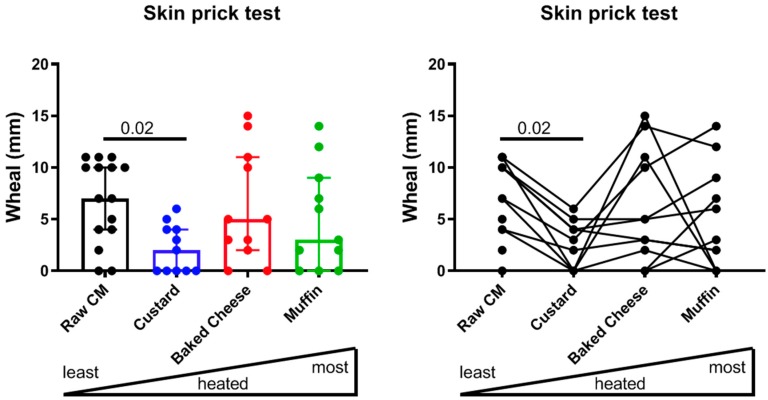
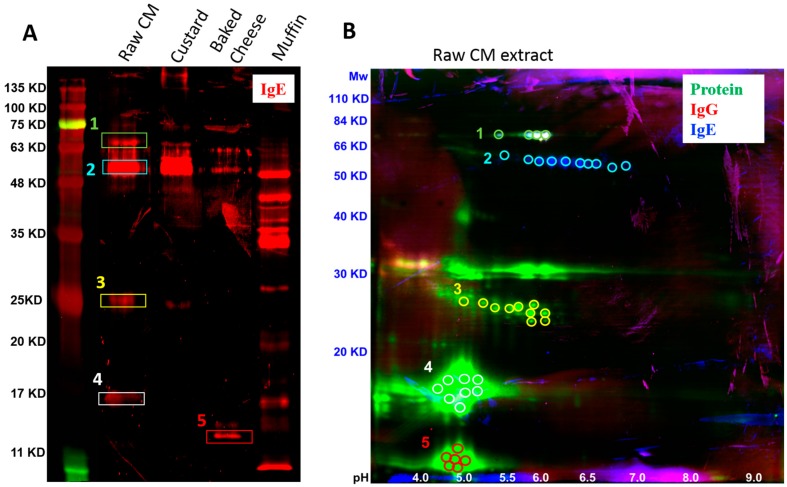
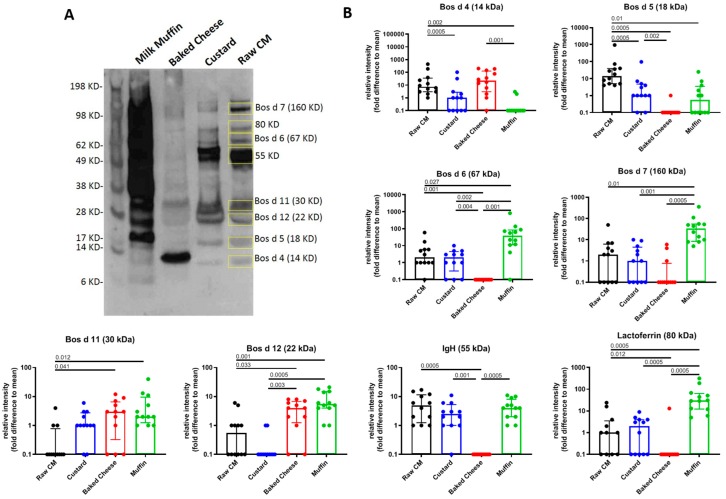
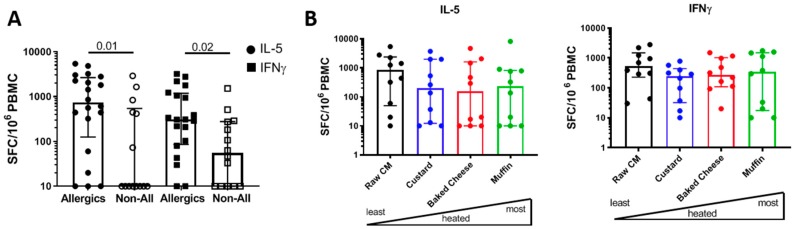
Results: the skin prick test (SPT) reactivity was significantly decreased to muffin extract compared to raw, pasteurized CM. Both IgE- and T-cell reactivity were readily detectable against food extracts from all forms of CM. Western blot analysis of IgE reactivity revealed variability between extracts that was protein-specific. T cell-reactivity was detected against all four extracts with no significant difference in IL-5 or IFNγ production between them.
Conclusion: our data indicate that despite reduced clinical reactivity, extracts from heated CM-containing foods retain immunogenicity when tested in vitro, particularly at the T cell level.
Keywords: IgE; T cells; allergen extract; baked milk; cow’s milk allergy; extensively-heated milk.
Conflict of interest statement
The authors declare no conflict of interest.
Figures
Similar articles
-
Skin testing with ultra-heat-treated (UHT) cow's milk in children with cow's milk allergy.Ann Allergy Asthma Immunol. 2020 Feb;124(2):185-189. doi: 10.1016/j.anai.2019.11.010. Epub 2019 Nov 18. Ann Allergy Asthma Immunol. 2020. PMID: 31751604
-
Evaluation of some predictive parameters for baked-milk tolerance in children with cow's milk allergy.Allergol Immunopathol (Madr). 2021 Mar 1;49(2):53-59. doi: 10.15586/aei.v49i2.64. eCollection 2021. Allergol Immunopathol (Madr). 2021. PMID: 33641294
-
Tolerance to baked and fermented cow's milk in children with IgE-mediated and non-IgE-mediated cow's milk allergy in patients under two years of age.Allergol Immunopathol (Madr). 2017 Nov-Dec;45(6):560-566. doi: 10.1016/j.aller.2017.02.008. Epub 2017 Jul 15. Allergol Immunopathol (Madr). 2017. PMID: 28720381
-
Heated allergens and induction of tolerance in food allergic children.Nutrients. 2013 Jun 5;5(6):2028-46. doi: 10.3390/nu5062028. Nutrients. 2013. PMID: 23739144 Free PMC article. Review.
-
Baked milk- and egg-containing diet in the management of milk and egg allergy.J Allergy Clin Immunol Pract. 2015 Jan-Feb;3(1):13-23; quiz 24. doi: 10.1016/j.jaip.2014.10.001. J Allergy Clin Immunol Pract. 2015. PMID: 25577613 Review.
Cited by
-
HLA-DR Marks Recently Divided Antigen-Specific Effector CD4 T Cells in Active Tuberculosis Patients.J Immunol. 2021 Jul 15;207(2):523-533. doi: 10.4049/jimmunol.2100011. Epub 2021 Jun 30. J Immunol. 2021. PMID: 34193602 Free PMC article.
-
Identification of cow milk epitopes to characterize and quantify disease-specific T cells in allergic children.J Allergy Clin Immunol. 2023 Nov;152(5):1196-1209. doi: 10.1016/j.jaci.2023.07.020. Epub 2023 Aug 19. J Allergy Clin Immunol. 2023. PMID: 37604312 Free PMC article.
-
Soy Preparations Are Potentially Dangerous Factors in the Course of a Food Allergy.Foods. 2019 Dec 7;8(12):655. doi: 10.3390/foods8120655. Foods. 2019. PMID: 31817872 Free PMC article.
References
-
- Jackson K.D., Howie L.D., Akinbami L.J. Trends in Allergic Conditions among Children: United States, 1997–2011. Centers for Disease Control and Prevention, National Center for Health Statistics, Office of Analysis and Epidemiology; Hyattsville, MD, USA: 2013. pp. 1–8. - PubMed
-
- Fleischer D.M., Perry T.T., Atkins D., Wood R.A., Burks A.W., Jones S.M., Henning A.K., Stablein D., Sampson H.A., Sicherer S.H. Allergic reactions to foods in preschool-aged children in a prospective observational food allergy study. Pediatrics. 2012;130:e25–e32. doi: 10.1542/peds.2011-1762. - DOI - PMC - PubMed
Publication types
MeSH terms
Substances
Grants and funding
LinkOut - more resources
Full Text Sources
Molecular Biology Databases
