. 2019 Jul 2;11(7):927.
doi: 10.3390/cancers11070927.

A Novel AURKA Mutant-Induced Early-Onset Severe Hepatocarcinogenesis Greater than Wild-Type via Activating Different Pathways in Zebrafish

Affiliations

A Novel AURKA Mutant-Induced Early-Onset Severe Hepatocarcinogenesis Greater than Wild-Type via Activating Different Pathways in Zebrafish

Zhong-Liang Su et al. Cancers (Basel). .

Abstract

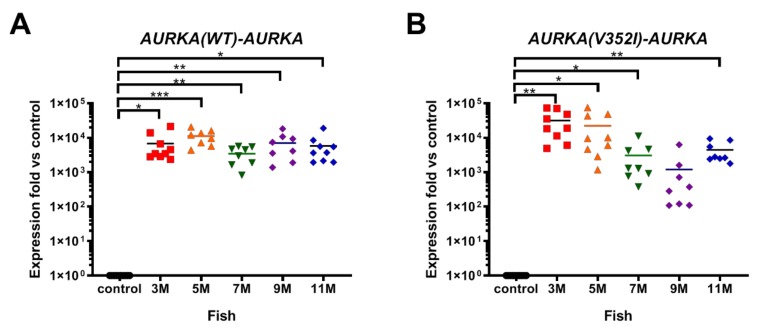
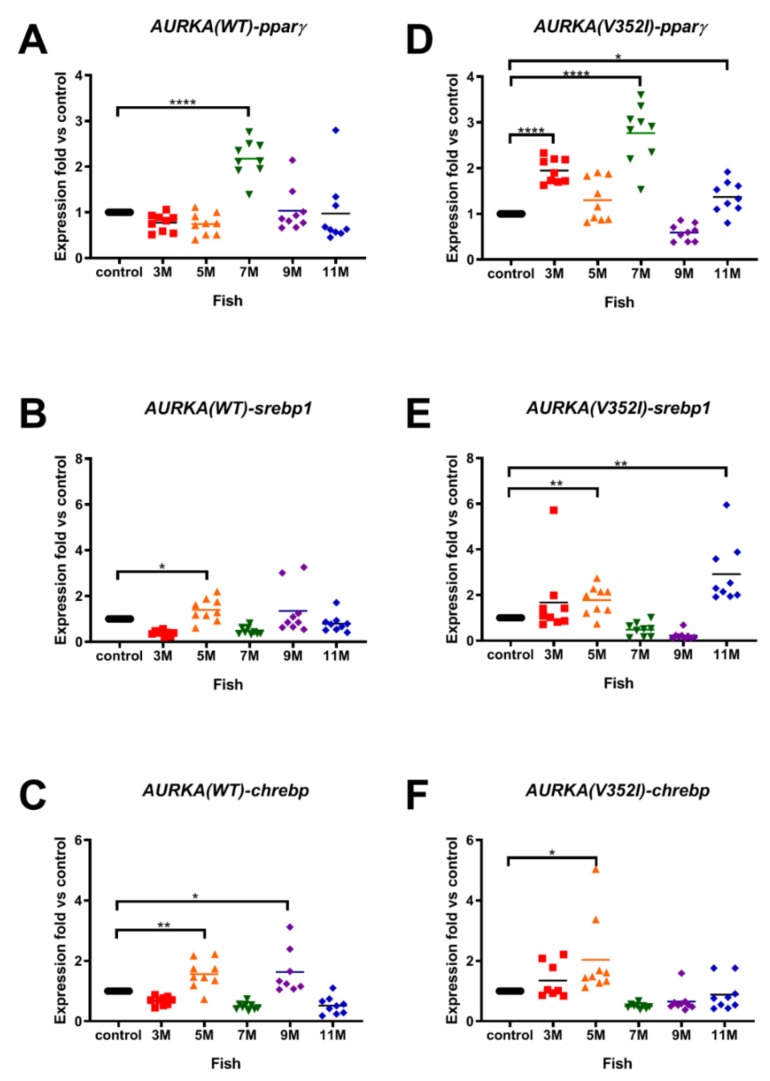
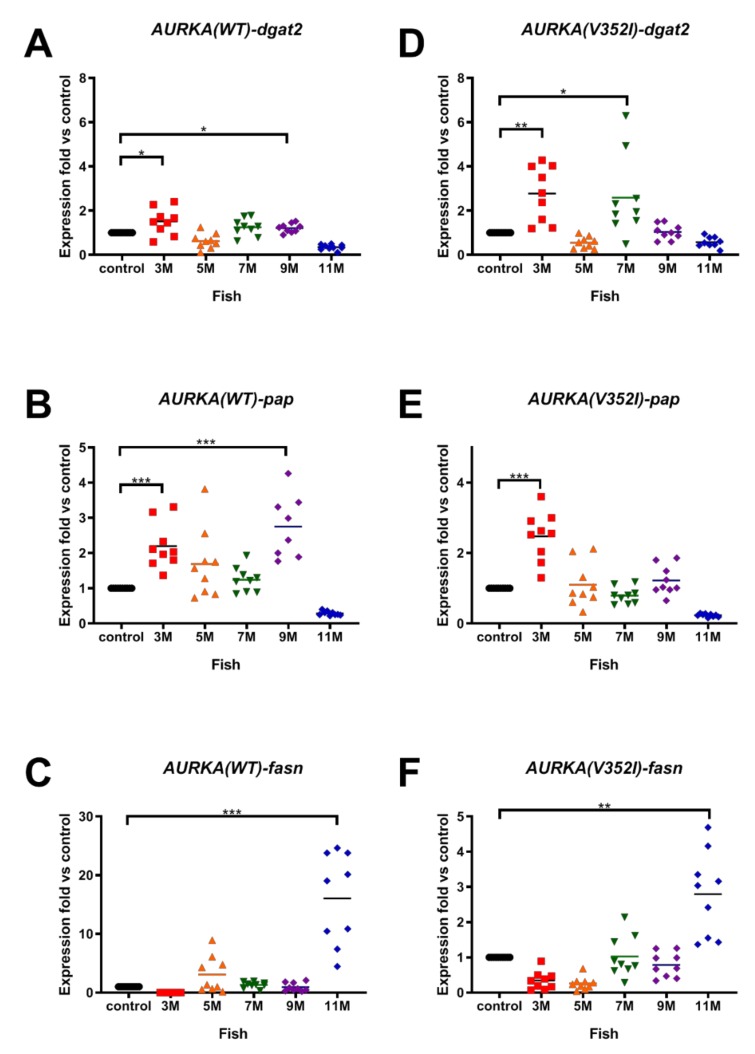
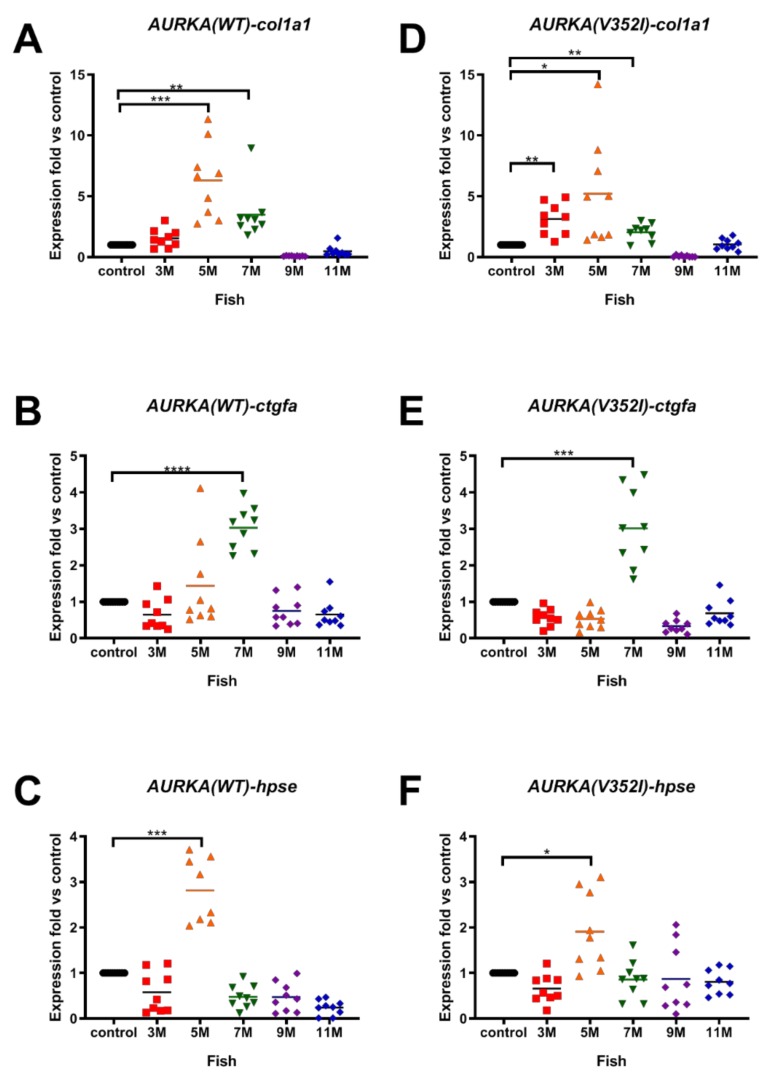
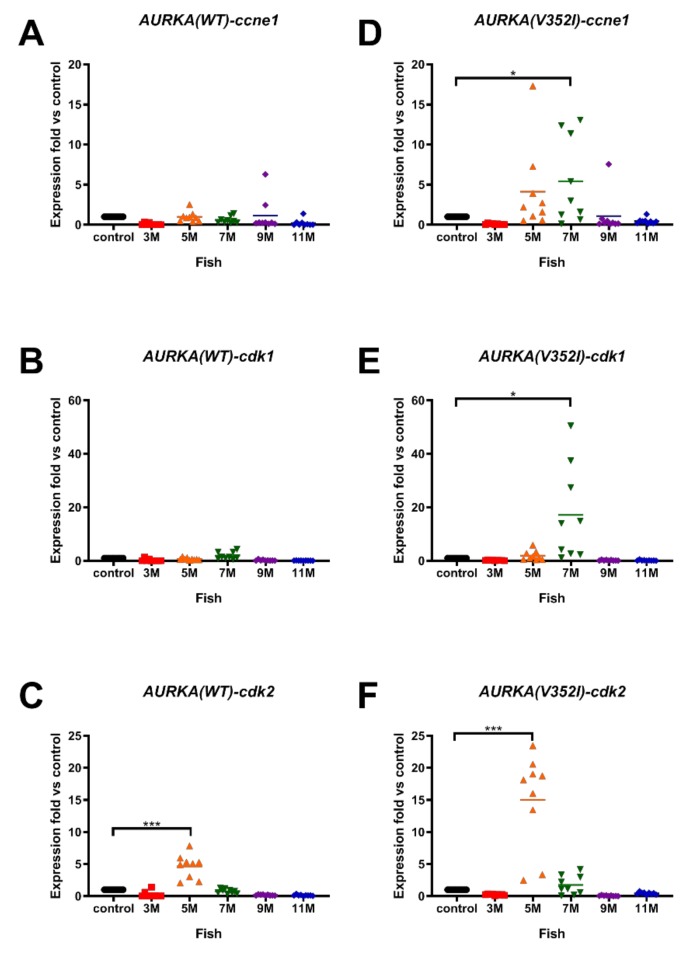
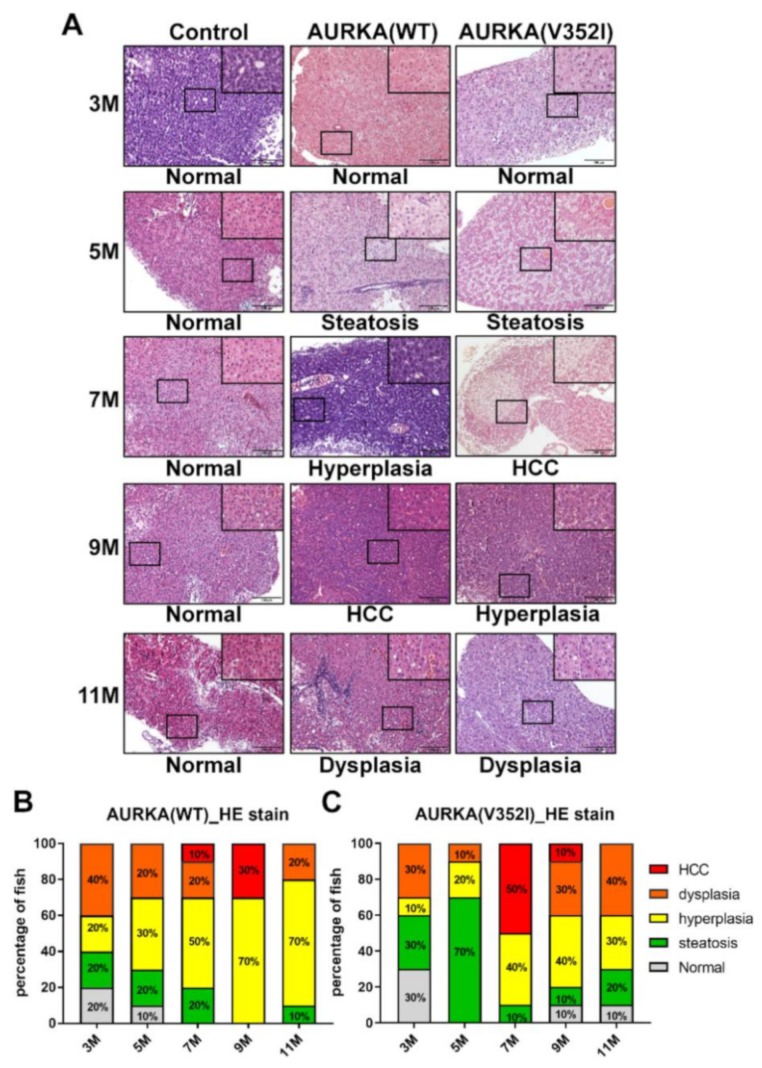
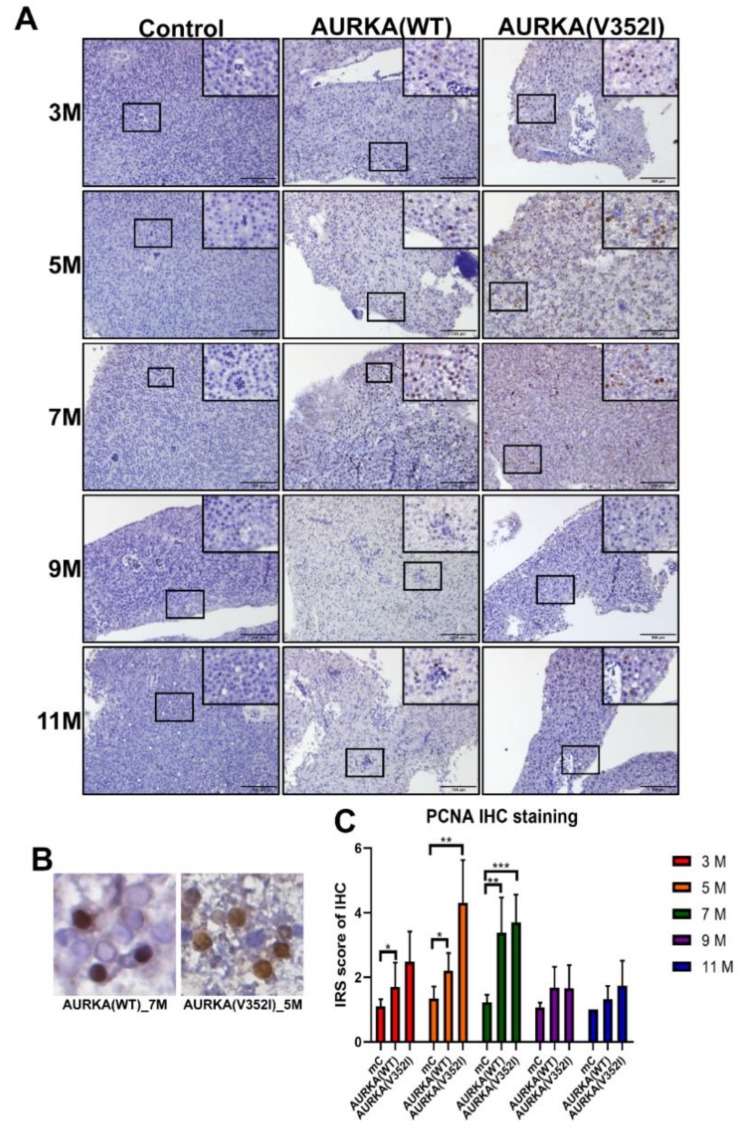
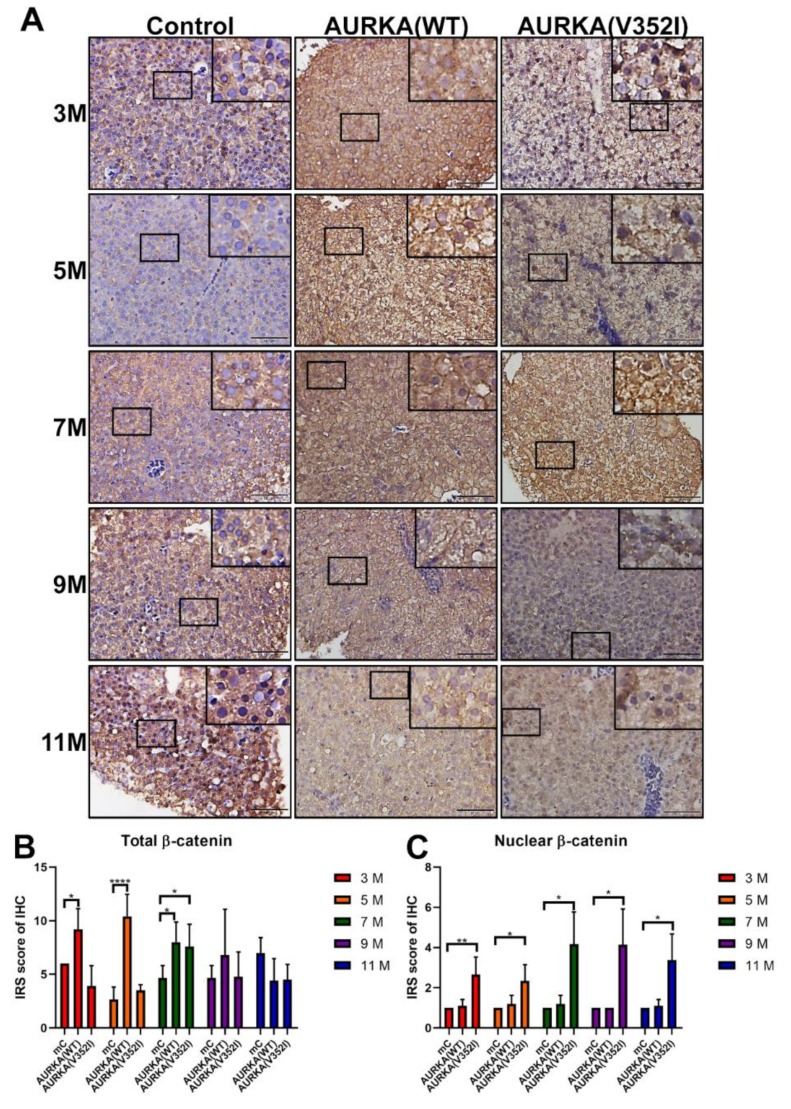
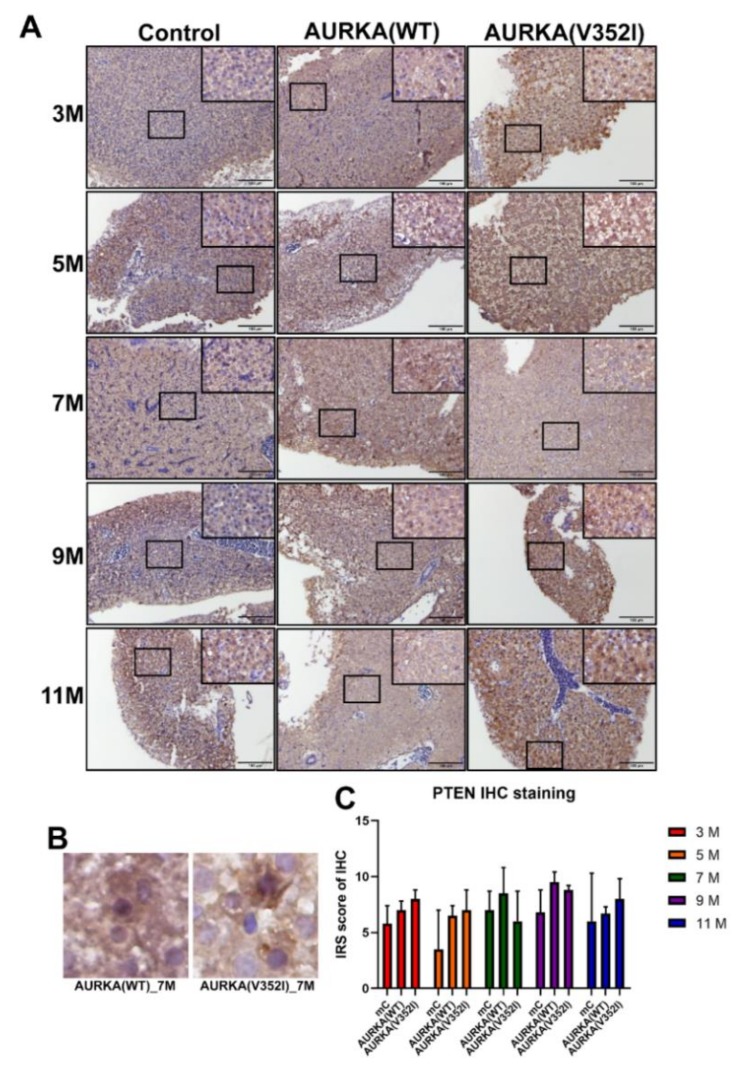
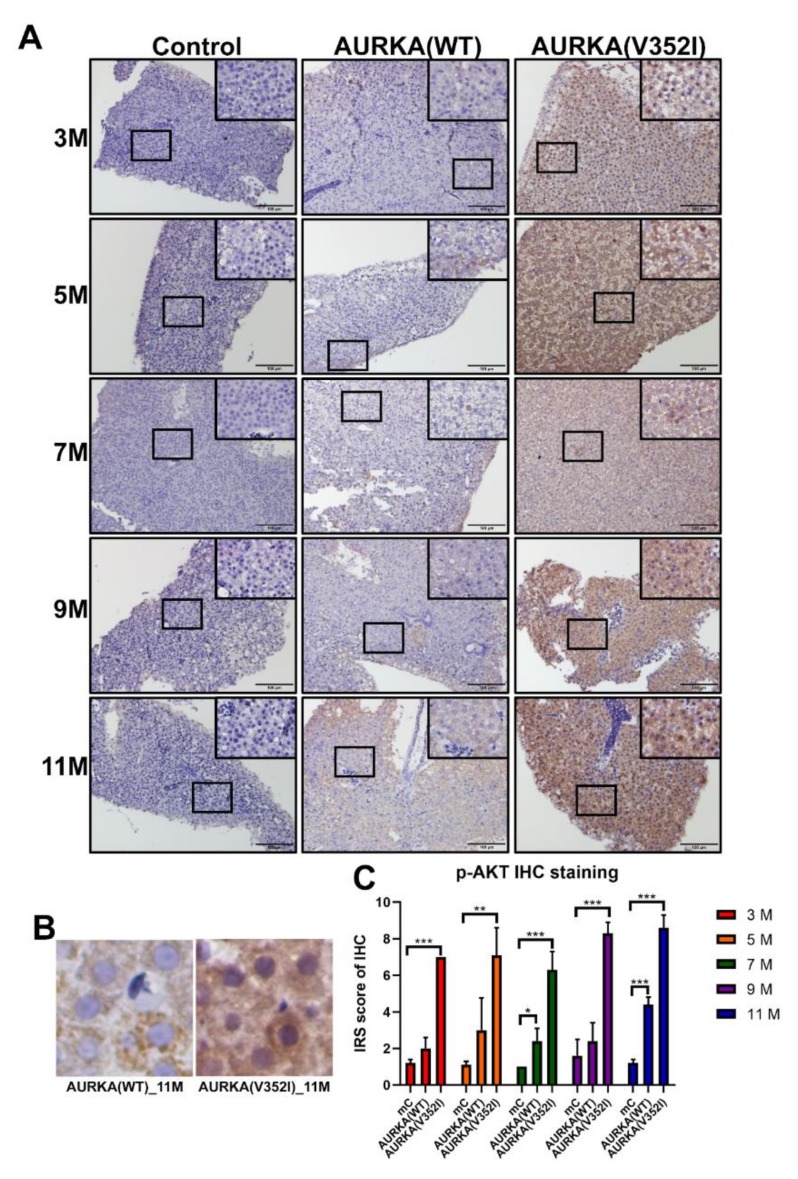
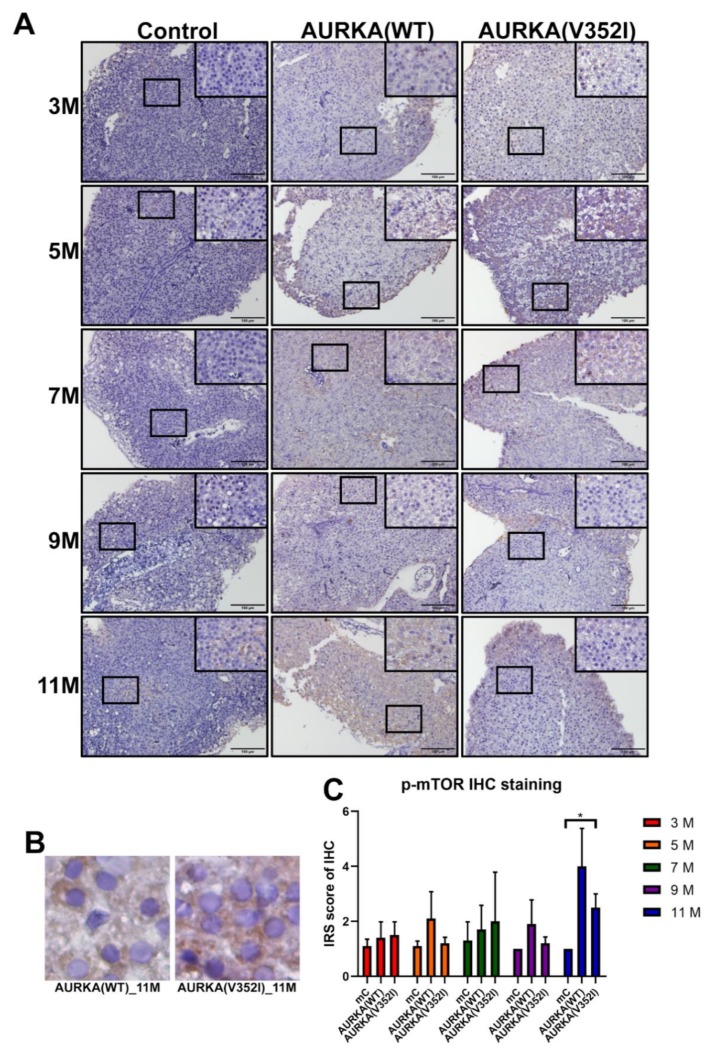
Aurora A kinase (AURKA) is an important regulator in mitotic progression and is overexpressed frequently in human cancers, including hepatocellular carcinoma (HCC). Many AURKA mutations were identified in cancer patients. Overexpressing wild-type Aurka developed a low incidence of hepatic tumors after long latency in mice. However, none of the AURKA mutant animal models have ever been described. The mechanism of mutant AURKA-mediated hepatocarcinogenesis is still unclear. A novel AURKA mutation with a.a.352 Valine to Isoleucine (V352I) was identified from clinical specimens. By using liver-specific transgenic fish overexpressing both the mutant and wild-type AURKA, the AURKA(V352I)-induced hepatocarcinogenesis was earlier and much more severe than wild-type AURKA. Although an increase of the expression of lipogenic enzyme and lipogenic factor was observed in both AURKA(V352I) and AURKA(WT) transgenic fish, AURKA(V352I) has a greater probability to promote fibrosis at 3 months compared to AURKA(WT). Furthermore, the expression levels of cell cycle/proliferation markers were higher in the AURKA(V352I) mutant than AURKA(WT) in transgenic fish, implying that the AURKA(V352I) mutant may accelerate HCC progression. Moreover, we found that the AURKA(V352I) mutant activates AKT signaling and increases nuclear β-catenin, but AURKA(WT) only activates membrane form β-catenin, which may account for the differences. In this study, we provide a new insight, that the AURKA(V352I) mutation contributes to early onset hepatocarcinogenesis, possibly through activation of different pathways than AURKA(WT). This transgenic fish may serve as a drug-screening platform for potential precision medicine therapeutics.

Keywords: AKT signaling pathway; Aurora A kinase (AURKA); hepatocellular carcinoma (HCC); zebrafish; β-catenin.


Conflict of interest statement

The authors declare no conflict of interest.

Figures

Figure 1
Figure 1
Expression of Aurora A kinase (AURKA) in AURKA(WT) and AURKA(V352I) transgenic zebrafish compared with control fish. qPCR analysis of AURKA in transgenic zebrafish (A) Tg(fabp10a:AURKA(WT)-EGFP-mCherry, myl7:EGFP); (B) Tg(fabp10a:AURKA(V352I)-EGFP-mCherry, myl7:EGFP). Expression fold compared to control fish (Tg(fabp10a:EGFP-mCherry) is shown in red (3 M), orange (5 M), green (7 M), purple (9 M), and blue (11 M). Statistical analysis of these results was performed using a two-tailed Student’s t-test. Asterisks (*) represent the level of significance. * p-value ≤ 0.05; ** p-value ≤ 0.01; *** p-value ≤ 0.001.
Figure 2
Figure 2
Expression of lipogenic factors (peroxisome proliferator-activated receptor gamma (pparγ), sterol regulatory element-binding transcription factor 1 (srebp1), carbohydrate-responsive element-binding protein (chrebp)) in AURKA(WT) and AURKA(V352I) transgenic fish were higher than control. qPCR analysis of lipogenic factors (A,D) pparγ; (B,E) srebp1; (C,F) chrebp in AURKA(WT) (AC) and AURKA(V352I) (DF) transgenic zebrafish compared to control fish at different time points. Expression fold compared to control fish Tg(fabp10a:EGFP-mCherry is shown in red (3 M), orange (5 M), green (7 M), purple (9 M), and blue (11 M). Statistical analysis of results was performed using a two-tailed Student’s t-test. Asterisks (*) represent the level of significance. * p-value ≤ 0.05; ** p-value ≤ 0.01; *** p-value ≤ 0.001; **** p-value ≤ 0.0001.
Figure 3
Figure 3
Expression of lipogenic enzymes (diacylglycerol O-Acyltransferase 2 (dgat2), phosphatidate phosphatase (pap), fatty acid synthase (fasn)) in AURKA(WT) and AURKA(V352I) transgenic fish were higher than control. qPCR analysis of lipogenic enzyme (A,D) dgat2; (B,E) pap; (C,F) fasn in AURKA(WT) (AC) and AURKA(V352I) (DF) transgenic zebrafish compared to control fish at different time points. Expression fold compared to control fish (Tg(fabp10a:EGFP-mCherry) is shown in red (3 M), orange (5 M), green (7 M), purple (9 M), and blue (11 M). Statistical analysis of results was performed using a two-tailed Student’s t-test. Asterisks (*) represent the level of significance. * p-value ≤ 0.05; ** p-value ≤ 0.01; *** p-value ≤ 0.001.
Figure 4
Figure 4
Expression of fibrosis markers (collagen type I alpha 1 (col1a1), connective tissue growth factor (ctgfa), heparanase (hpse)) in AURKA(WT) and AURKA(V352I) transgenic fish compared to control. qPCR analysis of fibrosis markers (A,D) col1a1; (B,E) ctgfa; (C,F) hpse in AURKA(WT) (AC) and AURKA(V352I) (DF) transgenic zebrafish compared to control fish at different time points. Expression fold compared to control fish (Tg(fabp10a:EGFP-mCherry) is shown in red (3 M), orange (5 M), green (7 M), purple (9 M), and blue (11 M). Statistical analysis of results was performed using a two-tailed Student’s t-test. Asterisks (*) represent the level of significance. * p-value ≤ 0.05; ** p-value ≤ 0.01; *** p-value ≤ 0.001; **** p-value ≤ 0.0001.
Figure 5
Figure 5
Expression of cell cycle related genes (cycle-related genes/proliferation marker genes G1/S-specific cyclin-E1 (ccne1), cyclin-dependent kinase 1 (cdk1), cyclin-dependent kinase 2 (cdk2)) was higher in AURKA(V352I) than AURKA(WT) transgenic fish. qPCR analysis of cell cycle/proliferation markers (A,D) ccne1; (B,E) cdk1; (C,F) cdk2 in AURKA(WT) (AC) and AURKA(V352I) (DF) transgenic zebrafish compared to control fish at different time points. Expression fold compared to control fish (Tg(fabp10a:EGFP-mCherry) is shown in red (3 M), orange (5 M), green (7 M), purple (9 M), and blue (11 M). Statistical analysis of results was performed using a two-tailed Student’s t-test. Asterisks (*) represent the level of significance. * p-value ≤ 0.05; *** p-value ≤ 0.001.
Figure 6
Figure 6
Hematoxylin and Eosin staining reveals that AURKA(V352I) dramatically promotes hepatocellular carcinoma (HCC) at 7 months, and AURKA(WT) promotes HCC at 9 months of age. (A) Representative images of HE staining in control, AURKA(WT) and AURKA(V352I) at 3, 5, 7, 9, and 11 months; (B,C) Statistical analysis of the AURKA(WT) and AURKA(V352I) HE stain results shown as percentage of fish displayed normal (gray), steatosis (green), hyperplasia (yellow), dysplasia (orange), and HCC (red) at different stages.
Figure 7
Figure 7
The immunoreactive score (IRS) of immunohistochemistry for the proliferating cell nuclear antigen (PCNA) was greater in AURKA(V352I) and AURKA(WT) than in control fish at 5 and 7 months. (A) Representative images of immunohistochemistry (IHC) staining for PCNA in control, AURKA(WT), and AURKA(V352I) at 3, 5, 7, 9, and 11 months; (B) Selected enlarged images show the nuclear signals of PCNA from AURKA(WT)—7 M and AURKA(V352I)—5 M; (C) Statistical analysis of PCNA immunostaining IRS score at 3, 5, 7, 9, and 11 months. IRS score of control fish (Tg(fabp10a:EGFP-mCherry) abbreviated as mC, AURKA(WT) and AURKA(V352I) is shown in red (3 M), orange (5 M), green (7 M), purple (9 M), and blue (11 M). Statistical analysis of results was performed using a two-tailed Student’s t-test. The error bar means standard deviation. Asterisks (*) represent the level of significance. * p-value ≤ 0.05; ** p-value ≤ 0.01; *** p-value ≤ 0.001.
Figure 8
Figure 8
Immunoreactive score of immunohistochemistry for β-catenin reveals that AURKA(V352I) is significantly lower than control and AURKA(WT) at 3, 5, and 7 months. (A) Representative images of immunohistochemistry (IHC) staining for β-catenin in control, AURKA(WT) and AURKA(V352I) at 3, 5, 7, 9, and 11 months; (B) Statistical analysis of β-catenin immunostaining IRS score at 3, 5, 7, 9, and 11 months; (C) Statistical analysis of nuclear β-catenin immunostaining IRS score at 3, 5, 7, 9, and 11 months. IRS score of control fish (Tg(fabp10a:EGFP-mCherry) abbreviated as mC, AURKA(WT) and AURKA(V352I) is shown in red (3 M), orange (5 M), green (7 M), purple (9 M), and blue (11 M). Statistical analysis of results was performed using a two-tailed Student’s t-test. The error bar means standard deviation. Asterisks (*) represent the level of significance. * p-value ≤ 0.05; ** p-value ≤ 0.01; *** p-value ≤ 0.001.
Figure 9
Figure 9
Immunoreactive score of the phosphatase and tensin homologues deleted on chromosome 10 (PTEN). Immunostaining reveals that PTEN shows no difference between control and AURKA transgenic zebrafish. (A) Representative images of immunohistochemistry (IHC) staining for PTEN in control, AURKA(WT), and AURKA(V352I) at 3, 5, 7, 9, and 11 months; (B) Selected enlarged images show the PTEN signals from AURKA(WT)—7 M and AURKA(V352I)—7 M; (C) Statistical analysis of PTEN immunostaining IRS score at 3, 5, 7, 9 and 11 months. IRS score of control fish (Tg(fabp10a:EGFP-mCherry) abbreviated as mC, AURKA(WT) and AURKA(V352I) is shown in red (3 M), orange (5 M), green (7 M), purple (9 M), and blue (11 M). Statistical analysis of results was performed using a two-tailed Student’s t-test. The error bar means standard deviation.
Figure 10
Figure 10
Immunoreactive score of p-Akt immunostaining reveals that Akt is much more significantly activated in AURKA(V352I) than in AURKA(WT). (A) Representative images of p-AKT staining for PTEN in control, AURKA(WT), and AURKA(V352I) at 3, 5, 7, 9, and 11 months; (B) Selected enlarged images show the p-AKT signals from AURKA(WT)—11 M and AURKA(V352I)—11 M; (C) Statistical analysis of p-AKT immunostaining IRS score at 3, 5, 7, 9, and 11 months. The gray, orange, and blue colors represent control, AURKA(WT), and AURKA(V352I), respectively. Statistical analysis of results was performed using a two-tailed Student’s t-test. The error bar means standard deviation. Asterisks (*) represent the level of significance. * p-value ≤ 0.05; ** p-value ≤ 0.01; *** p-value ≤ 0.001.
Figure 11
Figure 11
Immunoreactive score of phospho- mammalian target of the rapamycin (mTOR) (at Ser2448, inactive form) immunostaining for the AKT/mTOR pathway reveals that the expression of mTOR has no significant difference between control and AURKA transgenic fish. (A) Representative images of p-mTOR staining for PTEN in control, AURKA(WT), and AURKA(V352I) at 3, 5, 7, 9, and 11 months; (B) Selected enlarged images show the p-mTOR signals from AURKA(WT)—11 M and AURKA(V352I)—11 M; (C) Statistical analysis of p-mTOR immunostaining IRS score at 3, 5, 7, 9, and 11 months. IRS score of control fish (Tg(fabp10a:EGFP-mCherry) abbreviated as mC, AURKA(WT) and AURKA(V352I) is shown in red (3 M), orange (5 M), green (7 M), purple (9 M), and blue (11 M). Statistical analysis of results was performed using a two-tailed Student’s t-test. The error bar means standard deviation. Asterisks (*) represent the level of significance. * p-value ≤ 0.05.

Similar articles

Cited by

References

    1. Roberts L.R., Gores G.J. Hepatocellular carcinoma: Molecular pathways and new therapeutic targets. Semin. Liver Dis. 2005;25:212–225. doi: 10.1055/s-2005-871200. - DOI - PubMed
    1. El-Serag H.B., Rudolph K.L. Hepatocellular carcinoma: Epidemiology and molecular carcinogenesis. Gastroenterology. 2007;132:2557–2576. doi: 10.1053/j.gastro.2007.04.061. - DOI - PubMed
    1. Samonakis D.N., Kouroumalis E.A. Systemic treatment for hepatocellular carcinoma: Still unmet expectations. World J. Hepatol. 2017;9:80–90. doi: 10.4254/wjh.v9.i2.80. - DOI - PMC - PubMed
    1. Fujiwara N., Friedman S.L., Goossens N., Hoshida Y. Risk factors and prevention of hepatocellular carcinoma in the era of precision medicine. J. Hepatol. 2017 doi: 10.1016/j.jhep.2017.09.016. - DOI - PMC - PubMed
    1. Ziogas I.A., Tsoulfas G. Evolving role of Sorafenib in the management of hepatocellular carcinoma. World J. Clin. Oncol. 2017;8:203–213. doi: 10.5306/wjco.v8.i3.203. - DOI - PMC - PubMed

LinkOut - more resources