

Role of diet in type 2 diabetes incidence: umbrella review of meta-analyses of prospective observational studies
- PMID: 31270064
- PMCID: PMC6607211
- DOI: 10.1136/bmj.l2368
Role of diet in type 2 diabetes incidence: umbrella review of meta-analyses of prospective observational studies
Abstract
Objective: To summarise the evidence of associations between dietary factors and incidence of type 2 diabetes and to evaluate the strength and validity of these associations.
Design: Umbrella review of systematic reviews with meta-analyses of prospective observational studies.
Data sources: PubMed, Web of Science, and Embase, searched up to August 2018.
Eligibility criteria: Systematic reviews with meta-analyses reporting summary risk estimates for the associations between incidence of type 2 diabetes and dietary behaviours or diet quality indices, food groups, foods, beverages, alcoholic beverages, macronutrients, and micronutrients.
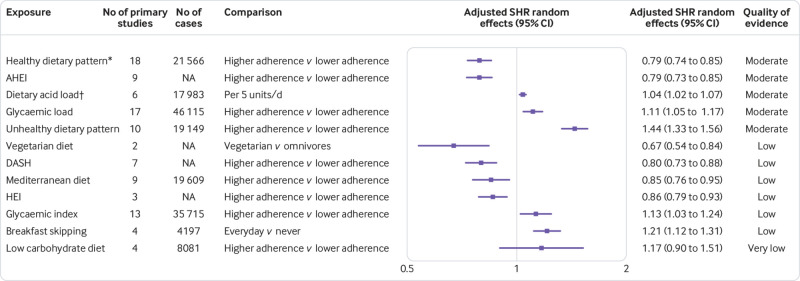
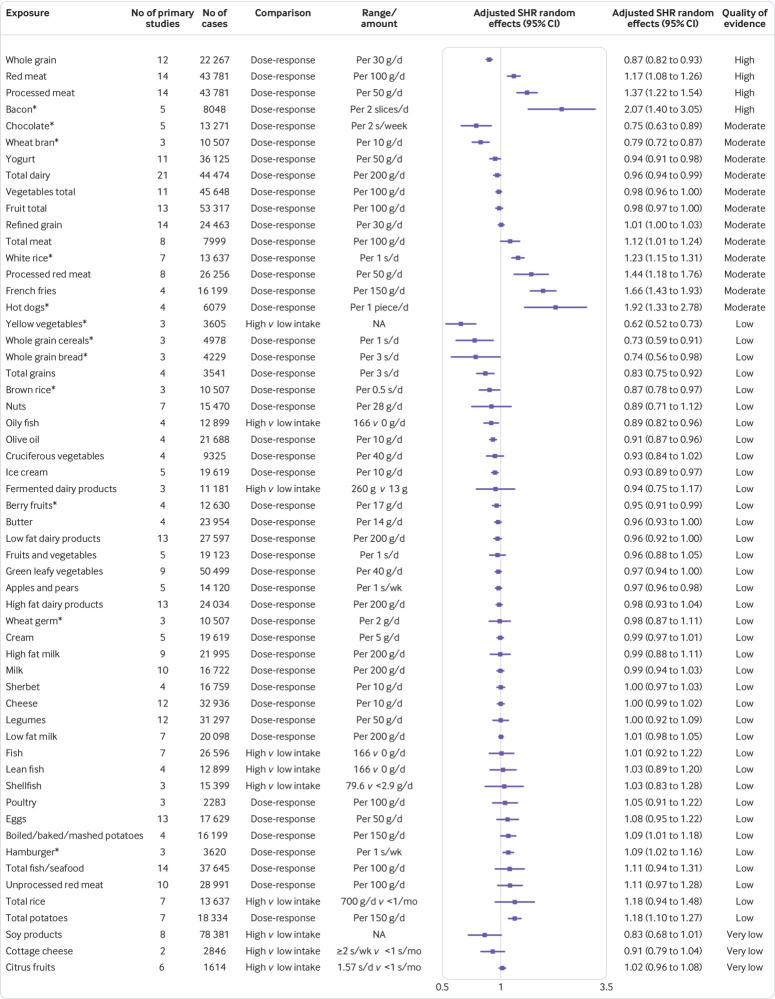
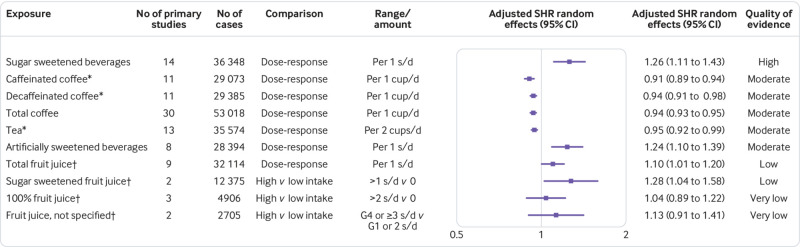
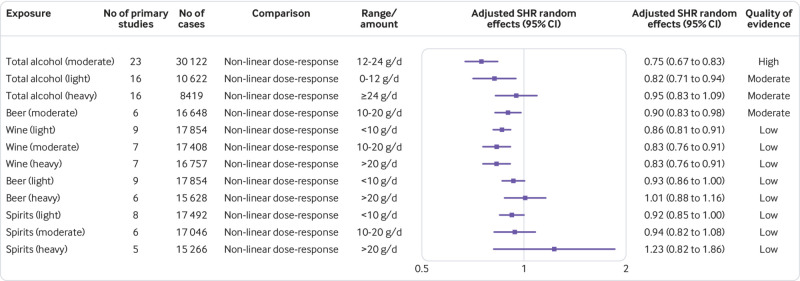
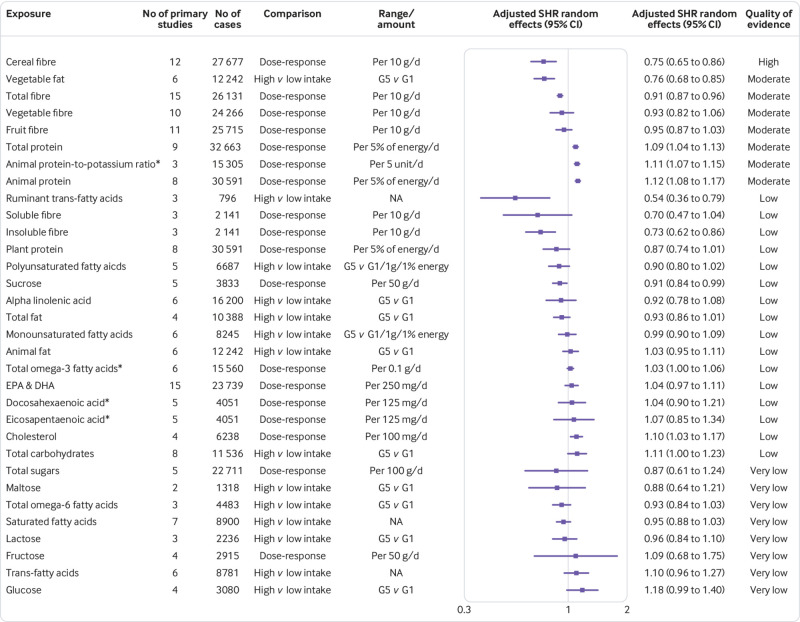
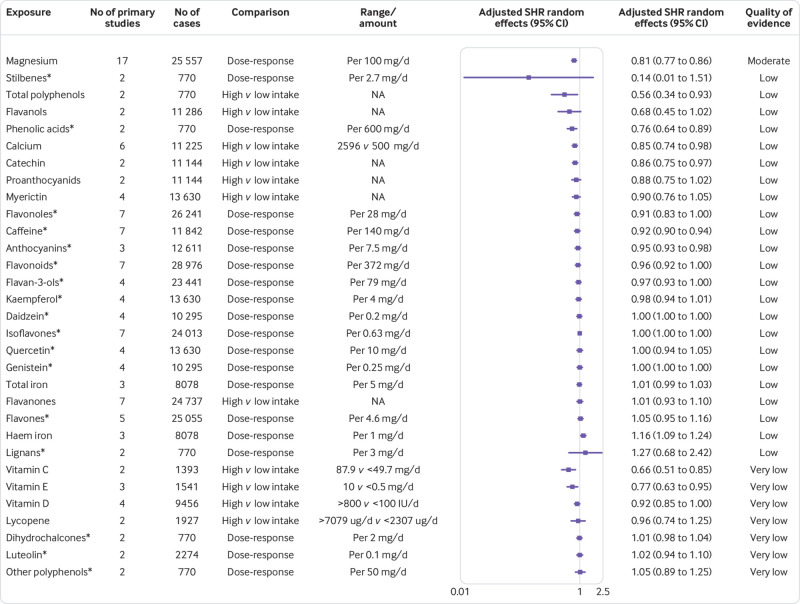
Results: 53 publications were included, with 153 adjusted summary hazard ratios on dietary behaviours or diet quality indices (n=12), food groups and foods (n=56), beverages (n=10), alcoholic beverages (n=12), macronutrients (n=32), and micronutrients (n=31), regarding incidence of type 2 diabetes. Methodological quality was high for 75% (n=115) of meta-analyses, moderate for 23% (n=35), and low for 2% (n=3). Quality of evidence was rated high for an inverse association for type 2 diabetes incidence with increased intake of whole grains (for an increment of 30 g/day, adjusted summary hazard ratio 0.87 (95% confidence interval 0.82 to 0.93)) and cereal fibre (for an increment of 10 g/day, 0.75 (0.65 to 0.86)), as well as for moderate intake of total alcohol (for an intake of 12-24 g/day v no consumption, 0.75 (0.67 to 0.83)). Quality of evidence was also high for the association for increased incidence of type 2 diabetes with higher intake of red meat (for an increment of 100 g/day, 1.17 (1.08 to 1.26)), processed meat (for an increment of 50 g/day, 1.37 (1.22 to 1.54)), bacon (per two slices/day, 2.07 (1.40 to 3.05)), and sugar sweetened beverages (for an increase of one serving/day, 1.26 (1.11 to 1.43)).
Conclusions: Overall, the association between dietary factors and type 2 diabetes has been extensively studied, but few of the associations were graded as high quality of evidence. Further factors are likely to be important in type 2 diabetes prevention; thus, more well conducted research, with more detailed assessment of diet, is needed.
Systematic review registration: PROSPERO CRD42018088106.
Published by the BMJ Publishing Group Limited. For permission to use (where not already granted under a licence) please go to http://group.bmj.com/group/rights-licensing/permissions.
Conflict of interest statement
Competing interests: All authors have completed the ICMJE uniform disclosure form at www.icmje.org/coi_disclosure.pdf and declare: support from the German Federal Ministry of Health, the Ministry of Innovation, Science, Research and Technology of the State North Rhine-Westphalia, and the German Federal Ministry of Education and Research to the German Centre for Diabetes Research for the submitted work; no financial relationships with any organisations that might have an interest in the submitted work in the previous three years; no other relationships or activities that could appear to have influenced the submitted work.
Figures
References
-
- International Diabetes Federation (IDF) IDF Diabetes Atlas. 8th ed 2017.
-
- World Health Organization (WHO) Global report on diabetes. World Health Organization, 2016.