

Quantifying the impact of genes on body mass index during the obesity epidemic: longitudinal findings from the HUNT Study
- PMID: 31270083
- PMCID: PMC6607203
- DOI: 10.1136/bmj.l4067
Quantifying the impact of genes on body mass index during the obesity epidemic: longitudinal findings from the HUNT Study
Abstract
Objectives: To study the trajectories of body mass index (BMI) in Norway over five decades and to assess the differential influence of the obesogenic environment on BMI according to genetic predisposition.
Design: Longitudinal study.
Setting: General population of Nord-Trøndelag County, Norway.
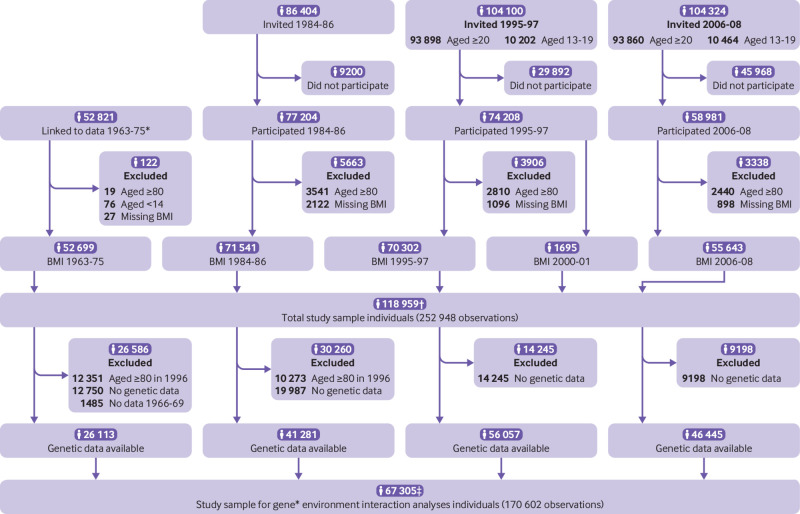
Participants: 118 959 people aged 13-80 years who participated in a longitudinal population based health study (Nord-Trøndelag Health Study, HUNT), of whom 67 305 were included in analyses of association between genetic predisposition and BMI.
Main outcome measure: BMI.
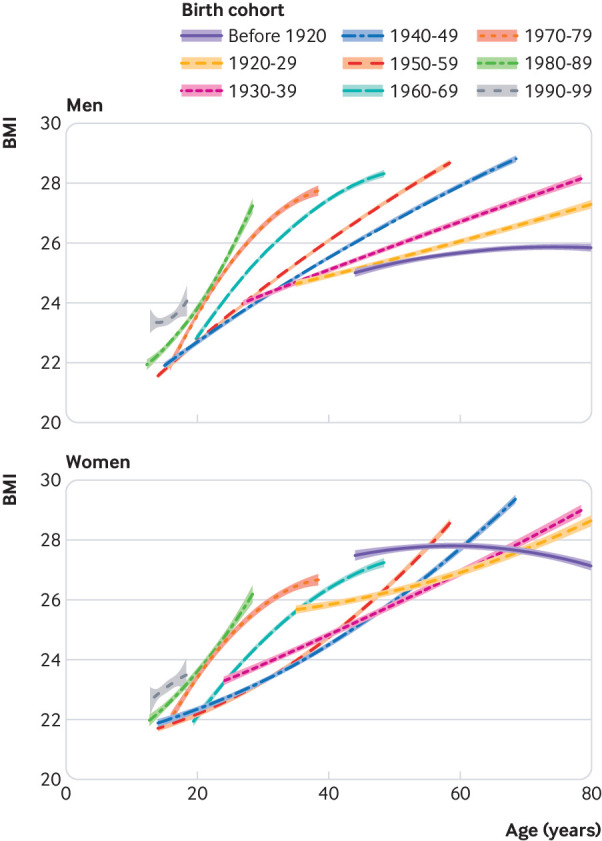
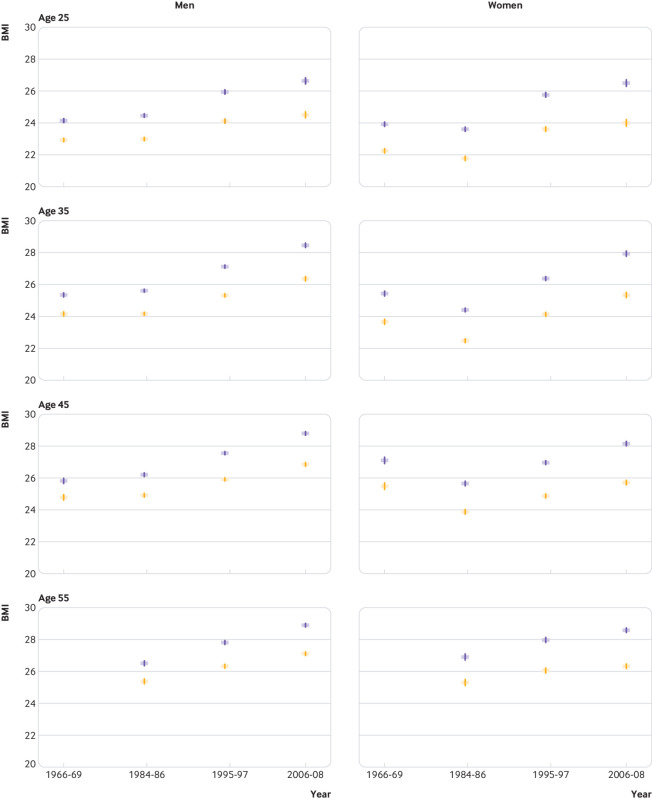
Results: Obesity increased in Norway starting between the mid-1980s and mid-1990s and, compared with older birth cohorts, those born after 1970 had a substantially higher BMI already in young adulthood. BMI differed substantially between the highest and lowest fifths of genetic susceptibility for all ages at each decade, and the difference increased gradually from the 1960s to the 2000s. For 35 year old men, the most genetically predisposed had 1.20 kg/m2 (95% confidence interval 1.03 to 1.37 kg/m2) higher BMI than those who were least genetically predisposed in the 1960s compared with 2.09 kg/m2 (1.90 to 2.27 kg/m2) in the 2000s. For women of the same age, the corresponding differences in BMI were 1.77 kg/m2 (1.56 to 1.97 kg/m2) and 2.58 kg/m2 (2.36 to 2.80 kg/m2).
Conclusions: This study provides evidence that genetically predisposed people are at greater risk for higher BMI and that genetic predisposition interacts with the obesogenic environment resulting in higher BMI, as observed between the mid-1980s and mid-2000s. Regardless, BMI has increased for both genetically predisposed and non-predisposed people, implying that the environment remains the main contributor.
Published by the BMJ Publishing Group Limited. For permission to use (where not already granted under a licence) please go to http://group.bmj.com/group/rights-licensing/permissions.
Conflict of interest statement
Competing interests: All authors have completed the ICMJE uniform disclosure form at www.icmje.org/coi_disclosure.pdf and declare: GÅV reports grants from the Research Council of Norway during the conduct of the study. MB reports grants from the Liaison Committee for Education, Research and Innovation in Central Norway during the conduct of the study; no financial relationships with any organisations that might have an interest in the submitted work in the previous three years; no other relationships or activities that could appear to have influenced the submitted work.
Figures
Comment in
-
Understanding the obesity epidemic.BMJ. 2019 Jul 3;366:l4409. doi: 10.1136/bmj.l4409. BMJ. 2019. PMID: 31270066 No abstract available.
References
-
- Obesity and Overweight: World Health Organization; www.who.int/en/news-room/fact-sheets/detail/obesity-and-overweight (2018-08-02).
-
- NCD Risk Factor Collaboration (NCD-RisC) Worldwide trends in body-mass index, underweight, overweight, and obesity from 1975 to 2016: a pooled analysis of 2416 population-based measurement studies in 128·9 million children, adolescents, and adults. Lancet 2017;390:2627-42. 10.1016/S0140-6736(17)32129-3 - DOI - PMC - PubMed
MeSH terms
LinkOut - more resources
Full Text Sources
Medical