. 2019 Sep;18(9):1637-1648.
doi: 10.1158/1535-7163.MCT-18-1056. Epub 2019 Jul 3.

In Vivo ERK1/2 Reporter Predictively Models Response and Resistance to Combined BRAF and MEK Inhibitors in Melanoma

Affiliations

In Vivo ERK1/2 Reporter Predictively Models Response and Resistance to Combined BRAF and MEK Inhibitors in Melanoma

Ileine M Sanchez et al. Mol Cancer Ther. 2019 Sep.

Abstract

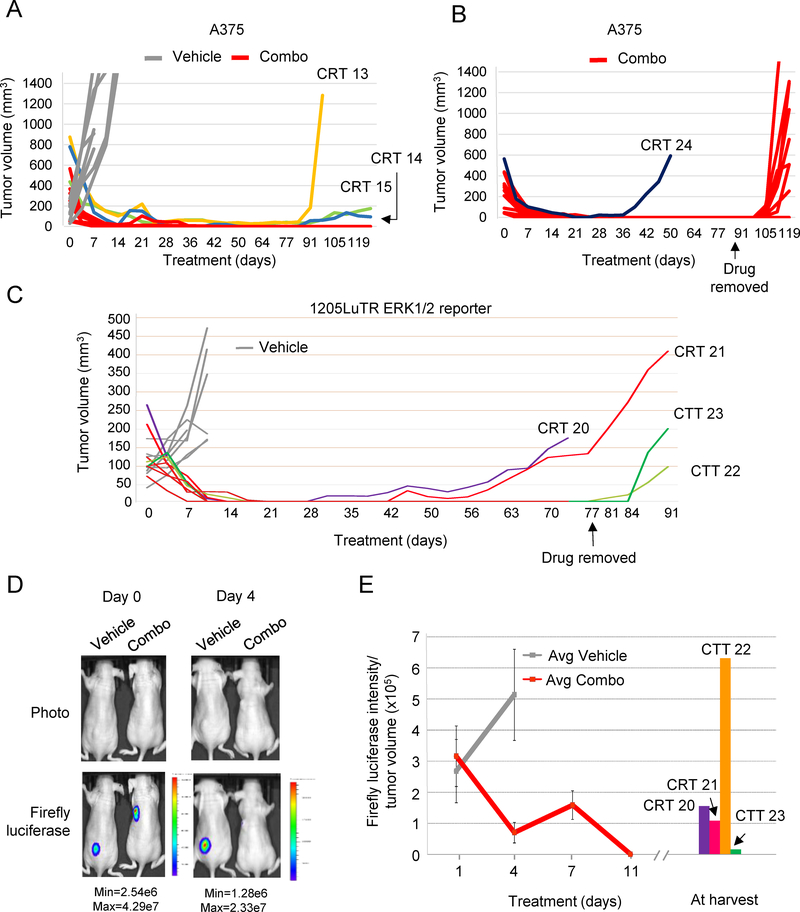
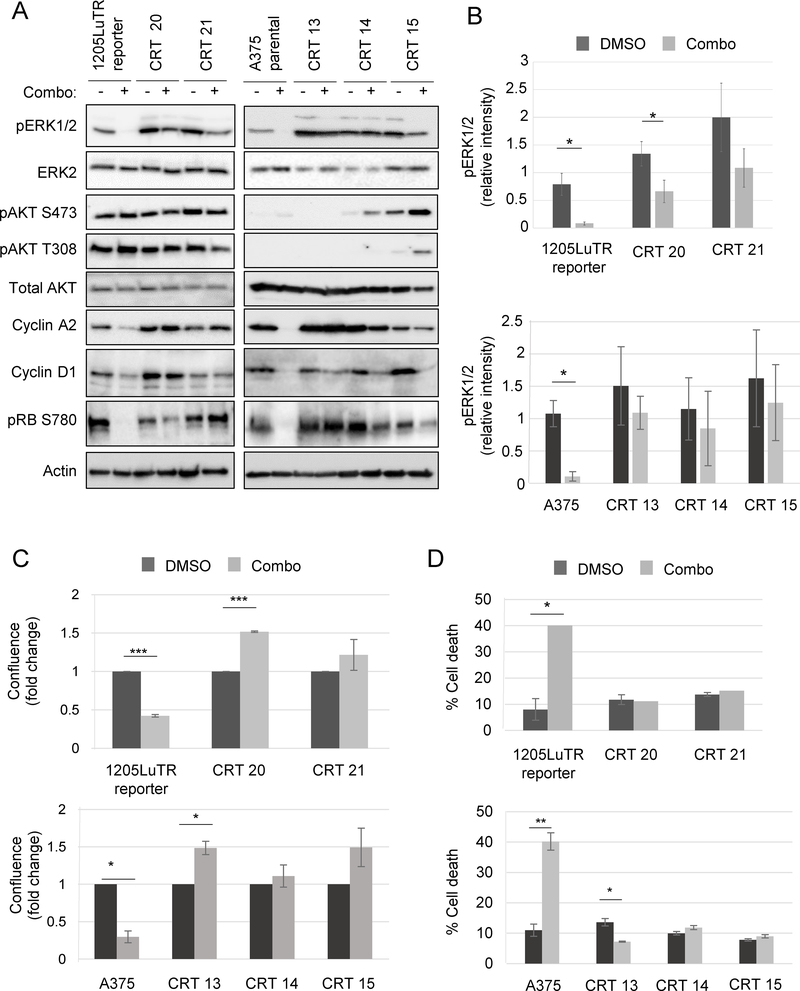
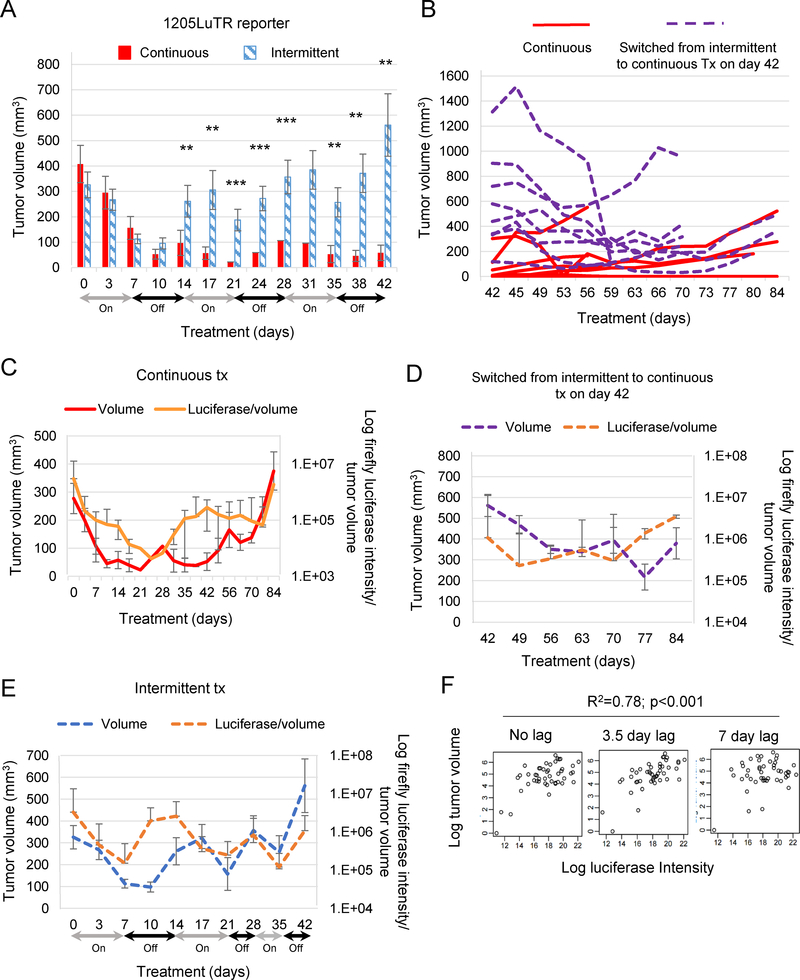
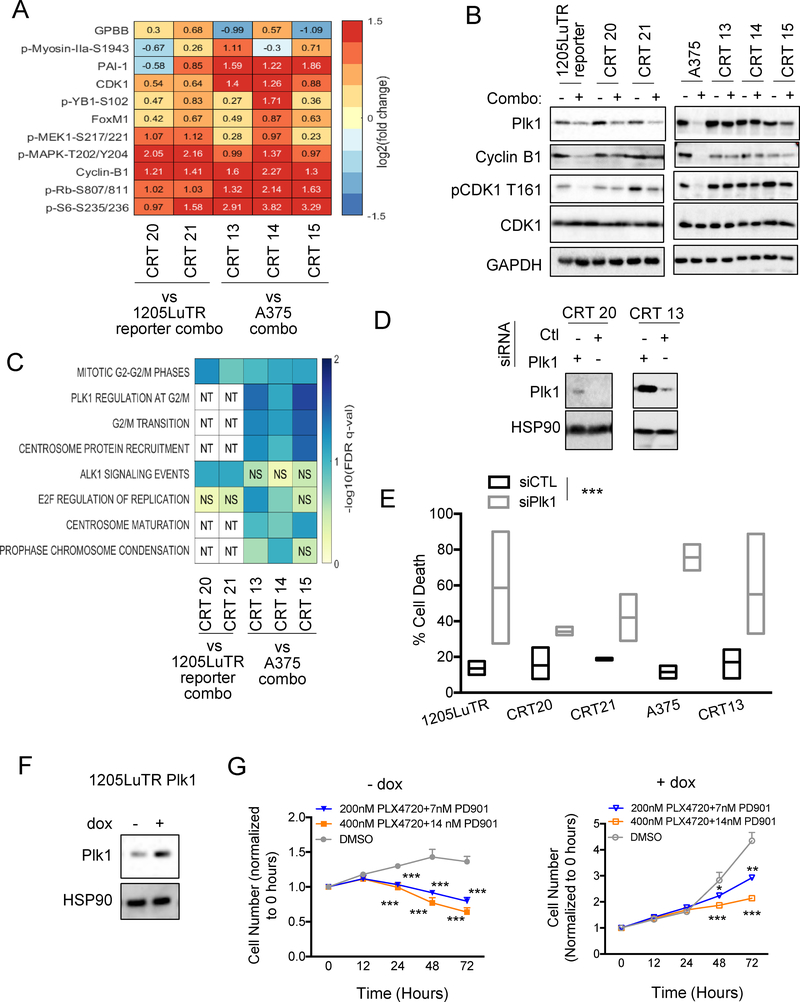
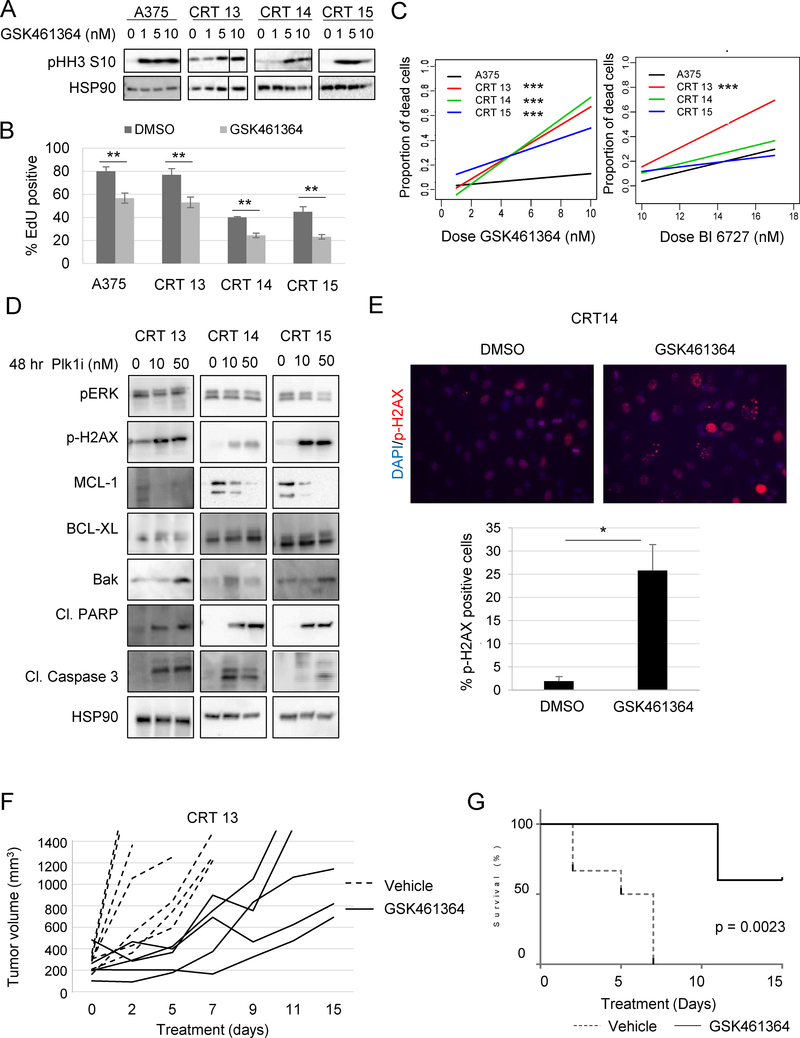
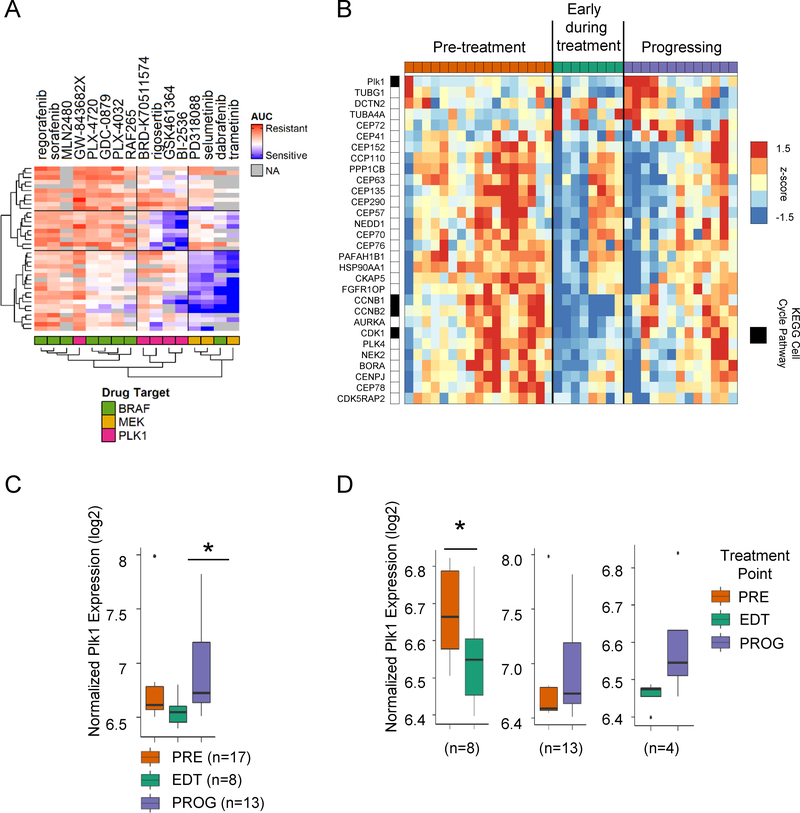
Combined BRAF and MEK inhibition is a standard of care in patients with advanced BRAF-mutant melanoma, but acquired resistance remains a challenge that limits response durability. Here, we quantitated in vivo ERK1/2 activity and tumor response associated with resistance to combined BRAF and MEK inhibition in mutant BRAF xenografts. We found that ERK1/2 pathway reactivation preceded the growth of resistant tumors. Moreover, we detected a subset of cells that not only persisted throughout long-term treatment but restored ERK1/2 signaling and grew upon drug removal. Cell lines derived from combination-resistant tumors (CRT) exhibited elevated ERK1/2 phosphorylation, which were sensitive to ERK1/2 inhibition. In some CRTs, we detected a tandem duplication of the BRAF kinase domain. Monitoring ERK1/2 activity in vivo was efficacious in predicting tumor response during intermittent treatment. We observed maintained expression of the mitotic regulator, polo-like kinase 1 (Plk1), in melanoma resistant to BRAF and MEK inhibitors. Plk1 inhibition induced apoptosis in CRTs, leading to slowed growth of BRAF and MEK inhibitor-resistant tumors in vivo These data demonstrate the utility of in vivo ERK1/2 pathway reporting as a tool to optimize clinical dosing schemes and establish suppression of Plk1 as potential salvage therapy for BRAF inhibitor and MEK inhibitor-resistant melanoma.


Figures

Fig 1.
Fig 1.. Melanoma xenografts developed resistance to prolonged combination BRAF inhibitor plus MEK inhibitor treatment in vivo.
(A) Human mutant BRAF melanoma A375 cells were injected intradermally into athymic nude mice and allowed to form palpable tumors. Mice were then given chow laced with either vehicle (n=8) or combination BRAF inhibitor plus MEK inhibitor (200 mg/kg of PLX4720 + 7 mg/kg of PD0325901; n=12). Graphed is tumor volume, as measured with digital calipers, versus time in days. Three resistant tumors arose in this cohort by day 91 (CRT 13, CRT 14, and CRT 15). (B) Tumor volumes of an independent cohort of combo-treated A375 xenografts (n=12). One CRT emerged on day 42, and the remaining 11 CTTs grew after drug removal on day 91. (C) 1205LuTR ERK½ reporter cells were used in similar experiments. Two mice developed acquired resistant tumors (CRT 20 and CRT 21). Tumor-free mice (n=6) remained on drug until day 77 at which time point drug was removed. Tumors emerged in two mice following drug removal on days 84 and 88 and were termed combination tolerant tumors (CTT 22 and CTT 23). (D) Xenograft models of 1205LuTR ERK½ reporter cells in mice that were fed either vehicle or combination drug were imaged for firefly luciferase. Representative images are shown from mice on day 0 and day 4. (E) Average ratios of firefly luciferase intensity to tumor volume. Combination-resistant and tolerant tumors were imaged for firefly luciferase on the day of tumor harvest.
Fig 2.
Fig 2.. Cell lines generated from combination-resistant tumors displayed ERK½ reactivation.
(A) Western blots of lysates from matched parental cell lines: 1205LuTR reporter for CRT 20 and 21; and A375 for CRT 13, 14, and 15 were blotted for signaling proteins and cell cycle progression markers as indicated (n=3). (B) Quantification of pERK½ intensity normalized to loading control in parental cells and CRTs. Shown are the mean and SEM of five independent experiments, *p<0.05. (C) Parental cells (1205LuTR and A375) and CRTs (20, 21, 13, 14, and 15) were grown for 72 hours in either vehicle (DMSO) or 1 μM PLX4720 and 35 nM PD0325901 and then assayed for 2D growth by measuring live cell counts. Shown are the mean and SEM of three independent experiments, *p<0.05, ***p<0.001 (n=3). (D) Parental cells and CRTs were grown for 72 hours in either vehicle (DMSO) or 1 μM PLX4720 and 35 nM PD0325901 and then processed for annexin V and PI staining as markers for early and late apoptosis. *p<0.05, **p<0.01 (n=3).
Fig 3.
Fig 3.. Modeling of tumor volume using in vivo ERK½ pathway activation.
(A-B) 1205LuTR reporter xenografts were treated continuously (n=9) for 84 days or intermittently (n=10) on a one week on, one week off cycle until day 42. Intermittently treated mice were switched to continuous dosing on day 42. Bar graph represents average tumor volume up to day 42. After day 42 data, are presented as a line graph for individual mice. (C-E) Average tumor volumes and luciferase intensity normalized to tumor volume during continuous (red), intermittent (blue), or intermittent switched to continuous (purple) treatment schemes. (F) Regression analysis of intermittent dosing as quantification for the association between firefly expression and tumor volume.
Fig 4.
Fig 4.. Plk1 is involved in resistance to BRAF and MEK inhibition.
(A). Heatmap showing the significant fold change for proteins in all CRTs relative to parental. (B) Western blot analysis of cell cycle progression proteins and Plk1 expression in combo. (C) Heatmap of pathways found to be significantly enriched in at least 2 of the comparisons. ‘NS’ represents pathways that were not found to be significant, and ‘NT’ represents pathways that were not tested due to the comparator having less than the number of proteins needed to represent the pathway). (D) Western blot analysis of Plk1 in CRTs after siRNA knockdown of Plk1 (n=3). (E) Percent cell death, as determined by annexin and PI staining, in parental and CRT cell lines after siRNA knockdown of Plk1, ***p<0.001 (n=2–4). (F) Western blot analysis of Plk1 in 1205LuTR Plk1 after 24 hours of doxycycline (dox) treatment, *p<0.05 (n=3). (G) Cell growth of 1205LuTR Plk1 cells +/− dox (24 hours pretreatment) treated with PLX4720 and PD’901 represented as normalized cell number over time, *p<0.05, **p<0.01, ***p<0.001 (n=3).
Fig 5.
Fig 5.. Plk1 inhibition induces cell death, leading to tumor growth delay of CRTs
(A) Western blot analysis of cell lines treated for 24 hours with the indicated dose and probed for readout of Plk1 inhibition (n=3). (B) EdU incorporation of cells treated with Plk1 inhibitor (GSK461364; 50 nM) for 72 hours, **p<0.01 (n=3). (C) Slopes of the proportion of dead cells after 72 hours of treatment with indicated doses of GSK461364, ***p<0.001. (D) Western blot analysis of pERK½, p-H2AX, MCL-1, BCL-XL, Bak, cleaved PARP, and cleaved-caspase 3 after treatment with Plk1 inhibitor (GSK461364, n=3). (E) Immunofluorescent staining of p-H2AX in CRT14 after treatment with 20 nM GSK461364, *p<0.05 (n=3). (F) Tumor growth, indicated by change in volume over time, of CRT 13 tumors treated with Plk1 inhibitor (GSK461364; 25 mg/kg/dose) in nude mice. (G) Kaplan Meier survival curve of F, ***p<0.001.
Fig 6.
Fig 6.. Plk1 expression changes in patients throughout stages of treatment.
(A) Heat map of the area under drug response dose curve (AUC) data for mutant BRAF melanoma cell lines (n=37), for BRAF, MEK and Plk1 inhibitors from the Cancer Therapeutic Response Portal (CTRP v2.1) data set. Missing drug sensitivity data are colored in gray. (B) Heat map of median-centered expression data for significantly altered genes (>50% fold-change) in the Regulation of Plk1 Activity at G/2M Transition gene set for pre-treatment (PRE), early-during treatment (EDT) and progressing on treatment (PROG) samples taken from patient tumors before, during or after dabrafenib, vemurafenib or dabrafenib plus trametinib treatment. Samples were separated based on treatment time points (row 1). KEGG cell cycle genes are indexed in black next to the gene name. Box plot showing normalized log2 Plk1 expression in (C) all samples and (D) matched samples from patients with PRE, EDT and PROG tumors. A linear model was used for statistical analysis of the aggregate (non-paired) Plk1 tumors and paired samples. Letters in the brackets identify which sub-image accurately represents the samples used.

References

    1. Wargo JA, Cooper ZA, Flaherty KT. Universes collide: combining immunotherapy with targeted therapy for cancer. Cancer Dis 2014;4:1377–86. - PMC - PubMed
    1. Conner SR, Scott G, Aplin AE. Adhesion-dependent activation of the ERK½ cascade is by-passed in melanoma cells. J Biol Chem 2003;278:34548–54. - PubMed
    1. Hingorani SR, Jacobetz MA, Robertson GP, Herlyn M, Tuveson DA. Suppression of BRAF(V599E) in human melanoma abrogates transformation. Cancer research 2003;63:5198–202. - PubMed
    1. Malissen N, Grob JJ. Metastatic Melanoma: Recent Therapeutic Progress and Future Perspectives. Drugs 2018;78:1197–209 doi 10.1007/s40265-018-0945-z. - DOI - PubMed
    1. Flaherty KT, Robert C, Hersey P, Nathan P, Garbe C, Milhem M, et al. Improved survival with MEK inhibition in BRAF-mutated melanoma. The New England journal of medicine 2012;367:107–14. - PubMed

Publication types

MeSH terms

Substances