. 2019 Sep 18;39(38):7604-7614.
doi: 10.1523/JNEUROSCI.0654-18.2019. Epub 2019 Jul 3.

Altered Synaptic Drive onto Birthdated Dentate Granule Cells in Experimental Temporal Lobe Epilepsy

Affiliations

Altered Synaptic Drive onto Birthdated Dentate Granule Cells in Experimental Temporal Lobe Epilepsy

Alison L Althaus et al. J Neurosci. .

Abstract

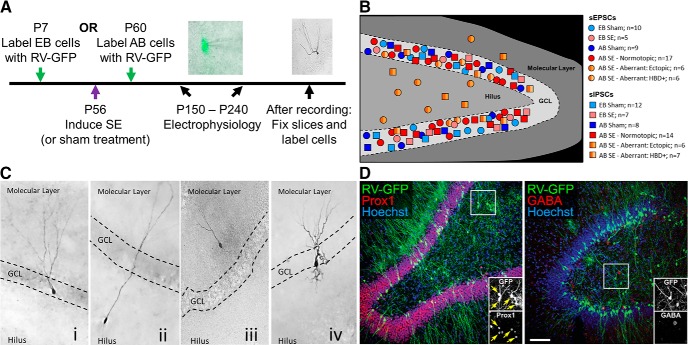
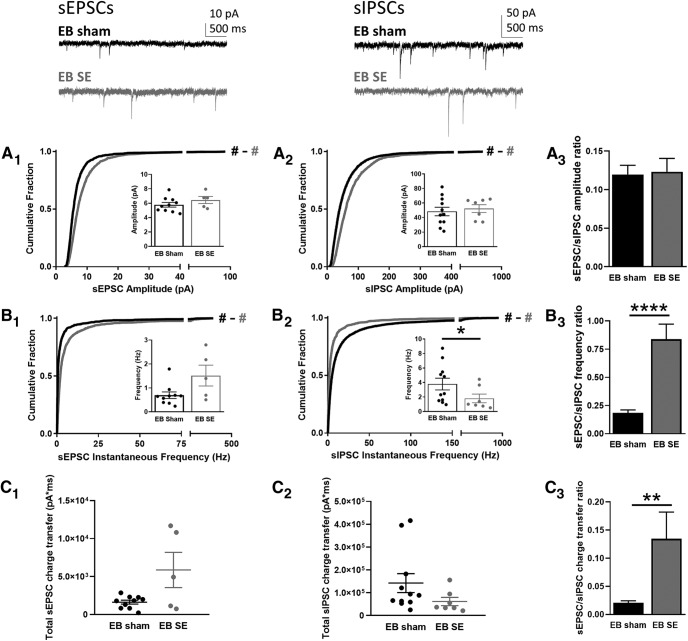
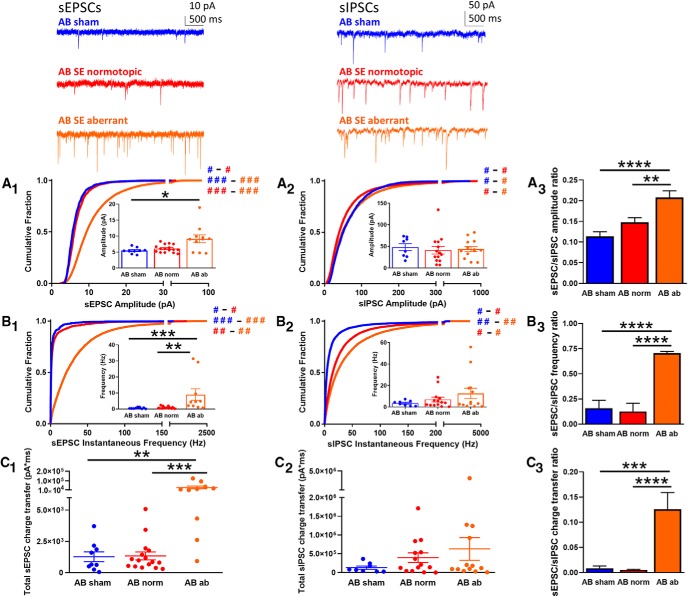
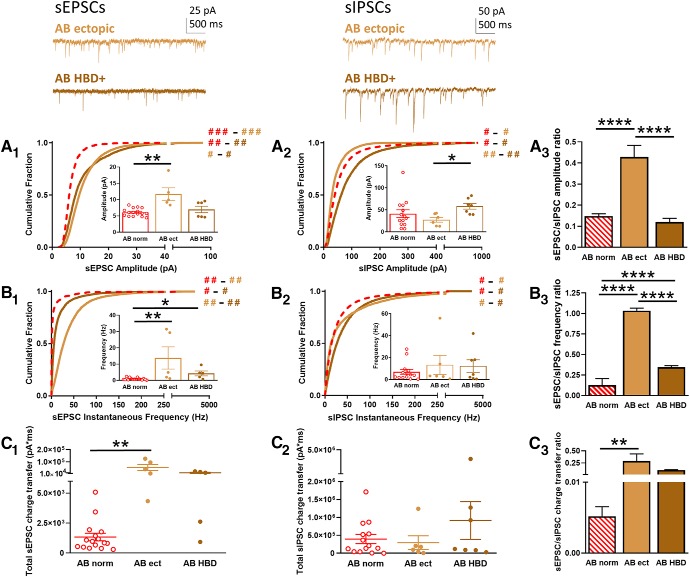
Dysregulated adult hippocampal neurogenesis occurs in many temporal lobe epilepsy (TLE) models. Most dentate granule cells (DGCs) generated in response to an epileptic insult develop features that promote increased excitability, including ectopic location, persistent hilar basal dendrites (HBDs), and mossy fiber sprouting. However, some appear to integrate normally and even exhibit reduced excitability compared to other DGCs. To examine the relationship between DGC birthdate, morphology, and network integration in a model of TLE, we retrovirally birthdated either early-born [EB; postnatal day (P)7] or adult-born (AB; P60) DGCs. Male rats underwent pilocarpine-induced status epilepticus (SE) or sham treatment at P56. Three to six months after SE or sham treatment, we used whole-cell patch-clamp and fluorescence microscopy to record spontaneous excitatory and inhibitory currents from birthdated DGCs. We found that both AB and EB populations of DGCs recorded from epileptic rats received increased excitatory input compared with age-matched controls. Interestingly, when AB populations were separated into normally integrated (normotopic) and aberrant (ectopic or HBD-containing) subpopulations, only the aberrant populations exhibited a relative increase in excitatory input (amplitude, frequency, and charge transfer). The ratio of excitatory-to-inhibitory input was most dramatically upregulated for ectopically localized DGCs. These data provide definitive physiological evidence that aberrant integration of post-SE, AB DGCs contributes to increased synaptic drive and support the idea that ectopic DGCs serve as putative hub cells to promote seizures.SIGNIFICANCE STATEMENT Adult dentate granule cell (DGC) neurogenesis is altered in rodent models of temporal lobe epilepsy (TLE). Some of the new neurons show abnormal morphology and integration, but whether adult-generated DGCs contribute to the development of epilepsy is controversial. We examined the synaptic inputs of age-defined populations of DGCs using electrophysiological recordings and fluorescent retroviral reporter birthdating. DGCs generated neonatally were compared with those generated in adulthood, and adult-born (AB) neurons with normal versus aberrant morphology or integration were examined. We found that AB, ectopically located DGCs exhibit the most pro-excitatory physiological changes, implicating this population in seizure generation or progression.

Keywords: adult neurogenesis; dentate granule cell; epileptogenesis; hippocampus; retroviral birth dating; temporal lobe epilepsy.


Figures

Figure 1.
Figure 1.
Examples and schematic of experimental DGC recordings. A, Timeline of experimental protocol. EB cells were labeled at P7; AB cells were labeled at P60. All rats received SE or sham treatment at P56 and recordings were made between three and six months later (at P150–P240) to allow development of spontaneous recurrent seizures in pilocarpine-treated rats. An IR-DIC image of a patch-clamped DGC with GFP epifluorescence overlay and an example of biocytin staining are shown. B, Schematic diagram of the location for all DGCs that were recorded in each experimental category. GCL, granule cell layer. C, Representative images of biocytin-filled DGCs for each morphological category (i: normotopic morphology; ii, iii: ectopic location; iv: HBD+ morphology). Note that all images are from SE tissue. D, Confocal images of immunofluorescence double labeling of the dentate gyrus two months after pilocarpine treatment. In the left panel, GFP-labeled (green) hilar ectopic DGCs co-express Prox1 (red; the yellow arrows in inset denote double-labeled cells). In the right panel, GFP-labeled hilar ectopic DGCs do not co-express GABA (red). Cell nuclei are labeled with Hoechst (blue). Scale bar in D = 30 μm (C) 100 μm (D) 50 μm (D, insets).
Figure 2.
Figure 2.
sEPSCs and sIPSCs recorded from EB DGCs. Top insets, Representative traces are shown for sEPSCs (top left) and sIPSCs (top right) from EB sham (black) and SE-treated (gray) rats. A, Cumulative histograms show the amplitude of sEPSCs (A1) and sIPSCs (A2) recorded from DGCs in EB sham (black) and SE (gray) groups. Insets show the median amplitude from each cell recorded in that group. A3, The ratio of the sEPSC-to-sIPSC amplitude was calculated using the average of the median amplitude from each cell recorded in each group; error was propagated mathematically from the variance of individual recordings. B, Cumulative histogram shows the instantaneous frequency of sEPSCs (B1) and sIPSCs (B2) recorded from DGCs in the EB sham (black) and SE (gray) groups. Insets show the median instantaneous frequency from each cell recorded in that group. B3, The ratio of the sEPSC-to-sIPSC instantaneous frequency was calculated using the average of the median amplitude from each cell recorded in each group; error was propagated mathematically from the variance of individual recordings. C, Total charge transfer, calculated as the sum of the charge transfer for each individual event over the entire 5-min recording period, is shown for each cell from each group for sEPSCs (C1) and sIPSCs (C2). C3, The ratio of the sEPSC-to-sIPSC total charge transfer was calculated using the average of the cells recorded in each group; error is SEM. Hash signs in A1, A2 and B1, B2 denote Cohen's d effect size by group comparison (black vs gray) and magnitude (# = negligible/minimal; ## = moderate; ### = major). Asterisks denote statistical significance: *p < 0.05, ****p < 0.0001.
Figure 3.
Figure 3.
sEPSCs and sIPSCs recorded from AB DGCs. Top insets, Representative traces are shown for sEPSCs (top left) and sIPSCs (top right) from AB DGCs in sham (blue) and AB normotopic (red) or aberrant (orange) DGCs in SE-treated rats. A, Cumulative histogram shows the amplitude of sEPSCs (A1) and sIPSCs (A2) recorded from DGCs in the AB sham (blue), SE normotopic (norm, red), and SE aberrant (orange) groups. Insets show the median amplitude from each cell recorded in that group. A3, The ratio of the sEPSC-to-sIPSC amplitude was calculated using the average of the median amplitude from each cell recorded in each group; error was propagated mathematically from the variance of individual recordings. B, Cumulative histogram of sEPSC (B1) and sIPSC (B2) instantaneous frequency recorded from DGCs in the AB sham (blue), SE normotopic (red), and SE aberrant (orange) groups. Insets show the median instantaneous frequency from each cell recorded in that group. B3, The ratio of the sEPSC-to-sIPSC instantaneous frequency was calculated using the average of the median amplitude from each cell recorded in each group; error was propagated mathematically from the variance of individual recordings. C, Total charge transfer, calculated as the sum of the charge transfer for each individual event over the entire 5-min recording period, is shown for each cell from each group for sEPSCs (C1) and sIPSCs (C2). C3, The ratio of the sEPSC-to-sIPSC total charge transfer was calculated using the average of the cells recorded in each group; error is SEM. Hash signs in A1, A2 and B1, B2 denote Cohen's d effect size by group comparison (color) and magnitude (# = negligible/minimal; ## = moderate; ### = major). Asterisks denote statistical significance: *p < 0.05, **p < 0.01, ***p < 0.001, ****p < 0.0001.
Figure 4.
Figure 4.
sEPSCs and sIPSCs recorded from aberrant AB DGCs. Top insets, Representative traces are shown for sEPSCs (top left) and sIPSCs (top right) from AB SE ectopic (light brown) or AB SE HBD+ (dark brown) DGCs. A, Cumulative histogram shows the amplitude of sEPSCs (A1) and sIPSCs (A2) recorded from DGCs in the AB SE ectopic (ect, light brown) and SE HBD+ (dark brown) groups, as well as the AB SE normotopic group (norm, dashed red). Insets show the median amplitude from each cell recorded in that group. A3, The ratio of the sEPSC-to-sIPSC amplitude was calculated using the average of the median amplitude from each cell recorded in each group; error was propagated mathematically from the variance of individual recordings. B, Cumulative histogram shows the instantaneous frequency of sEPSCs (B1) and sIPSCs (B2) recorded from DGCs in the AB SE ectopic (light brown) and AB SE HBD+ (dark brown) groups, as well as the AB SE normotopic group (dashed red). Insets show the median instantaneous frequency from each cell recorded in that group. B3, The ratio of the sEPSC-to-sIPSC instantaneous frequency was calculated using the average of the median amplitude from each cell recorded in each group; error was propagated mathematically from the variance of individual recordings. C, Total charge transfer, calculated as the sum of the charge transfer for each individual event over the entire 5-min recording period, is shown for each cell from each group for sEPSCs (C1) and sIPSCs (C2). C3, The ratio of the sEPSC-to-sIPSC total charge transfer was calculated using the average of the cells recorded in each group; error is SEM. Hash signs in A1, A2 and B1, B2 denote Cohen's d effect size by group comparison (color) and magnitude (# = negligible/minimal; ## = moderate; ### = major). Asterisks denote statistical significance: *p < 0.05, **p < 0.01, ****p < 0.0001.

References

    1. Althaus AL, Parent JM (2014) Role of adult neurogenesis in seizure-induced hippocampal remodeling and epilepsy. In: Endogenous stem cell-based brain remodeling in mammals, Ed 1 (Junier M-P, Kernie SG, eds), pp 87–104. New York, NY: Springer.
    1. Althaus AL, Sagher O, Parent JM, Murphy GG (2015) Intrinsic neurophysiological properties of hilar ectopic and normotopic dentate granule cells in human temporal lobe epilepsy and a rat model. J Neurophysiol 113:1184–1194. 10.1152/jn.00835.2014 - DOI - PMC - PubMed
    1. Bayer SA, Altman J (1974) Hippocampal development in the rat: cytogenesis and morphogenesis examined with autoradiography and low-level X-irradiation. J Comp Neurol 158:55–79. 10.1002/cne.901580105 - DOI - PubMed
    1. Benke TA, Lüthi A, Isaac JT, Collingridge GL (1998) Modulation of AMPA receptor unitary conductance by synaptic activity. Nature 393:793–797. 10.1038/31709 - DOI - PubMed
    1. Brooks-Kayal AR, Jin H, Price M, Dichter MA (1998) Developmental expression of GABA(A) receptor subunit mRNAs in individual hippocampal neurons in vitro and in vivo. J Neurochem 70:1017–1028. - PubMed

Publication types