. 2019 Aug 6;116(32):15979-15984.
doi: 10.1073/pnas.1906172116. Epub 2019 Jul 3.

Toxicity drives facilitation between 4 bacterial species

Affiliations

Toxicity drives facilitation between 4 bacterial species

Philippe Piccardi et al. Proc Natl Acad Sci U S A. .

Abstract

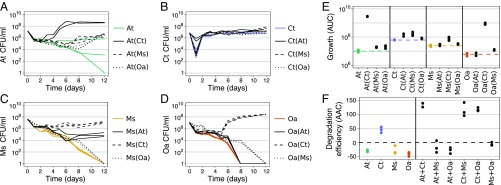
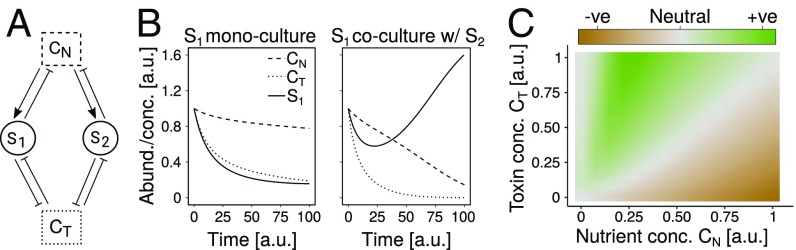
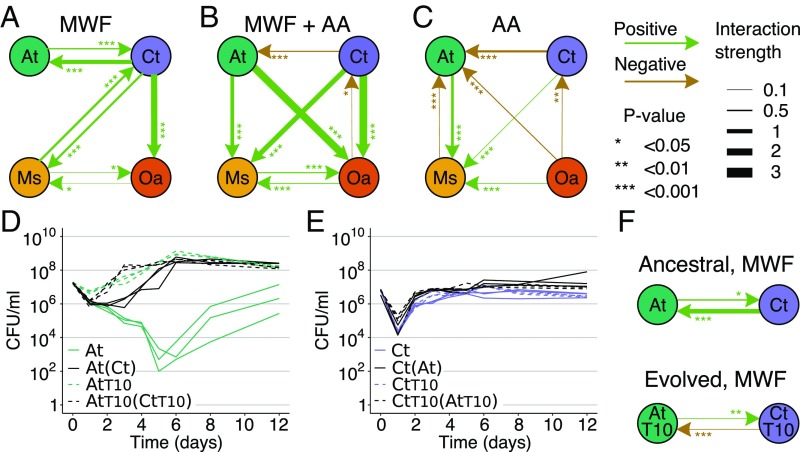
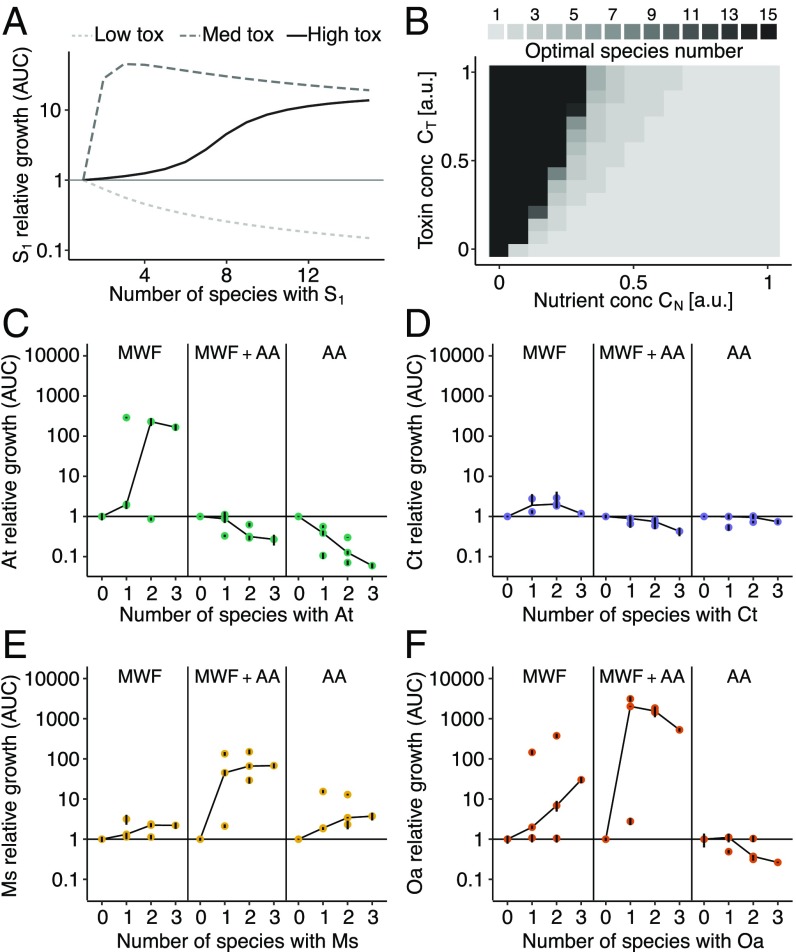
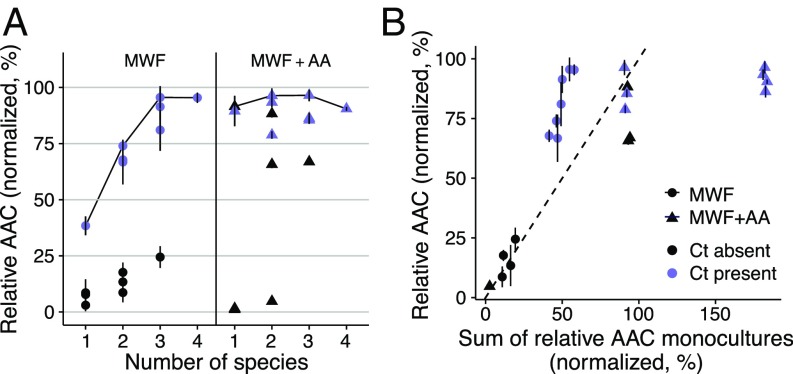
Competition between microbes is extremely common, with many investing in mechanisms to harm other strains and species. Yet positive interactions between species have also been documented. What makes species help or harm each other is currently unclear. Here, we studied the interactions between 4 bacterial species capable of degrading metal working fluids (MWF), an industrial coolant and lubricant, which contains growth substrates as well as toxic biocides. We were surprised to find only positive or neutral interactions between the 4 species. Using mathematical modeling and further experiments, we show that positive interactions in this community were likely due to the toxicity of MWF, whereby each species' detoxification benefited the others by facilitating their survival, such that they could grow and degrade MWF better when together. The addition of nutrients, the reduction of toxicity, or the addition of more species instead resulted in competitive behavior. Our work provides support to the stress gradient hypothesis by showing how harsh, toxic environments can strongly favor facilitation between microbial species and mask underlying competitive interactions.

Keywords: community function; competition; cooperation; species diversity; stress gradient hypothesis.


Conflict of interest statement

The authors declare no conflict of interest.

Figures

Fig. 1.
Fig. 1.
Comparison of mono- and pairwise cocultures. (AD) Population size quantified in colony-forming units per milliliter over time for monocultures (in color) and pairwise cocultures (in black; coculture partner indicated in brackets). In the cocultures, each species could be quantified separately by selective plating. Each panel shows the data for 1 species: (A) A. tumefaciens (At), (B) C. testosteroni (Ct), (C) M. saperdae (Ms) and (D) O. anthropi (Oa). (E) AUC in AD. Dashed lines indicate the mean of the monocultures, shown in color. Statistical significance and interaction strengths are calculated based on combined data from this and the repetition experiment (SI Appendix, Fig. S1), and shown in Fig. 3 and Dataset S1. (F) AAC describing the decrease in COD (see Materials and Methods) (i.e., degradation efficiency; SI Appendix, Fig. S6 A and B). Negative AAC values arise because dead cells increase the COD (SI Appendix, Fig. S7). AUC (E) and AAC (F) correlate positively (SI Appendix, Fig. S4).
Fig. 2.
Fig. 2.
(A) In our mathematical model, species S1 and S2 share a substrate containing nutrients and toxins at concentrations CN and CT. The species take up the same nutrients, and invest a fraction of these into toxin degradation and the rest into population growth. Toxins cause cell death and population decline. (B) Example results of the model (parameters in SI Appendix, Table S3), shown as the abundance of species S1 (solid line) and concentrations of nutrients and toxins (dashed and dotted lines, respectively). In monoculture, S1 goes extinct due to toxins (Left), but survives in coculture with S2 (Right). (C) The response of one species to the presence of another is measured as the difference in AUC between the coculture and monoculture (color and parameters in SI Appendix, Table S3) and shown as a function of nutrient and toxin concentrations. At high toxin concentrations and intermediate nutrients, interactions are positive (+ve) due to the joint degradation of toxins (as in B). As nutrients are increased or toxins decreased, competition for limited resources dominates (-ve, short for “negative”).
Fig. 3.
Fig. 3.
Pairwise interaction networks under different environmental conditions. Positive/negative interactions indicate that the species at the end of an arrow grew significantly better/worse in the presence of the species at the beginning of the arrow in (A) MWF, (B) MWF + AA, and (C) AA medium. Arrow thickness represents interaction strength as the 10-fold change in the coculture AUCs compared with monoculture AUCs, i.e., by how many orders of magnitude a species changed the AUC of another. Statistical significance and interaction strengths were calculated based on 2 experiments in A (data in Fig. 1 and SI Appendix, Fig. S1), and 1 experiment in B (SI Appendix, Fig. S9) and C (SI Appendix, Fig. S8). P values and interaction strengths are listed in Dataset S1. (D) Monoculture and coculture growth curves of ancestral At and (E) Ct versus the same strains evolved in monoculture for 10 wk (AtT10, CtT10). Coculture partners are indicated in brackets. (F) Interactions between ancestral and evolved At and Ct strains based on growth curves in D and E. Arrow widths and asterisks are as defined for AC. The interactions between At and Ct in A and F have different strengths and P values because they come from different experimental repeats.
Fig. 4.
Fig. 4.
(A) Our model predicts that, for a focal strain S1, an increasing community size eventually becomes detrimental. The number at which such competition starts depends on environmental toxicity. (B) The optimal number of species with respect to the AUC of a focal strain (peak in A) varies with nutrient and toxin concentrations. (CF) Each species’ growth expressed in fold change in its AUC divided by its mean monoculture AUC in the 3 different media. Each point shows the mean of a culture treatment composed of 1 to 4 species, and vertical black lines show standard deviations. Black lines connect the median points. In environments where a species could not grow alone, the curves are hump-shaped, while, in more benign environments, species grow less well in the presence of others.
Fig. 5.
Fig. 5.
Degradation efficiency as a function of species number. (A) AAC of COD (see Materials and Methods), normalized to values between 0 and 100%. Points show the mean of a culture treatment composed of 1 to 4 species, and vertical lines show standard deviations. Blue (or black) points show cultures where C. testosteroni was present (or absent). Cultures growing on MWF (Left) only reach their maximum degradation potential once 3 species are present (see black line connecting the maximum mean values). In MWF + AA (Right), even single species can degrade as efficiently as the best cultures. In a more benign environment, there is less need for a diverse community. (B) Prediction of an additive model of the sum of degradation efficiencies of individual species is plotted against degradation efficiency of the cocultures in both growth media. Data points are identical to >1 species in A. In MWF, cocultures are more efficient than the sum of the corresponding monocultures (most points above dashed line), while, in MWF + AA, they are equally or less efficient (most triangles below the dashed line). The presence of C. testosteroni explains much of the AAC in A and B.

Comment in

References

    1. Widder S., et al. , Challenges in microbial ecology: Building predictive understanding of community function and dynamics. ISME J. 10, 2557–2568 (2016). - PMC - PubMed
    1. De Roy K., Marzorati M., Van den Abbeele P., Van de Wiele T., Boon N., Synthetic microbial ecosystems: An exciting tool to understand and apply microbial communities. Environ. Microbiol. 16, 1472–1481 (2014). - PubMed
    1. Dolinšek J., Goldschmidt F., Johnson D. R., Synthetic microbial ecology and the dynamic interplay between microbial genotypes. FEMS Microbiol. Rev. 40, 961–979 (2016). - PubMed
    1. Atashgahi S., et al. , Prospects for harnessing biocide resistance for bioremediation and detoxification. Science 360, 743–746 (2018). - PubMed
    1. West S. A., Griffin A. S., Gardner A. S., Diggle S. P., Social evolution theory for microorganisms. Nat. Rev. Microbiol. 4, 597–607 (2006). - PubMed

Publication types