. 2019 Jul 3;11(499):eaav4634.
doi: 10.1126/scitranslmed.aav4634.

CFTR-PTEN-dependent mitochondrial metabolic dysfunction promotes Pseudomonas aeruginosa airway infection

Affiliations

CFTR-PTEN-dependent mitochondrial metabolic dysfunction promotes Pseudomonas aeruginosa airway infection

Sebastián A Riquelme et al. Sci Transl Med. .

Abstract

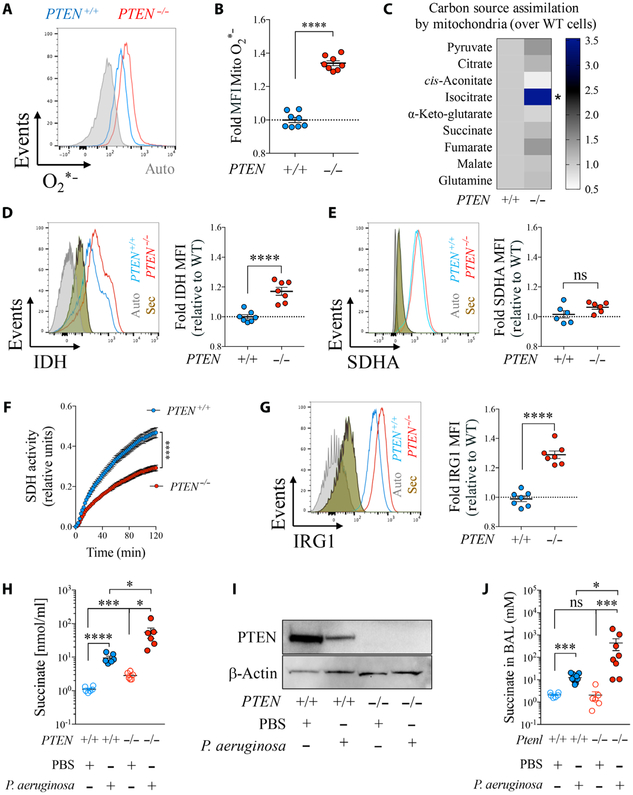
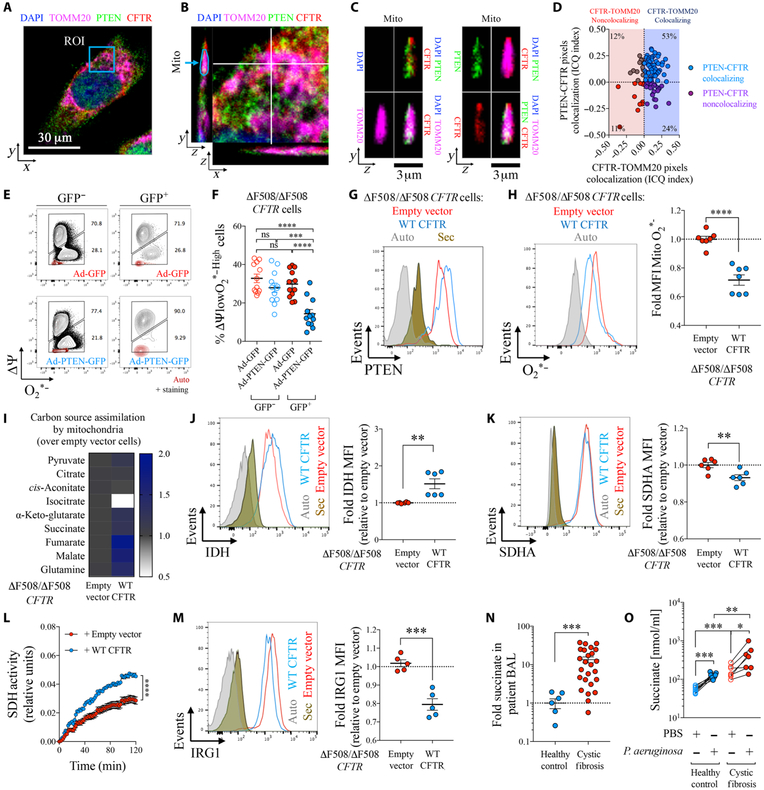
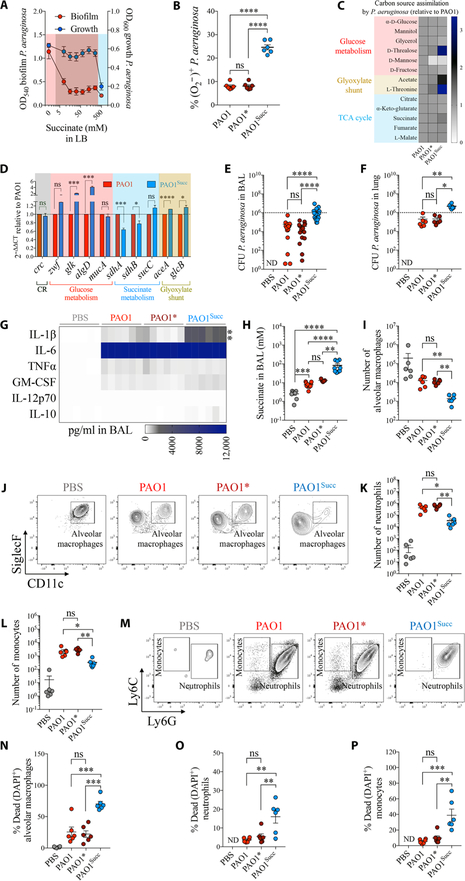
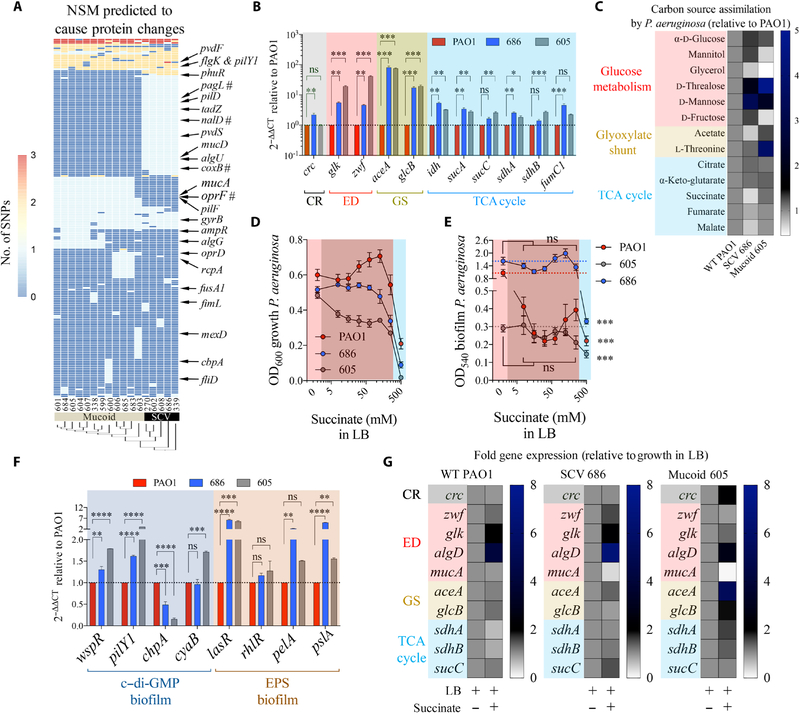
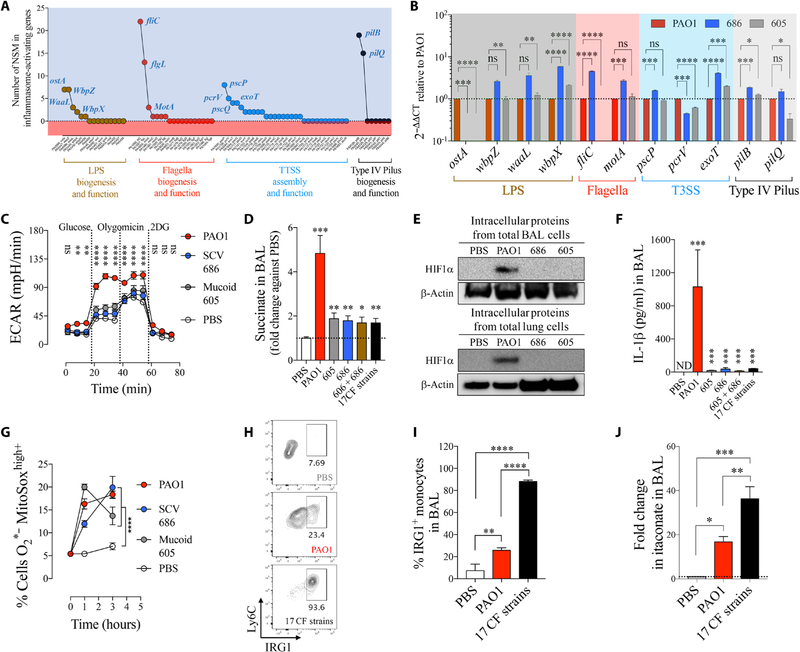
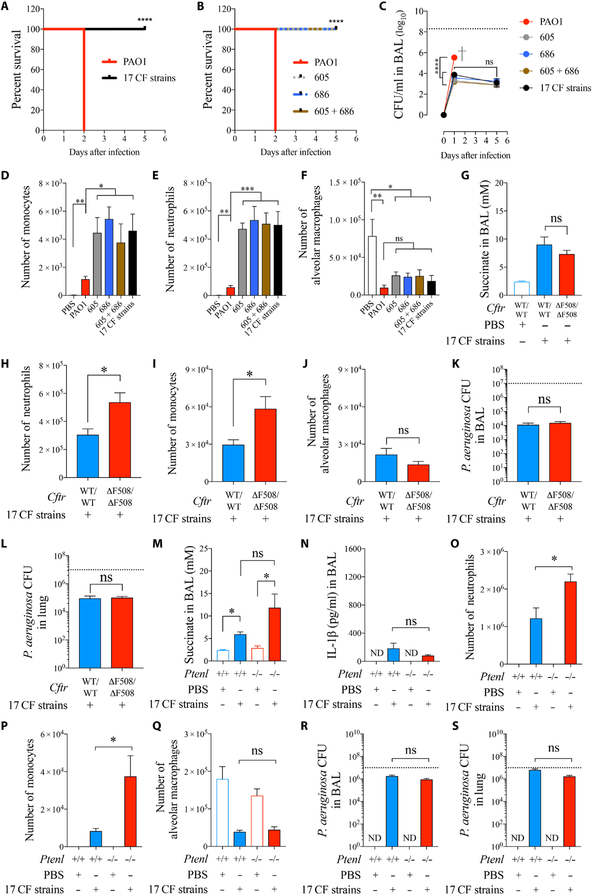
Phosphatase and tensin homolog deleted on chromosome 10 (PTEN) is a tumor suppressor best known for regulating cell proliferation and metabolism. PTEN forms a complex with the cystic fibrosis (CF) transmembrane conductance regulator (CFTR) at the plasma membrane, and this complex is known to be functionally impaired in CF. Here, we demonstrated that the combined effect of PTEN and CFTR dysfunction stimulates mitochondrial activity, resulting in excessive release of succinate and reactive oxygen species. This environment promoted the colonization of the airway by Pseudomonas aeruginosa, bacteria that preferentially metabolize succinate, and stimulated an anti-inflammatory host response dominated by immune-responsive gene 1 (IRG1) and itaconate. The recruitment of myeloid cells induced by these strains was inefficient in clearing the infection and increased numbers of phagocytes accumulated under CFTR-PTEN axis dysfunction. This central metabolic defect in mitochondrial function due to impaired PTEN activity contributes to P. aeruginosa infection in CF.


Conflict of interest statement

Competing interests: The authors declare that they have no competing interests.

Figures

Fig. 1.
Fig. 1.. PTEN regulates the ROS-IRG1-succinate mitochondrial axis.
(A to I) PTEN+/+ and PTEN−/− HTC116 human epithelial cells were analyzed for (A and B) mitochondrial O2* production (n = 3). (C) Assimilation by mitochondria of different carbon sources that feed the TCA cycle (n = 6). (D and E) Intracellular IDH and SDHA (n = 3). (F) Total SDH activity in protein extracts (n = 3). (G) Intracellular IRG1 (n = 3). (H) Succinate in the supernatant of cells infected or not with P. aeruginosa (n = 3). (I) PTEN expression before and after infection with P. aeruginosa (PAO1). (J) Succinate in the airway fluid of WT or PTEN-long–deficient mice (Ptenl−/−) infected for 24 hours or not with P. aeruginosa (6 to 11 mice per group pooled from n = 3). Autofluorescence (gray) and secondary antibody staining alone (brown) for flow cytometry are shown in histograms. Data are shown as mean ± SEM. (B), (D), (E), and (G) were analyzed by Student’s t test; (F) was analyzed by two-way analysis of variance (ANOVA); and (H) and (J) were analyzed by one-way ANOVA. ****P < 0.0001; ***P < 0.001; *P < 0.05; ns, nonsignificant. MFI, mean fluorescence intensity.
Fig. 2.
Fig. 2.. PTEN correction in dysfunctional CF mitochondria restores the ROS-IRG1-succinate balance.
(A) A 16HBE epithelial cell stained by confocal microscopy for PTEN (green), CFTR (red), TOMM20 (magenta), and nuclei (blue). One random focal plane is shown. ROI, region of interest. (B) Zoom-in view of ROI shown in (A). A focal plane was analyzed in the (y, z) and (x, z) dimensions. “Mito” corresponds to a random mitochondrion captured in the (y, z) focal plane. (C) Zoom-in view on the mitochondrion from (B). Combined color channels are shown. (D) Colocalization between CFTR and TOMM20 (x axis) and PTEN and CFTR (y axis) inside mitochondria as in (B). Co-localization was measured by Intensity Correlation Quotient (ICQ) for at least 100 mitochondria from at least n = 5 different cells. (E and F) Percentage of ΔΨlowO2*−High in human ΔF508/ΔF508 CFTR cells infected with a PTEN-GFP or GFP-coding adenovirus (Ad). Transduced (GFP+) or nontransduced (GFP) cells are shown (n = 3). (G to M) ΔF508/ΔF508 CFTR cells corrected with a WT CFTR–expressing lentivirus or treated with an empty vector were analyzed for (G) intracellular PTEN, (H) mitochondrial ROS (O2*) (n = 3), (I) mitochondrial assimilation of specific TCA cycle intermediates (n = 6), (J and K) intracellular IDH and SDHA (n = 3), (L) total SDH activity in protein extracts (n = 2), and (M) intracellular IRG1(n = 3). (N) Fold change in succinate in CF relative to control airways (n = 7 for HP and n = 25 for CF). (O) Succinate in supernatants of PBMCs from CF or controls with or without P. aeruginosa infection (n = 7 to 9). Histograms show autofluorescence (gray) and staining with secondary antibody alone (brown) for flow cytometry. Data are shown as means ± SEM. (H), (J), (K), (M), and (N) were analyzed by Student’s t test; (L) was analyzed by two-way ANOVA; and (F) and (O) were analyzed by one-way ANOVA. ****P < 0.0001; ***P < 0.001; **P < 0.01; *P < 0.05.
Fig. 3.
Fig. 3.. Succinate promotes metabolic adaptation of P. aeruginosa and airway infection.
(A) Growth and biofilm of WT P. aeruginosa (PAO1) in increasing concentrations of succinate in LB media (n = 3). Pink, no succinate; red, 50 to 250 mM succinate; blue, 500 mM succinate. (B) Intracellular O2*2 (ROS) in P. aeruginosa by succinate (PAO1, no succinate; PAO1*, 50 mM succinate; PAO1Succ, 500 mM succinate) (n = 3). (C) Relative single-carbon source assimilation by PAO1 (control), PAO1*, and PAO1Succ (n = 3). (D) mRNA expression relative to PAO1 for different metabolic pathways (n = 3). Mice were either infected with PAO1, PAO1*, or PAO1Succ or treated with phosphate-buffered saline (PBS). Twenty-four hours later, the following were analyzed in mouse airways: (E and F) CFU found in BAL and lungs (6 to 18 mice per group pooled from n = 3), (G) heatmap of different cytokines accumulated in BAL (6 mice per group pooled from n = 3), (H) succinate accumulated in BAL (5 to 11 mice per group pooled from n = 3), (I and J) number and density plots of viable alveolar macrophages in BAL (6 mice per group pooled from n = 3), (K to M) number and density plots of viable neutrophils and monocytes in BAL (6 mice per group pooled from n = 3), and (N to P) percentage of dead cells in BAL (6 mice per group pooled from n = 3). Data are shown as means ± SEM. ****P < 0.0001; ***P < 0.001; **P < 0.01; *P < 0.05; one-way ANOVA. ND, not detected. TNFα, tumor necrosis factor–α; GM-CSF, granulocyte-macrophage colony-stimulating factor; DAPI, 4′,6-diamidino-2-phenylindole.
Fig. 4.
Fig. 4.. Metabolism of P. aeruginosa isolates is consistent with adaptation to succinate.
(A) Nonsynonymous mutations (NSM) in 17 P. aeruginosa isolates (SCV and mucoid variants) compared with PAO1 control. #: stop codon mutations. (B) Fold mRNA expression relative to PAO1 for selected metabolic genes in SCV 686 and mucoid 605 (n = 3). (C) Relative single-carbon source assimilation for PAO1, SCV 686, and mucoid 605 strains (n = 6). (D) Bacterial final point growth in increasing concentrations of succinate in LB (n = 3). (E) Bacterial biofilm in increasing concentrations of succinate in LB (n = 3). (F) Relative mRNA expression against control PAO1 by quantitative reverse transcription polymerase chain reaction (qRT-PCR) of genes that regulate c-di-GMP and EPS required to produce biofilm (n = 3). (G) Regulation of metabolic genes by succinate in P. aeruginosa SCV 686 and mucoid 605 clinical isolates (n = 3). Data are shown as means ± SEM. (B and F) One-way ANOVA; (D and E) two-way ANOVA. ****P < 0.0001; ***P < 0.001; **P < 0.01; *P < 0.05.
Fig. 5.
Fig. 5.. Succinate-adapted P. aeruginosa isolates evoke an inefficient IRG1-itaconate–mediated immune response.
(A) Number of nonsynonymous mutations found in all P. aeruginosa isolates in PAMPs known to activate the IL-1β–HIF1α–succinate axis (inflammasome). (B) Fold mRNA expression relative to PAO1 for PAMPs with the most NSM in SCV 686 and mucoid 605 (n = 3). (C) Extracellular acidification rate (ECAR) in human monocytes treated either with PBS, PAO1, SCV 686, or mucoid 605 strain. Increased ECAR is an expected response to augmented glycolysis (n = 2). (D) Fold change in succinate in airways of WT mice treated for 24 hours with PBS, PAO1, with a single or a mixture of P. aeruginosa clinical isolates (six to seven mice per group pooled from n = 3). (E) BAL and lung HIF1α levels from total intracellular protein of mice infected as in (D). (F) IL-1β in airways of mice treated as in (D) (six to seven mice per group pooled from n = 3). (G) Mitochondrial ROS in human THP-1 cell induced by PAO1 or CF P. aeruginosa isolates (n = 3). (H and I) IRG1+ monocytes (six mice per group pooled from n = 2) and (J) itaconate in BAL of PBS-, PAO1-, or 17 CF strains–treated mice (four mice per group pooled from n = 2). Data are shown as means ± SEM. (B), (D), (F), (I), and (J) were analyzed by one-way ANOVA; and (C) and (G) were analyzed by two-way ANOVA. ****P < 0.0001; ***P < 0.001; **P < 0.01; *P < 0.05.
Fig. 6.
Fig. 6.. CF P. aeruginosa isolates persist in the airway.
C57Bl/6 WT mice were intranasally infected with 107 CFUs of either PAO1, single CF isolates, a mixture of two, or all 17 strains together. (A and B) Mouse survival (five mice per group pooled from n = 2). (C) P. aeruginosa burden in BAL (four to seven mice per group pooled from n = 3). (D to F) Monocytes, neutrophils, and alveolar macrophages found in BAL 24 hours after infection (four to six mice per group pooled from n = 3). CftrΔF508/ΔF508 (gut-corrected) mice were intranasally infected with a mix of 107 CFUs of all 17 CF P. aeruginosa isolates. (G) Succinate in BAL (three to eight mice per group pooled from n = 3). (H to J) Neutrophils, monocytes, and alveolar macrophages found in BAL 48 hours after infection (eight mice per group pooled from n = 3). (K and L) P. aeruginosa burden in BAL and lungs (eight mice per group pooled from n = 3). Ptenl−/− mice were intranasally infected with a mix of 107 CFUs of all 17 CF P. aeruginosa isolates (three to six mice per group pooled from n = 3). The following were analyzed: (M) succinate in BAL; (N) IL-1β in BAL; (O to Q) monocytes, neutrophils, and alveolar macrophages found in BAL 24 hours after infection, (R and S) P. aeruginosa burden in BAL and lungs 24 hours after infection. Data are shown as means ± SEM. (A and B) Kaplan-Meier; (C) two-way ANOVA; (D to G and M to S) one-way ANOVA; (H to L) Student’s t test. ****P < 0.0001; ***P < 0.001; **P < 0.01; *P < 0.05.

Comment in

References

    1. Luciani A, Villella VR, Esposito S, Brunetti-Pierri N, Medina D, Settembre C, Gavina M, Pulze L, Giardino I, Pettoello-Mantovani M, D’Apolito M, Guido S, Masliah E, Spencer B, Quaratino S, Raia V, Ballabio A, Maiuri L, Defective CFTR induces aggresome formation and lung inflammation in cystic fibrosis through ROS-mediated autophagy inhibition. Nat. Cell Biol 12, 863–875 (2010). - PubMed
    1. Elborn JS, Cystic fibrosis. Lancet 388, 2519–2531 (2016). - PubMed
    1. Riquelme SA, Hopkins BD, Wolfe AL, DiMango E, Kitur K, Parsons R, Prince A, Cystic fibrosis transmembrane conductance regulator attaches tumor suppressor PTEN to the Membrane and Promotes Anti Pseudomonas aeruginosa immunity. Immunity 47, 1169–1181.e7 (2017). - PMC - PubMed
    1. Ortega-Molina A, Serrano M, PTEN in cancer, metabolism, and aging. Trends Endocrinol. Metab 24, 184–189 (2013). - PMC - PubMed
    1. Blouin M-J, Zhao Y, Zakikhani M, Algire C, Piura E, Pollak M, Loss of function of PTEN alters the relationship between glucose concentration and cell proliferation, increases glycolysis, and sensitizes cells to 2-deoxyglucose. Cancer Lett 289, 246–253 (2010). - PubMed

Publication types

MeSH terms

LinkOut - more resources