. 2019 Jul 3;11(499):eaau9240.
doi: 10.1126/scitranslmed.aau9240.

Agonism of CD11b reprograms innate immunity to sensitize pancreatic cancer to immunotherapies

Affiliations

Agonism of CD11b reprograms innate immunity to sensitize pancreatic cancer to immunotherapies

Roheena Z Panni et al. Sci Transl Med. .

Abstract

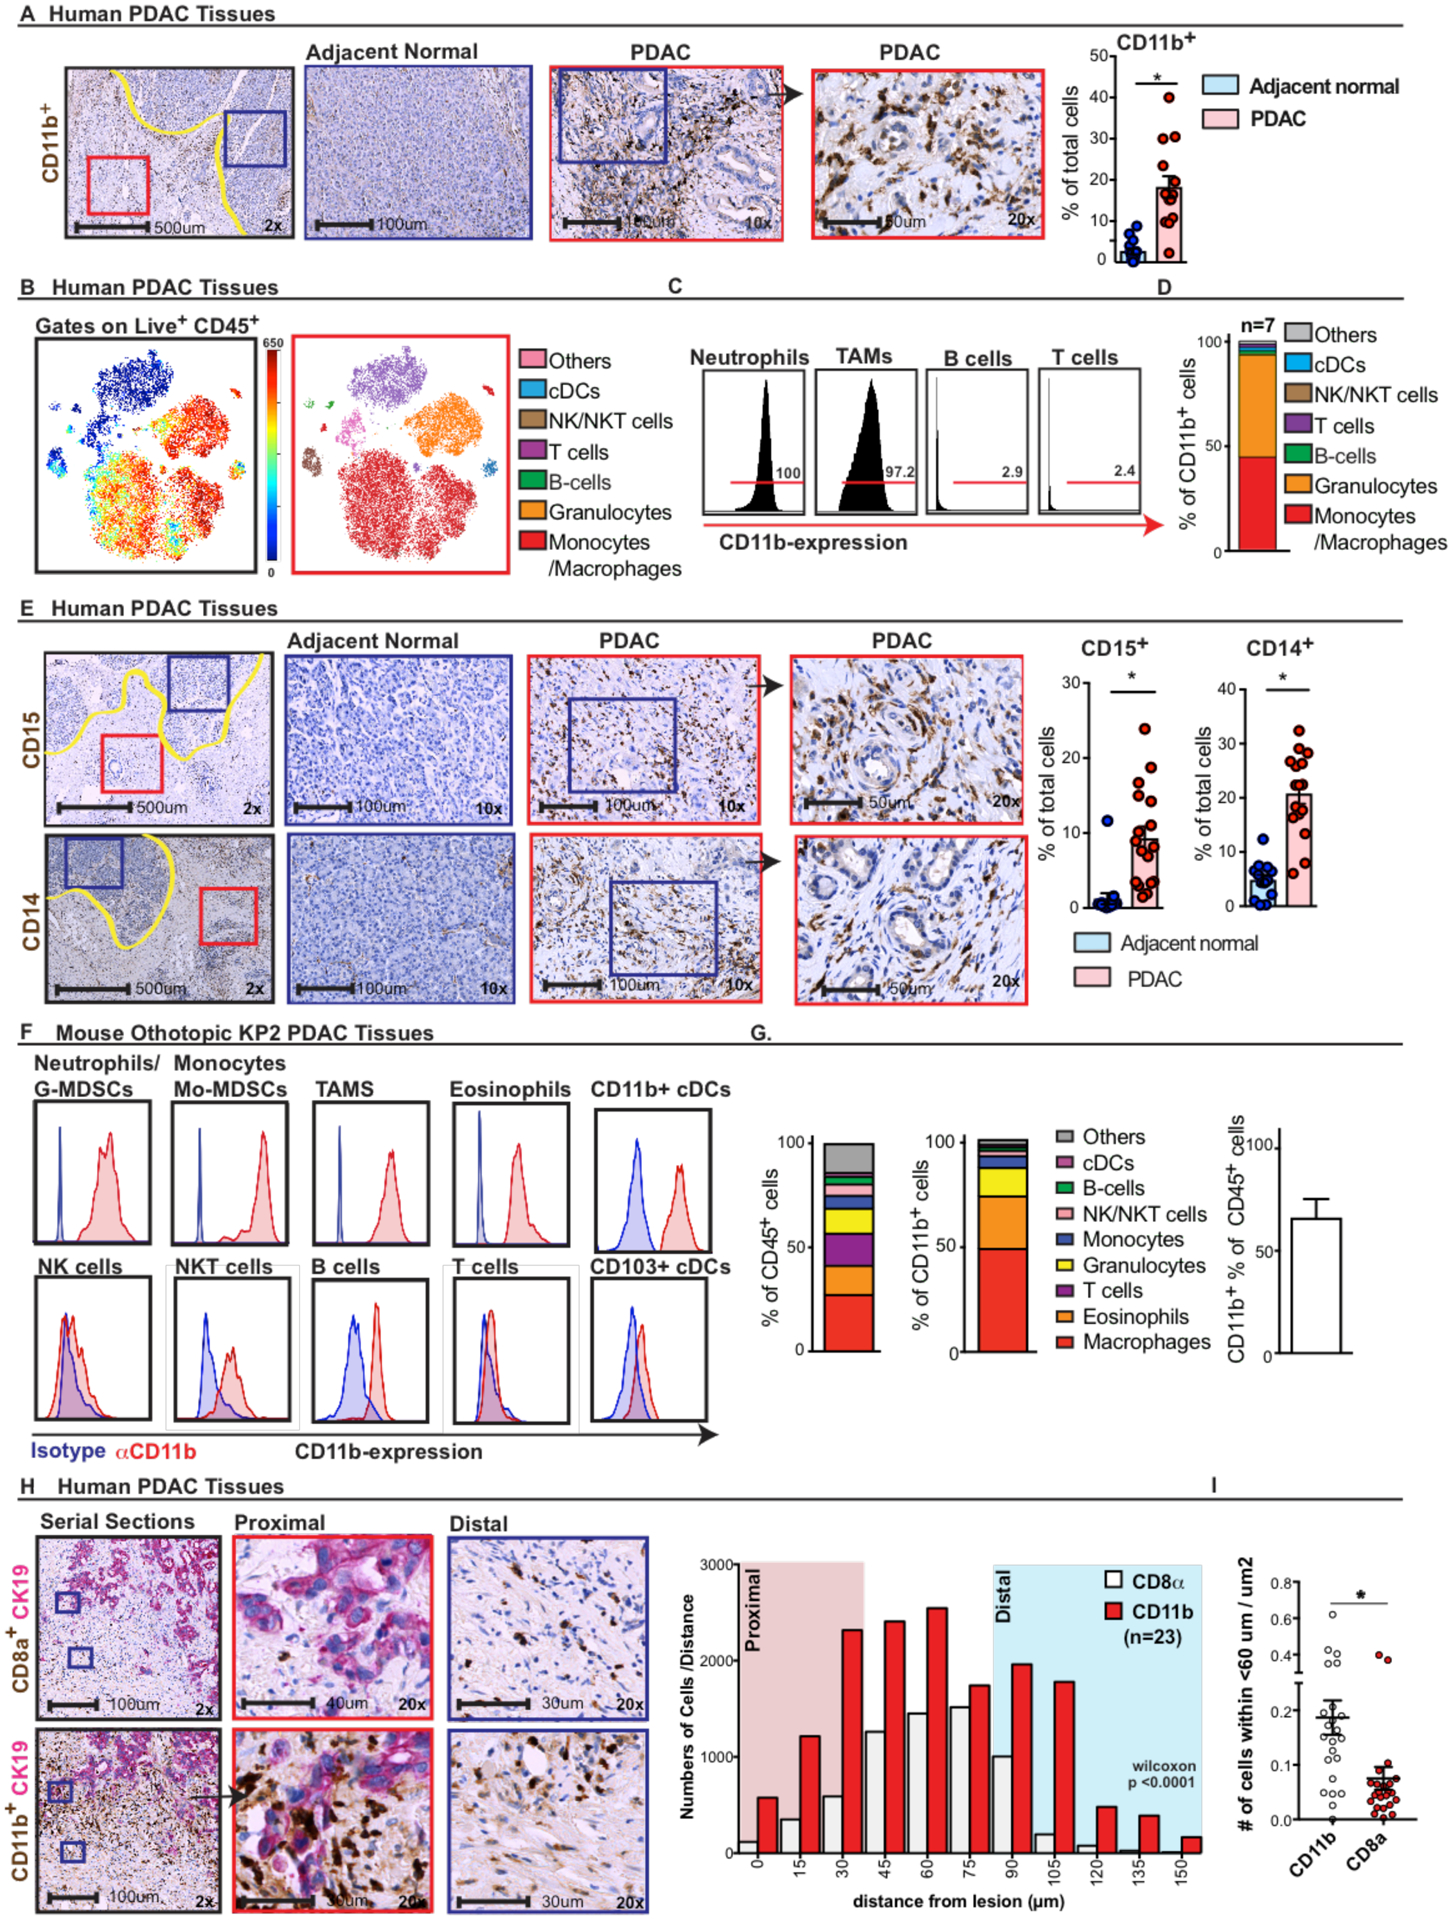
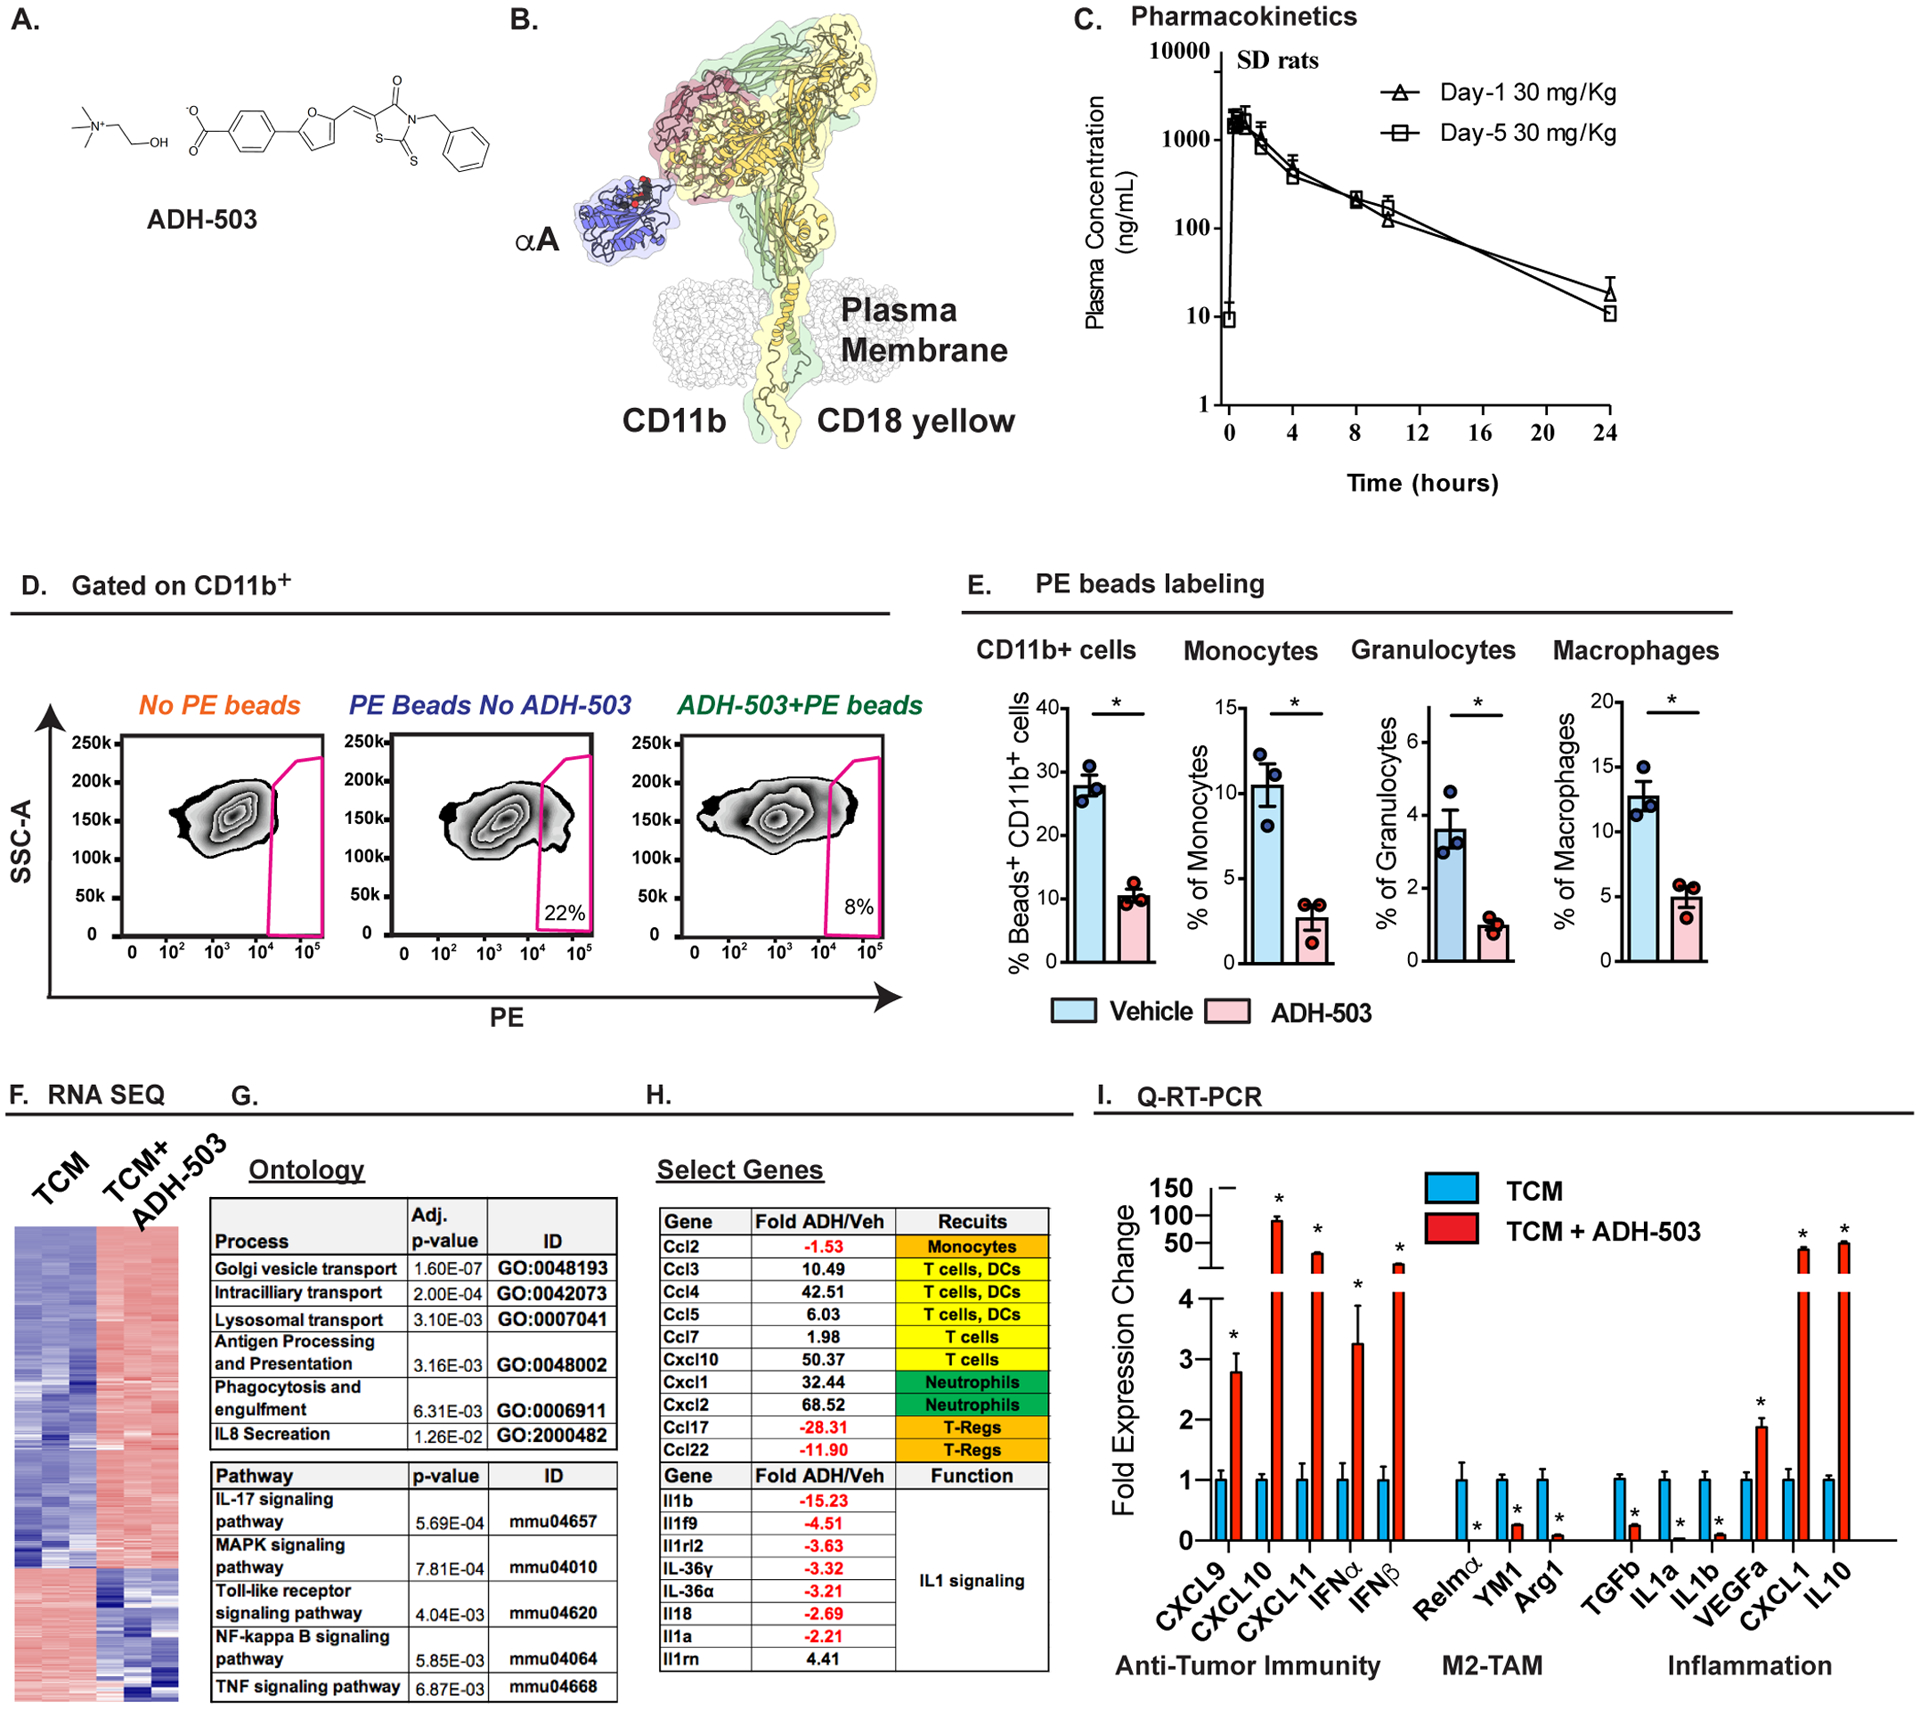
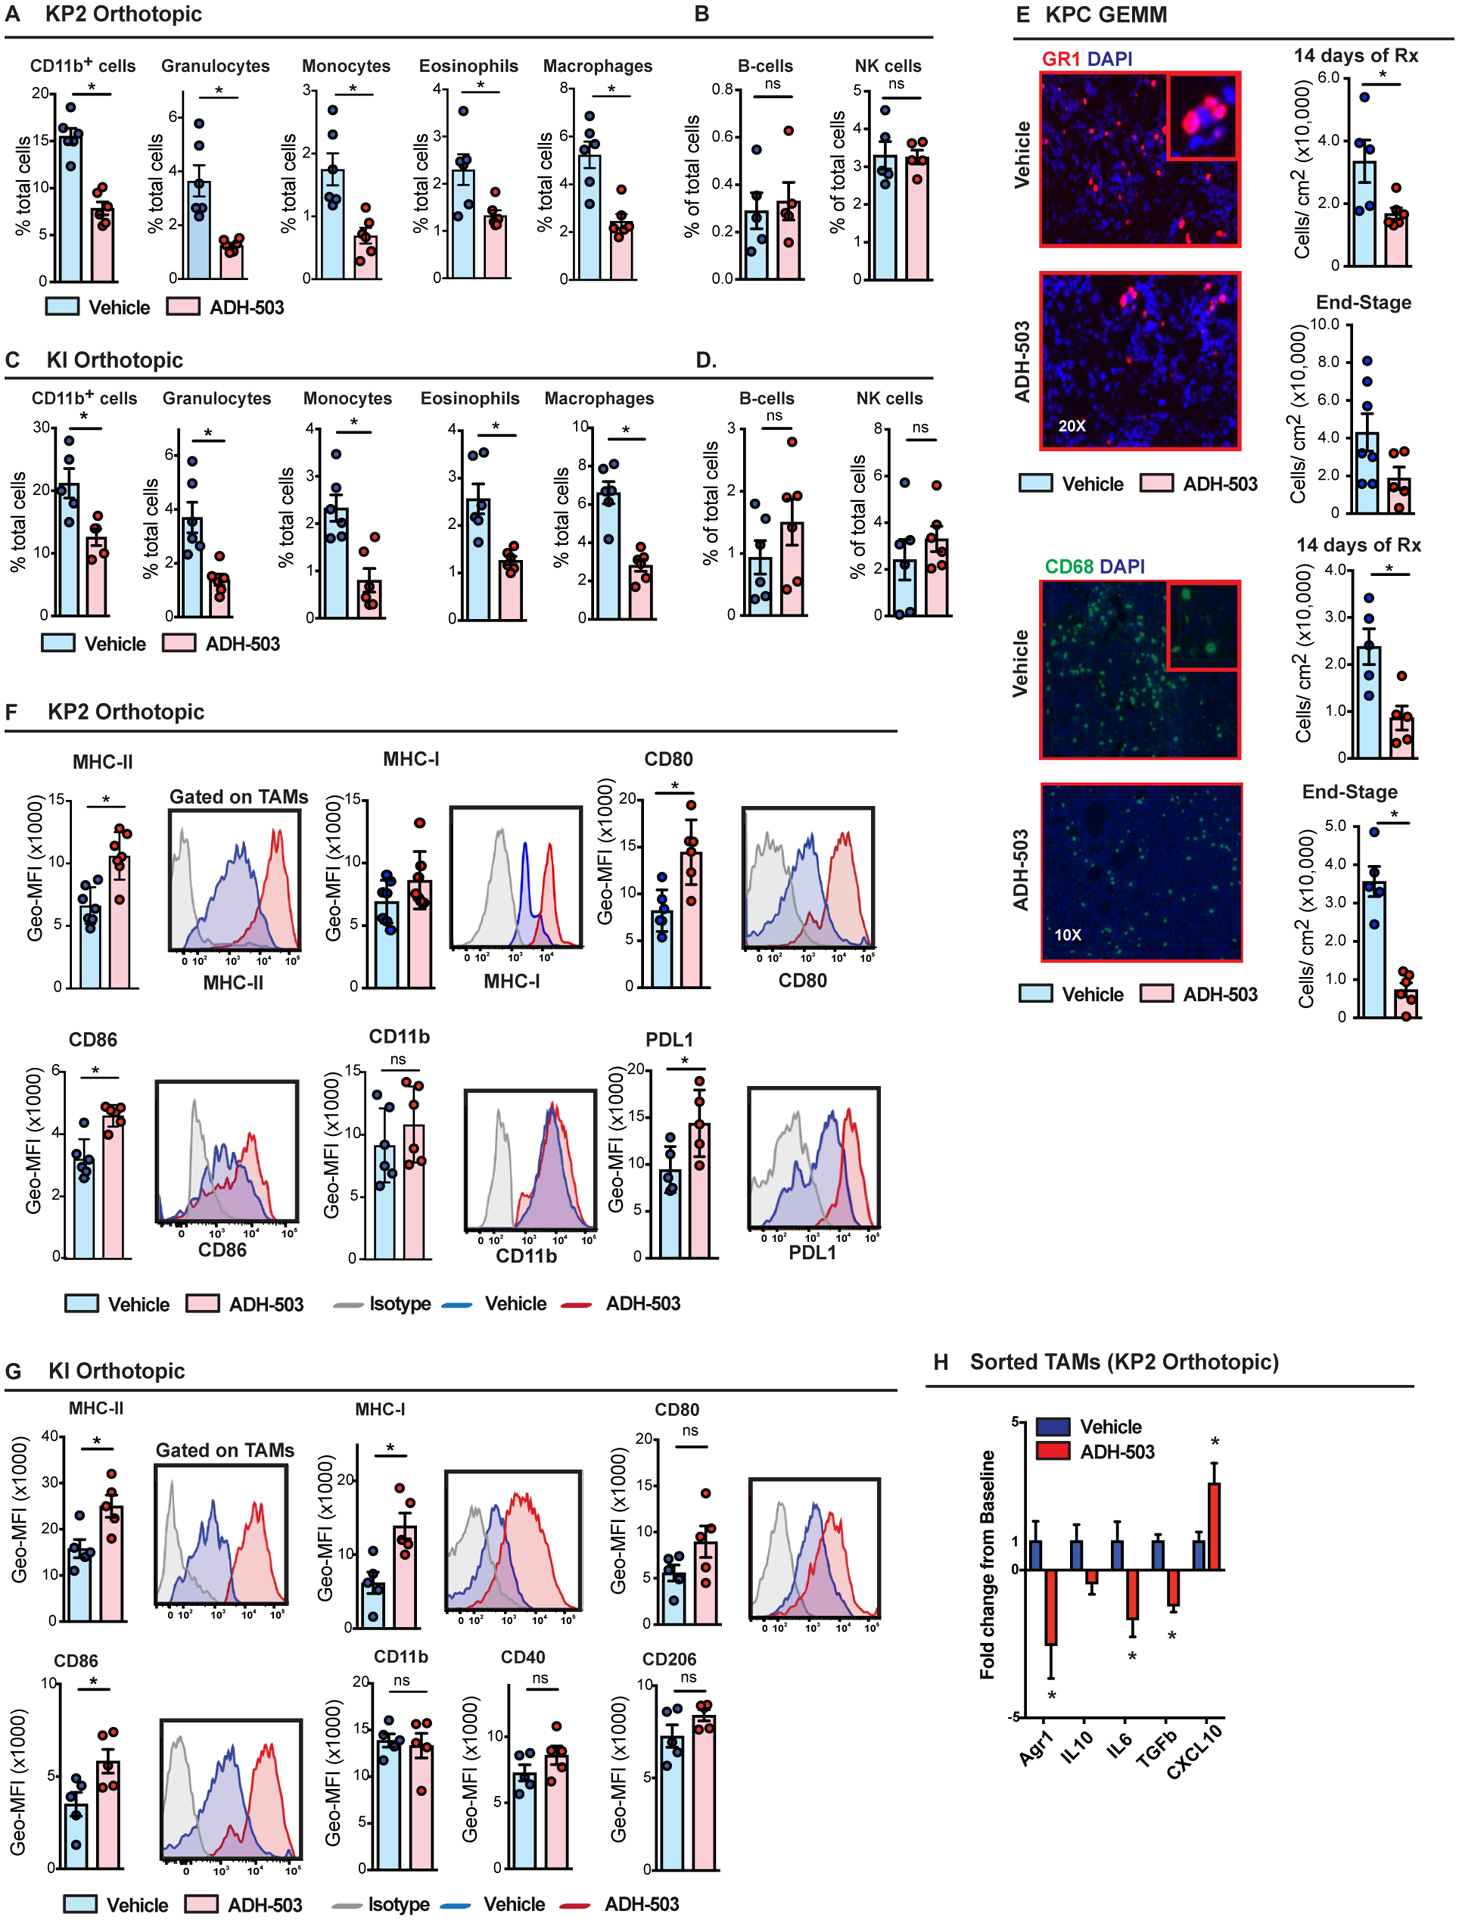
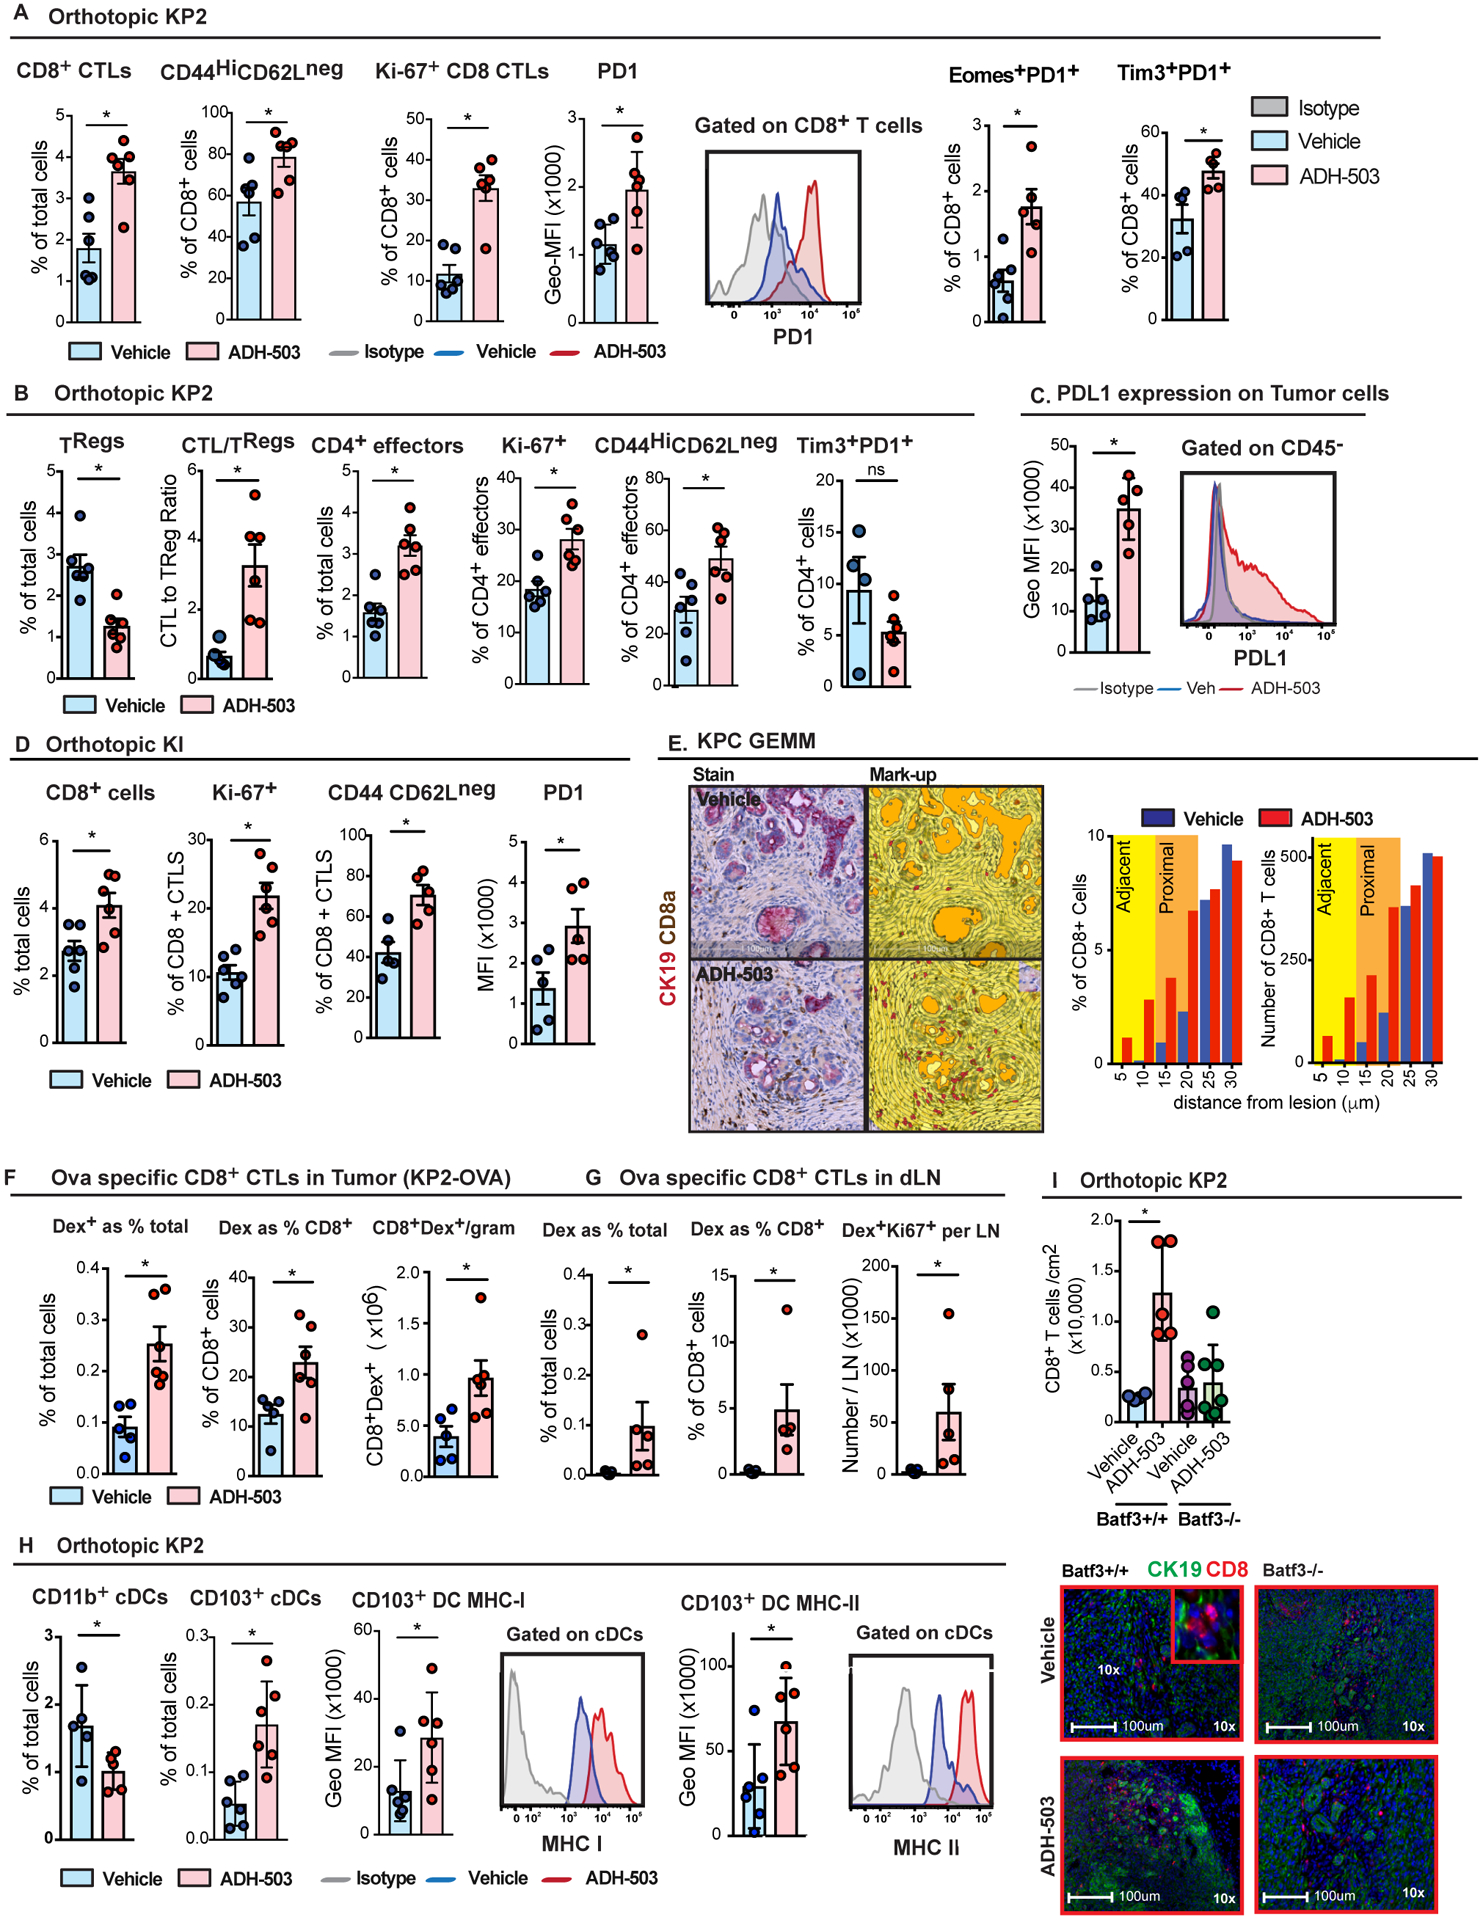
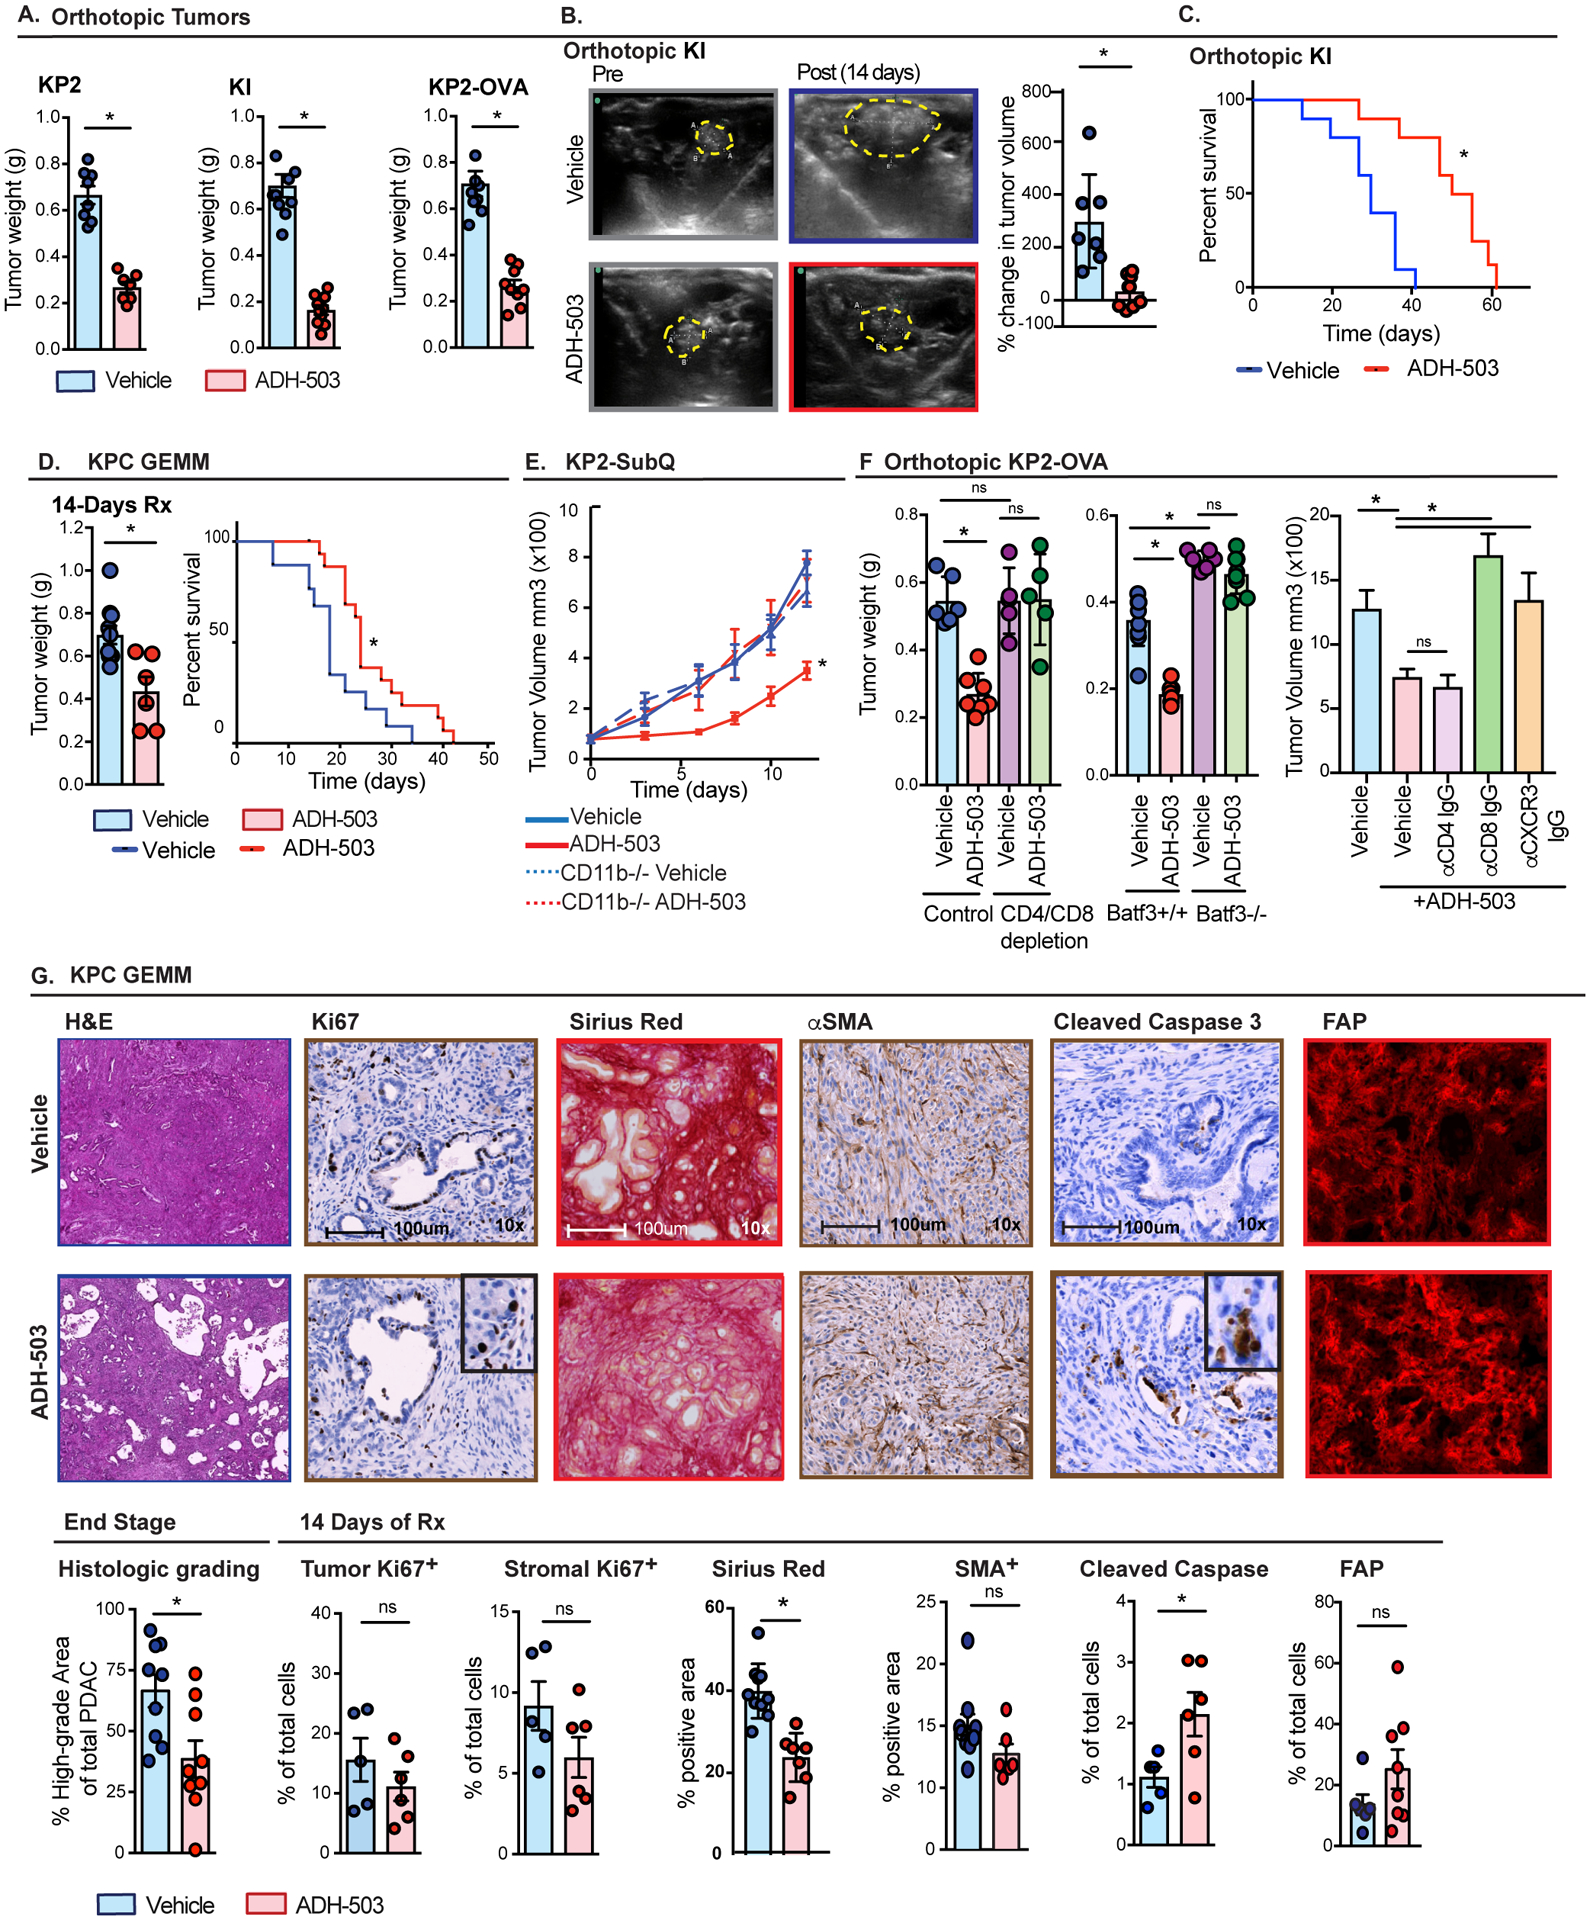
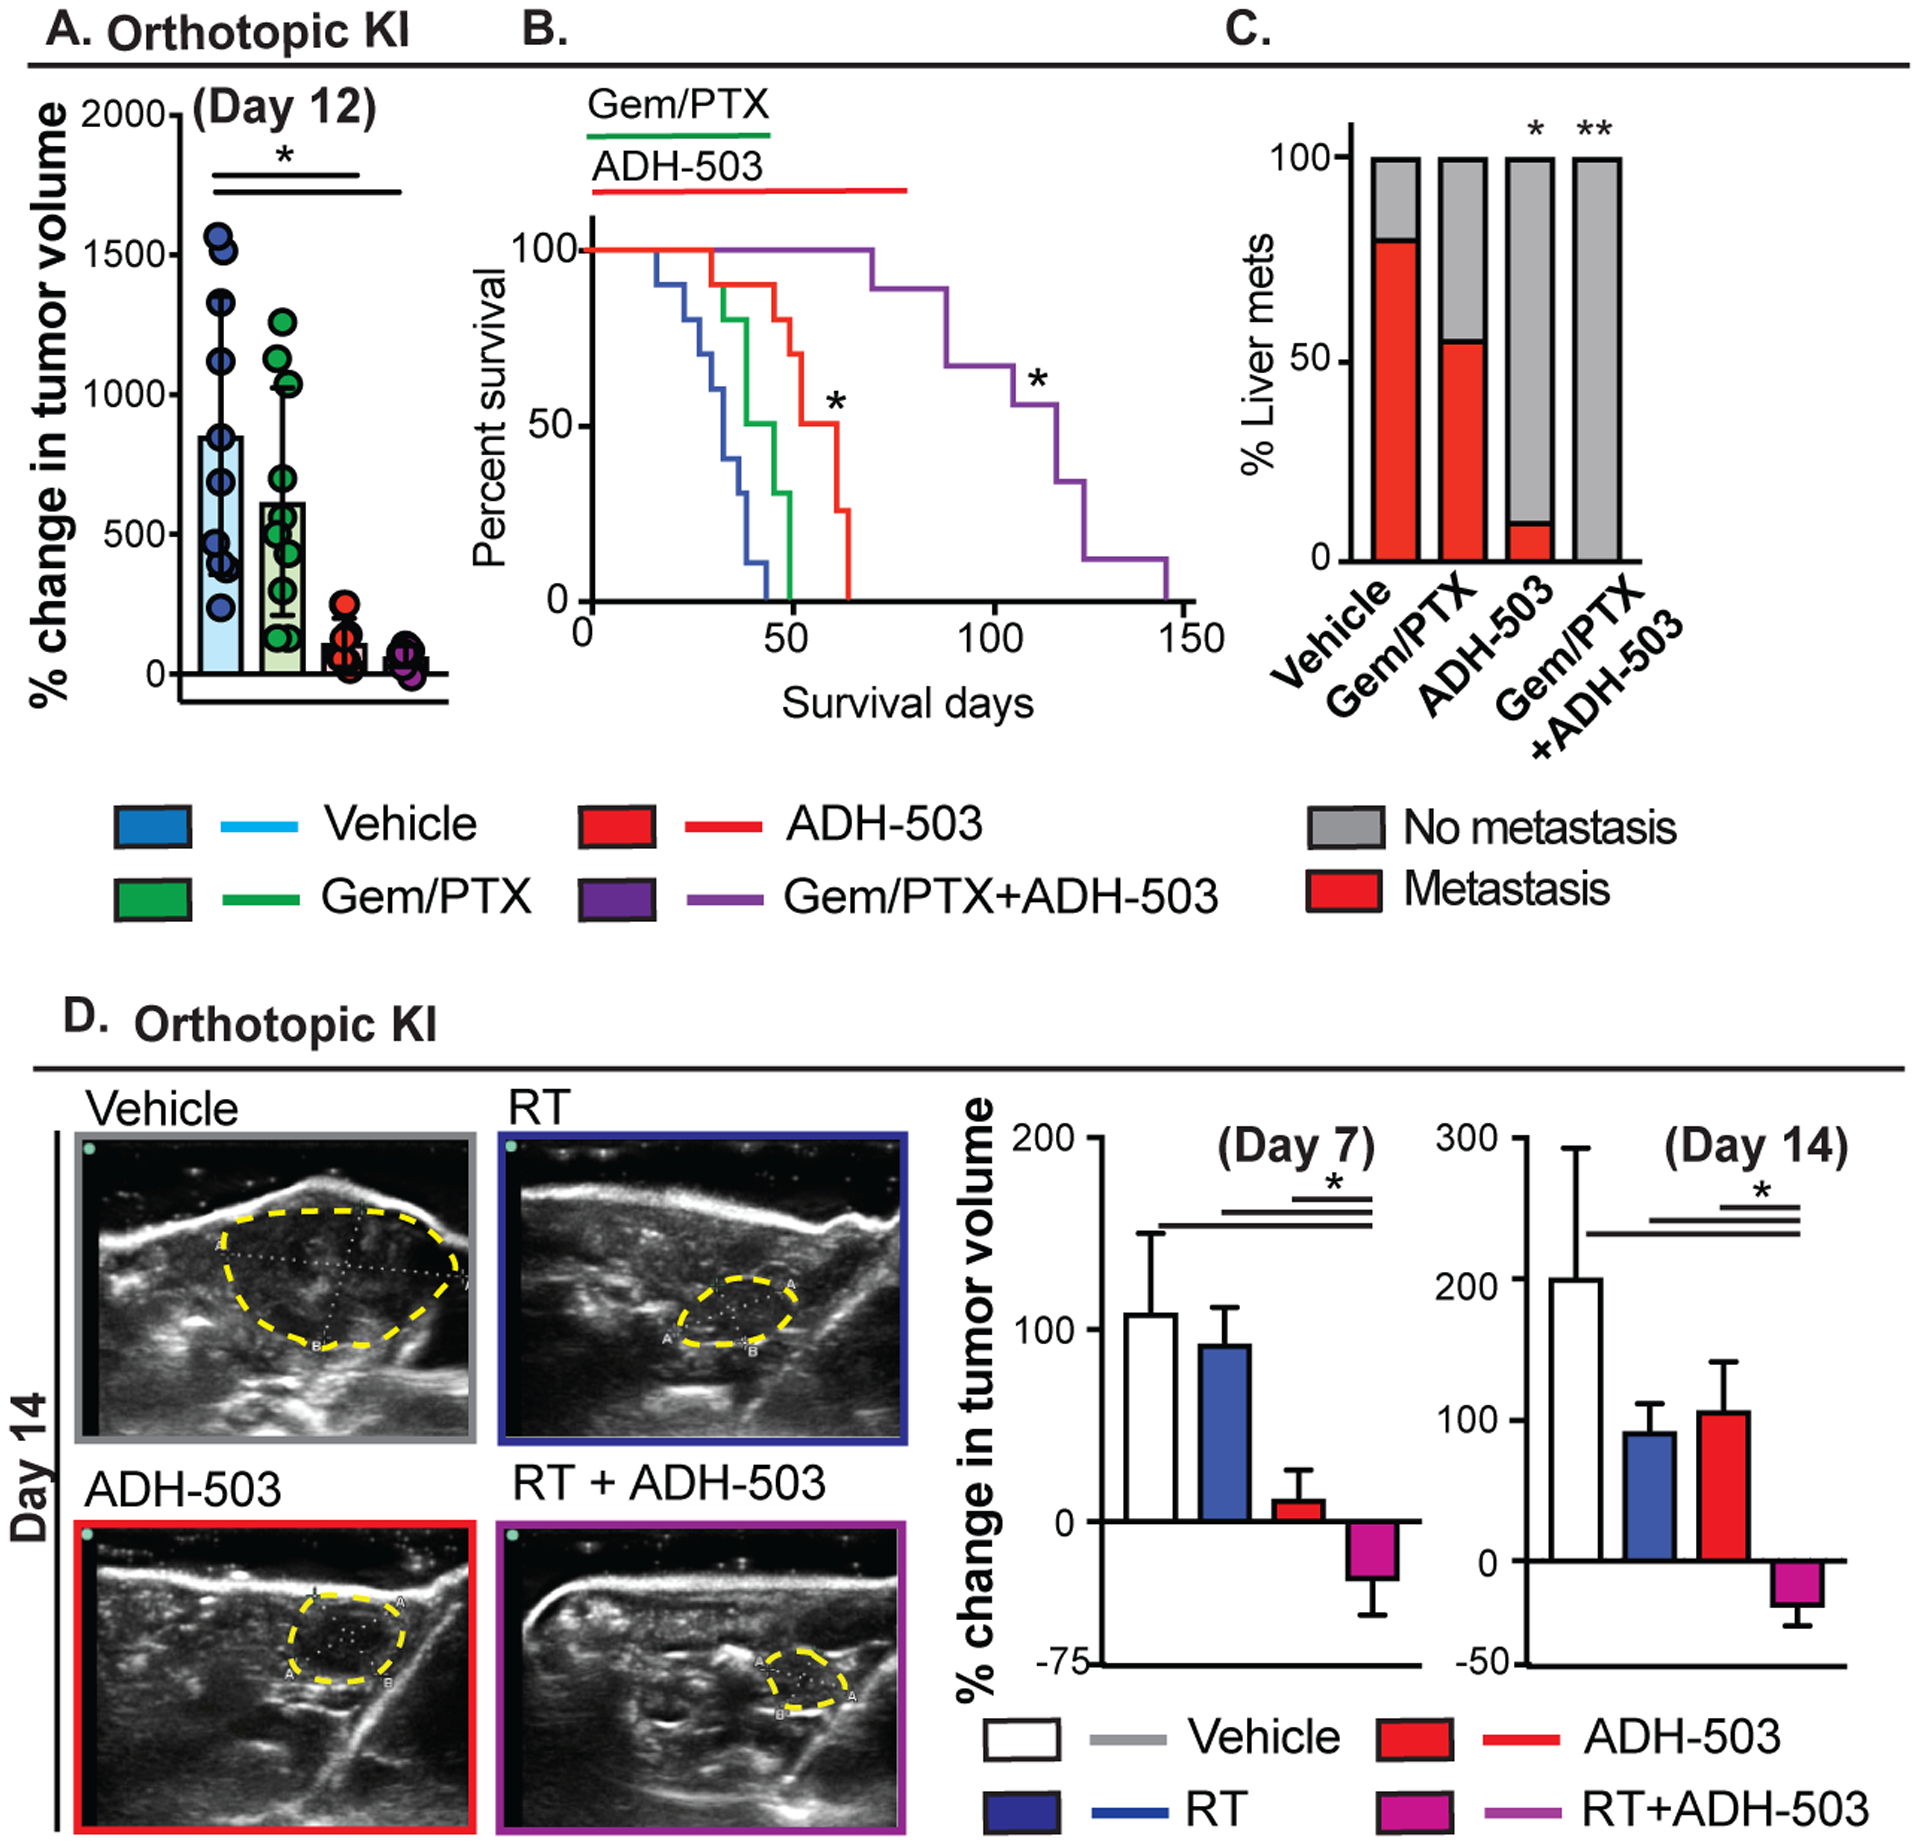
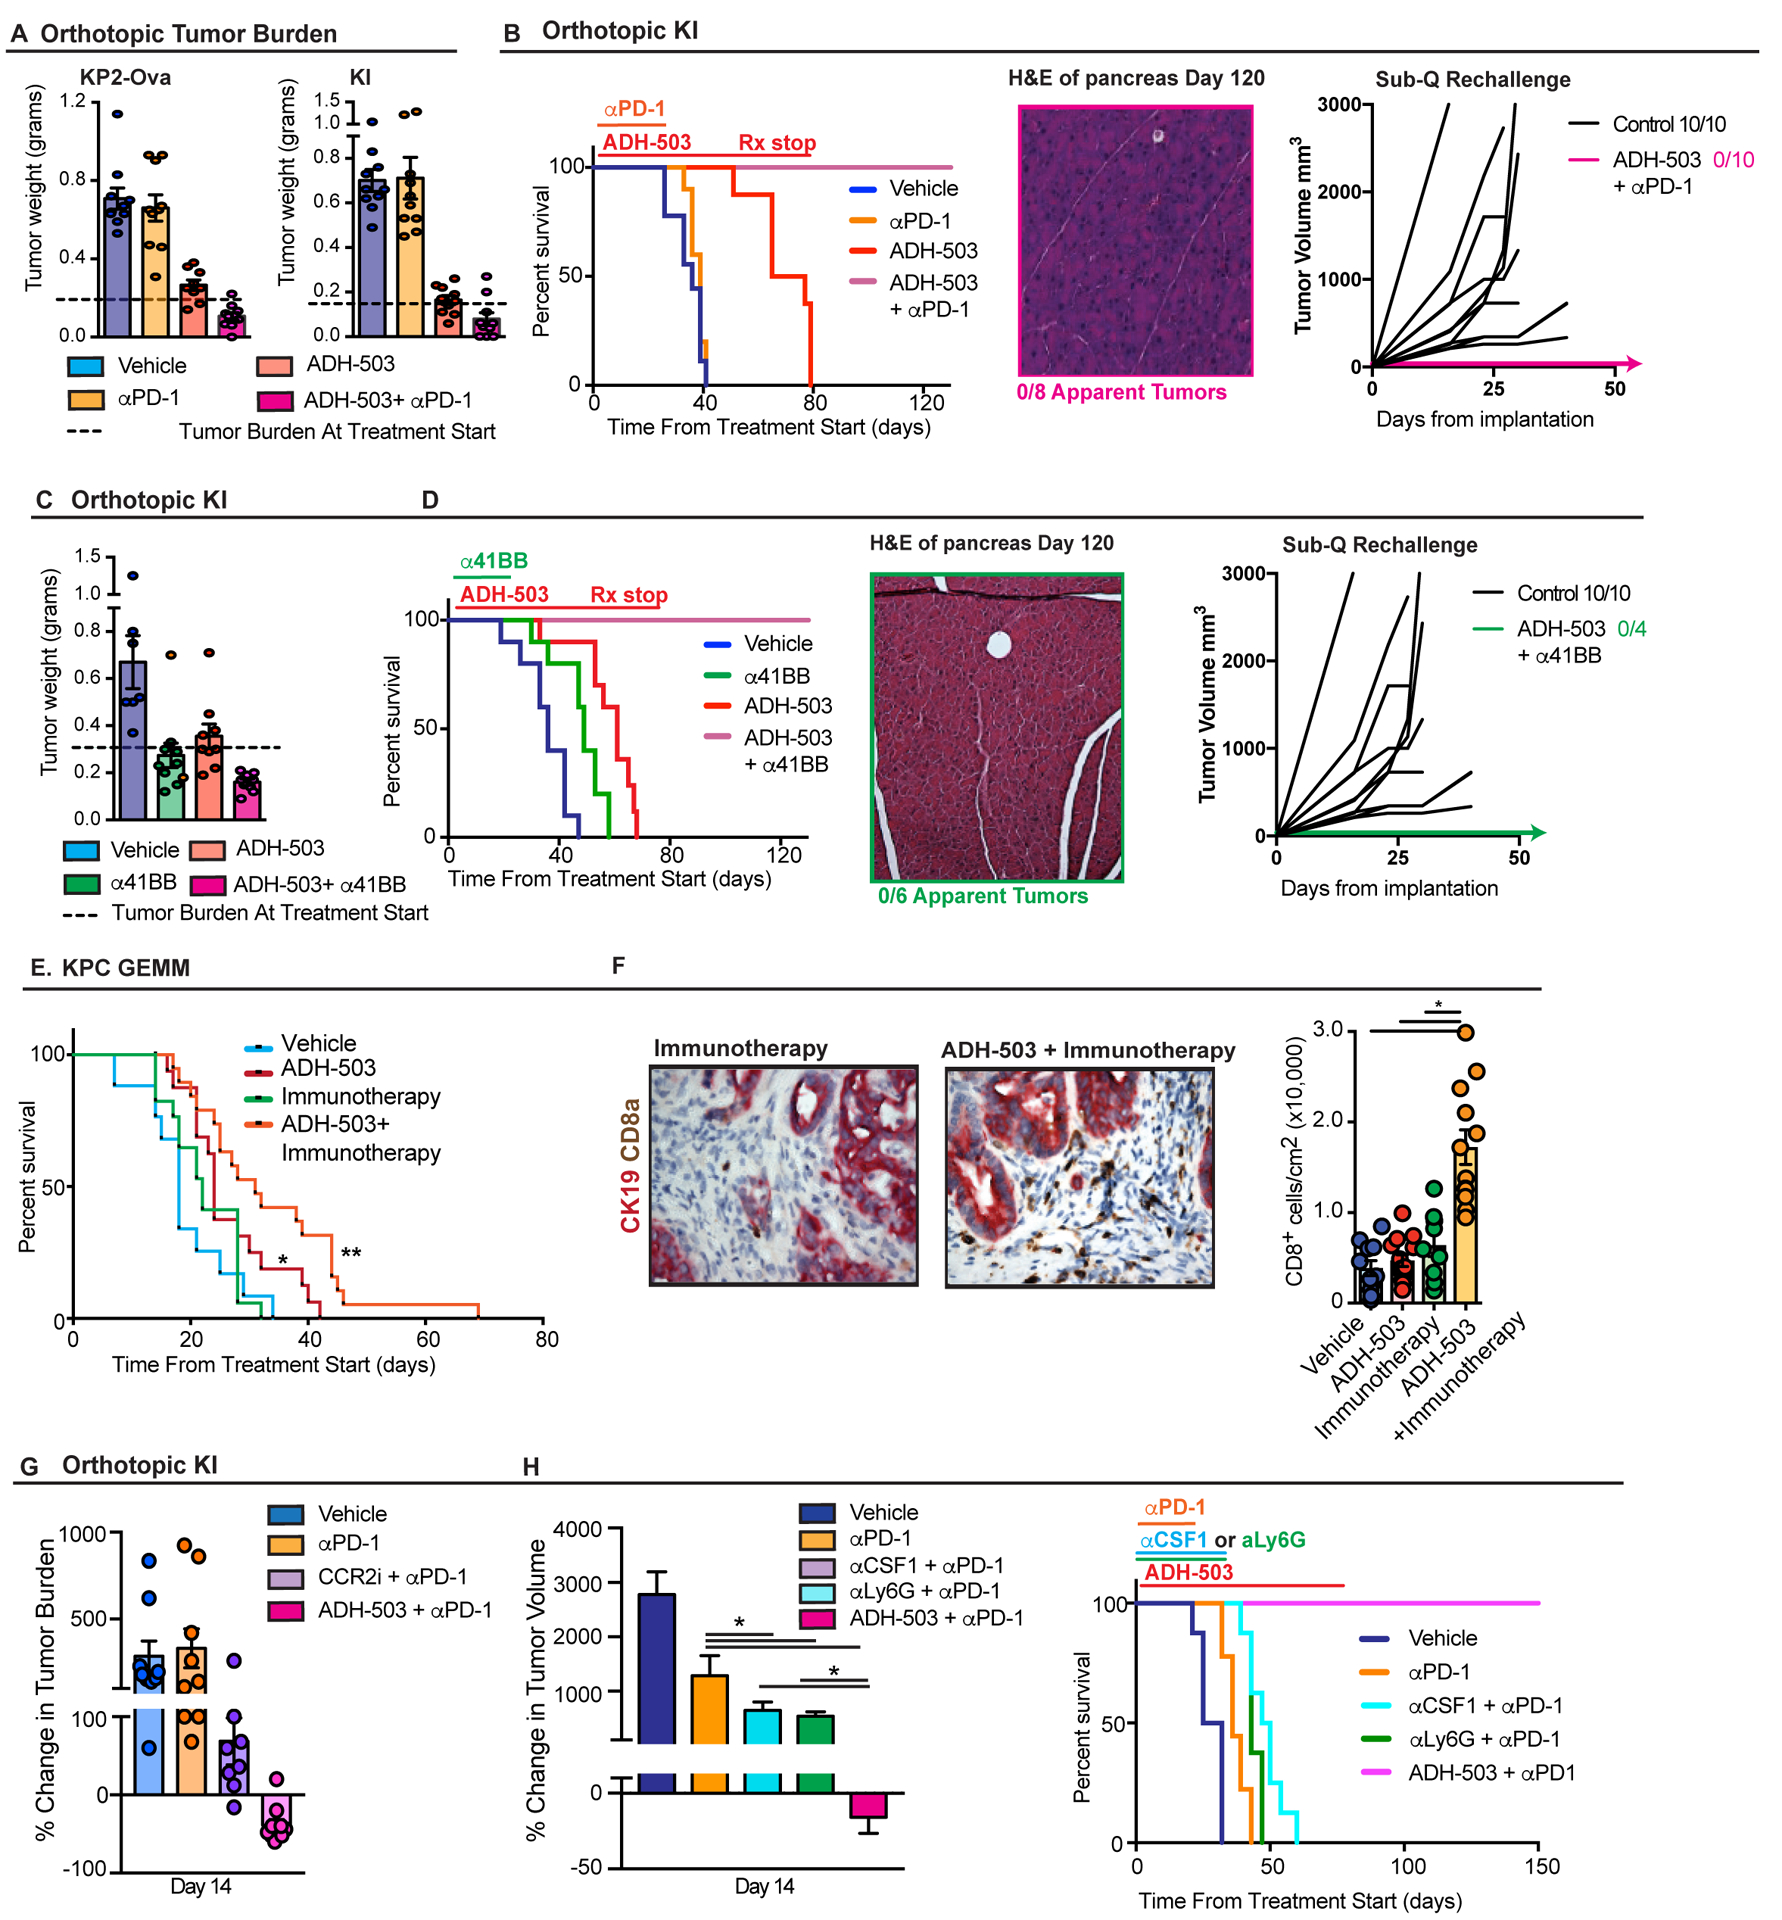
Although checkpoint immunotherapies have revolutionized the treatment of cancer, not all tumor types have seen substantial benefit. Pancreatic ductal adenocarcinoma (PDAC) is a highly lethal malignancy in which very limited responses to immunotherapy have been observed. Extensive immunosuppressive myeloid cell infiltration in PDAC tissues has been postulated as a major mechanism of resistance to immunotherapy. Strategies concomitantly targeting monocyte or granulocyte trafficking or macrophage survival, in combination with checkpoint immunotherapies, have shown promise in preclinical studies, and these studies have transitioned into ongoing clinical trials for the treatment of pancreatic and other cancer types. However, compensatory actions by untargeted monocytes, granulocytes, and/or tissue resident macrophages may limit the therapeutic efficacy of such strategies. CD11b/CD18 is an integrin molecule that is highly expressed on the cell surface of these myeloid cell subsets and plays an important role in their trafficking and cellular functions in inflamed tissues. Here, we demonstrate that the partial activation of CD11b by a small-molecule agonist (ADH-503) leads to the repolarization of tumor-associated macrophages, reduction in the number of tumor-infiltrating immunosuppressive myeloid cells, and enhanced dendritic cell responses. These actions, in turn, improve antitumor T cell immunity and render checkpoint inhibitors effective in previously unresponsive PDAC models. These data demonstrate that molecular agonism of CD11b reprograms immunosuppressive myeloid cell responses and potentially bypasses the limitations of current clinical strategies to overcome resistance to immunotherapy.


Conflict of interest statement

Competing interests: VG and DGD have competing financial interest related to ADH-503. VG has partial ownership of Adhaere Pharmaceuticals and DGD is a scientific advisory board member.

Figures

Fig. 1:
Fig. 1:. Pancreatic ductal adenocarcinoma has a dense CD11b+ myeloid infiltrate.
A) Representative images of human PDAC and adjacent normal tissues assessed for CD11b+ myeloid cells at 2.5×, 10×, and 20× (inset). Graphs show the frequency of the subsets in human PDAC and adjacent normal tissues from the same surgical sample (n = 13 paired samples). B–D) CD11b expression determined by CyTOF analysis of human PDAC tissue samples. B) Representative CyTOF tSNE plot showing monocytes, granulocytes, macrophages, T cells, and B cells. C) Expression analysis of CD11b in leukocyte populations. D) Relative frequencies of the composition of CD11b+ cells (n = 7). E) Representative images of CD15+ and CD14+ monocytes and macrophages by IHC. Graphs show the frequency of positive cells in human PDAC and adjacent normal tissues from the same surgical sample (n = 12–15 per paired samples). F–G) CD11b expression analysis of murine PDAC tissues. F) Representative flow cytometry plots showing expression of CD11b on pregated tumor-infiltrating immune cell populations in an orthotopic KP2 PDAC model. G) Graphs depicting the cell composition of total leukocytes (left) and CD11b+ cells, as well as the number of CD11b+ cells per total number of leukocytes (right) (n = 8 mice/graph). H and I) Leukocyte proximity analysis. H) Representative images of CD8a and CD11b (brown) co-staining with CK19 (pink). Histogram of relative CD8a+ or CD11b+ cell numbers binned by cellular distances from CK19+ cells. I) Mean number of positive cells per area within 60 μm of the CK19+ tumor cells (n = 23 PDAC samples). Graphs show the mean ± standard error; * denotes P < 0.05 by two-sided t test.
Fig. 2:
Fig. 2:. Changes in myeloid infiltrates after ADH-503 treatment.
A) Chemical structure of ADH-503. B) A computational model of ADH-503 bound integrin CD11b/CD18, based on the published structure of αXβ2 (54). The integrin chains CD11b (yellow), CD18 (green and red) and the αA-domain of CD11b (blue) are labeled. The model also displays ADH-503 (space-filling model) docked in the activation-sensitive allosteric pocket of the CD11b αA-domain. C) Plasma concentration-time data following oral gavage administration of ADH503 at 30 mg/kg in male rats on Day 1 and Day 5. n=? D) Representative flow cytometry plots of PE+ beads taken up by CD11b+ cells in PDAC tissue from the KP2 orthotopic PDAC model. E) Quantification of PE+ beads taken up by tumor-infiltrating CD11b+ cells, monocytes, granulocytes, or macrophages with and without ADH-503 treatment (n = 3/group). F–H) RNA-seq expression analysis of bone marrow-derived macrophages treated with PDAC conditioned media ± ADH-503 for 7 hours. E) Heat map of differentially expressed genes, F) gene ontology table, and G) select gene changes are depicted. H) Q-PCR mRNA expression analysis of bone marrow-derived macrophages treated with PDAC conditioned media ± ADH-503 or vehicle for 7 hours. Changes in gene expression are depicted as the fold change from the vehicle baseline. Graphs show the mean ± standard error; * denotes P < 0.05 by two-sided t test.
Fig. 3:
Fig. 3:. ADH-503 alters innate responses in PDAC tissues.
A–D) Relative frequencies of tumor-infiltrating granulocytes, monocytes, eosinophils, B cells, NK cells, and macrophages in orthotopic KP2 or KI PDAC models 10 days after treatment with ADH-503 or vehicle (n = 6/group). E) Representative immunofluorescent images of Gr-1 and CD68 in PDAC tissues from KPC mice treated with vehicle or ADH-503 for 14 days. Quantification is shown as the cell number per area in PDAC tissues from KPC mice treated for 14 days or until end-stage tumors developed (n = 5–7 mice/group). F and G) Flow cytometry analysis of antigen presentation markers on TAMs. Data are shown as histograms of geometric mean fluorescent intensity (GEO-MFI) data on TAMs in orthotopic KP2 and KI PDAC models treated with ADH-503 or vehicle for 10 or 12 days. n=? H) Q-PCR analysis on TAMs isolated by FACS from orthotopic KP PDAC tumors 10 days after treatment with ADH-503. Data are shown as the fold change from the vehicle baseline (n = 4 samples/group). Graphs are shown as the mean ± standard error; * denotes P < 0.05 by two-sided t test. All flow cytometry data are representative of 2–3 independent in vivo experiments using both tumor models.
Fig. 4:
Fig. 4:. CD11b-agonism stimulates T cell infiltration and function through augmentation of cDC1s.
A and B) Frequencies of tumor-infiltrating CD8a+ CTLs, FOXP3+ regulatory T cells, and CD4+ effectors in orthotopic KP2 PDAC tissues from mice treated 10–12 days with ADH-503 or vehicle. Graphs show the mean CTL number and subsets of CD8+ CTLs marked by CD44HiCD62LLow, Ki-67, PD1High, Tim3+PD1+, or Eomes+PD1+ (n = 5–6/group). C) Measurement of PD-L1 expression by flow cytometry of the CD45 population in orthotopic KP2 PDAC tissues 10 days after treatment with ADH-503 or vehicle. Representative histograms and Geo-MFI are shown. D) Frequencies and phenotypes of tumor-infiltrating CD8a+ CTLs in orthotopic KI PDAC tissues from mice treated 12 days with ADH-503 or vehicle. Graphs show the mean CTL number and subsets of CD8a+ CTLs marked by CD44HiCD62LLow, Ki-67, or PD1High (n = 5–6/group). E) Representative IHC images of CD8a (brown) and CK19 (pink) in PDAC tissues derived from KPC mice treated with vehicle or ADH-503 for 14 days. The histogram shows the relative CD8a+ cell number or frequency binned by cellular distances from CK19+ cells. I) Mean number of positive cells per area within 60 μm of CK19+ tumor cells (n = 6/group). F and G) Frequencies and quantification of OVA-specific dextramer+ cells in PDAC tissues (F) and dLNs (G) using the orthotopic KP2-OVA PDAC model in mice treated with vehicle or ADH-503 for 10 days. H) Frequencies of CD11b+ and CD103+ DCs and MHC-I and MHC-II expression in CD103+ cDCs in KP2 PDAC tissues from mice treated with vehicle or ADH-503 for 12 days. Mean cell percentages and GEO-MFI data are shown. I) Quantification of CD8+ T cells in KP2-OVA PDAC tissues from wild-type and BATF3-deficient mice treated with vehicle or ADH-503 for 10 days. Mean cell number/area and representative IHC images are shown. Graphs show the mean ± standard error; * denotes P < 0.05 by two-sided t test (A-H) or Mann-Whitney test (G), depending on the data distribution or Kolmogorov-Smirnov test for immune cell proximity (E). All flow cytometry data are representative of 2–3 independent in vivo experiments using at least two PDAC models.
Fig. 5:
Fig. 5:. CD11B agonism delays tumor progression.
A) Tumor growth in syngeneic orthotopic models of PDAC KP2, KI, and KP2-OVA shown by tumor weights 10 days after treatment with vehicle or ADH-503 (n = 7–10/group). B) Changes in tumor volume as measured by ultrasound imaging. Representative ultrasound images of KI PDAC tumors and mean percent changes in tumor volume are depicted 14 days after treatment. Yellow line depicts tumor area. C) Kaplan-Meier survival analysis of orthotopic tumors KI tumors treated with vehicle or ADH-503 (n = 7–8/group). D) Genetic KPC mice were treated with vehicle or ADH-503. Tumor weight of mice treated for 14 days and Kaplan-Meier survival analysis are shown (n = 6–7 or 10–12/group, respectively). E) Subcutaneous KP2 tumor growth in wild-type or CD11b-deficient animals treated with vehicle or ADH-503 once the tumor reached 75–100 cm3. Tumor volume was measured by calipers. (n=?). F) Orthotopic KP-OVA tumor burden measured 10 days after treatment with vehicle or ADH-503 in wild-type or BATF3-deficient mice or in wild-type mice treated with CD4 and/or CD8-depleting IgGs or neutralizing IgGs against CXCR3 (n = 5–10/group). G) Analysis of PDAC pathology. Shown are representative H&E images with histological grading, IHC results of tumor and stromal Ki67 staining, tumor cleaved caspase 3 staining, Sirius red-stained collagen density, and SMA+ or FAP+ fibroblasts in PDAC tissues from KPC tumors treated with vehicle or ADH-503 for 14 days or at end stage (n = 5–10 mice/group). Bar graphs show the mean ± standard error; * denotes P < 0.05 by two-sided t -test, log-rank test or ANOVA as appropriate. Tumor burden data are representative of 2–3 independent in vivo experiments.
Fig. 6:
Fig. 6:. CD11B agonism improves the efficacy of chemotherapy.
A) Changes in tumor volume as measured by ultrasound imaging. Animals were enrolled when the orthotopic KI tumor was greater than 0.4 cm in diameter and subsequently treated with vehicle or ADH-503 ± GEM/PTX. Representative ultrasound images and mean percent change in tumor volume are shown 12 days after treatment (n = 8–10/group). B) Kaplan-Meier survival analysis of mice from (A) (n = 8–10/group). C) Quantification of the percentage of mice bearing overt liver metastases on gross examination (n = 7–10/group). D) Changes in tumor volume as measured by ultrasound imaging. Animals were enrolled when the orthotopic KI tumor was greater than 0.4 cm in diameter and subsequently treated with vehicle or ADH-503 ± radiation therapy (4Gy × 5). Representative ultrasound images and mean percent change in tumor volume are shown 12 days after treatment (n = 8–10/group). Bar graphs show the mean ± standard error; * denotes P < 0.05 by two-sided t test or log-rank test.
Fig. 7:
Fig. 7:. CD11B agonism renders PDAC tumors responsive to checkpoint immunotherapy.
A) Tumor burden 12–14 days after treatment with vehicle or ADH-503 ± anti-PD1 in orthotopic KP2-OVA or KI models (n = 8–10/group). Dashed line depicts tumor burden from five parallel mice taken at start of treatment. B) Analyses of survival and rechallenge. KI tumor-bearing mice from (A) were assessed for Kaplan-Meier survival analysis (left), pathological analysis of the pancreas was performed in mice surviving more than 120 days (center), and mice treated with this regimen were re-challenged with KI tumor cells subcutaneously (right). “Control” mice were animals who had never been exposed to KI tumor cells prior to subcutaneous injection (n = 8–10/group). C) Tumor burden 12 days after treatment with vehicle or ADH-503 ± anti-41BB in mice bearing established (> 0.4 cm) orthotopic KI PDAC tumors (n = 7–9/group). D) Analyses of survival and rechallenge. KI tumor-bearing mice from (C) were assessed for Kaplan-Meier survival analysis (left), pathological analysis of the pancreas was performed in mice surviving more than 120 days (center), and mice were re-challenged with KI tumor cells subcutaneously (right). “Control” mice were animals who had never been exposed to KI tumor cells prior to subcutaneous injection (n = 4–10/group). E) Kaplan-Meier survival analysis of genetic KPC mice treated with vehicle or ADH-503 ± “Immunotherapy” (50 mg/kg gemcitabine + anti-PD1 + anti-CTLA4). Mice were enrolled in the study when tumors were greater than 0.4 cm in diameter (n = 10–15/group). F) Analysis of CD8a+ cells that infiltrated into PDAC tissues in end-stage KPC tumors from mice in (E). Representative images and quantitation results are shown. G) Comparison of ADH-503 and CCR2 inhibition (CCR2i, PF-04136309). Tumor burden 14 days after treatment with vehicle, ADH-503, or CCR2i ± anti-PD1 in mice bearing established (> 0.4 cm) orthotopic KI PDAC tumors (n = 7–9/group). Data are depicted as the change in tumor burden compared to five untreated animals sacrificed at the beginning of treatment. H) Comparison of ADH-503 and CSF1/CSF1R or granulocyte inhibition. The left panel shows the observed changes in tumor volume 14 days after treatment with vehicle, ADH-503, anti-CSF1 IgG (5A1), or Ly6G-depleting IgG (1A8) ± anti-PD1 in mice bearing established (> 0.4 cm) orthotopic KI PDAC tumors. The right panel shows the Kaplan-Meier survival analysis in the same animals. Bar graphs show the mean ± standard error; * denotes P < 0.05 by two-sided t -test, log-rank test or ANOVA as appropriate.

Comment in

Similar articles

Cited by

References

    1. Royal RE, Levy C, Turner K, Mathur A, Hughes M, Kammula US, Sherry RM, Topalian SL, Yang JC, Lowy I, Rosenberg SA, Phase 2 trial of single agent Ipilimumab (anti-CTLA-4) for locally advanced or metastatic pancreatic adenocarcinoma. J Immunother 33, 828–833 (2010). - PMC - PubMed
    1. Pollard JW, Macrophages define the invasive microenvironment in breast cancer. J Leukoc Biol 84, 623–630 (2008). - PMC - PubMed
    1. Qian BZ, Li J, Zhang H, Kitamura T, Zhang J, Campion LR, Kaiser EA, Snyder LA, Pollard JW, CCL2 recruits inflammatory monocytes to facilitate breast-tumour metastasis. Nature 475, 222–225 (2011). - PMC - PubMed
    1. Qian BZ, Pollard JW, Macrophage diversity enhances tumor progression and metastasis. Cell 141, 39–51 (2010). - PMC - PubMed
    1. Stromnes IM, Brockenbrough JS, Izeradjene K, Carlson MA, Cuevas C, Simmons RM, Greenberg PD, Hingorani SR, Targeted depletion of an MDSC subset unmasks pancreatic ductal adenocarcinoma to adaptive immunity. Gut 63, 1769–1781 (2014). - PMC - PubMed

Publication types

MeSH terms