. 2019 Jul 3;10(1):2942.
doi: 10.1038/s41467-019-10795-9.

Locus coeruleus-CA1 projections are involved in chronic depressive stress-induced hippocampal vulnerability to transient global ischaemia

Affiliations

Locus coeruleus-CA1 projections are involved in chronic depressive stress-induced hippocampal vulnerability to transient global ischaemia

Qian Zhang et al. Nat Commun. .

Abstract

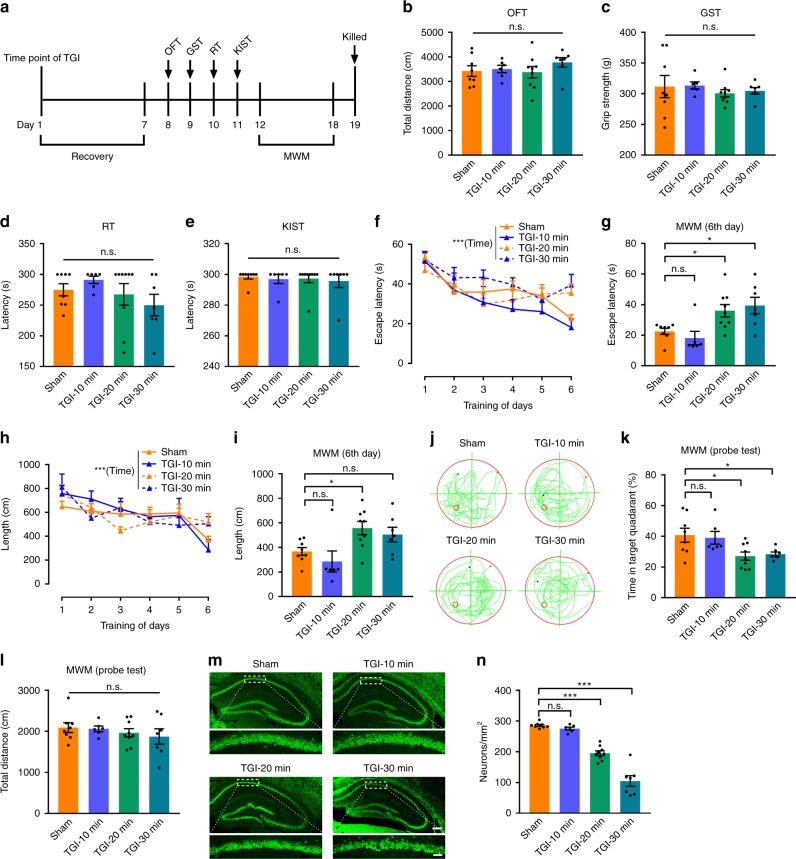
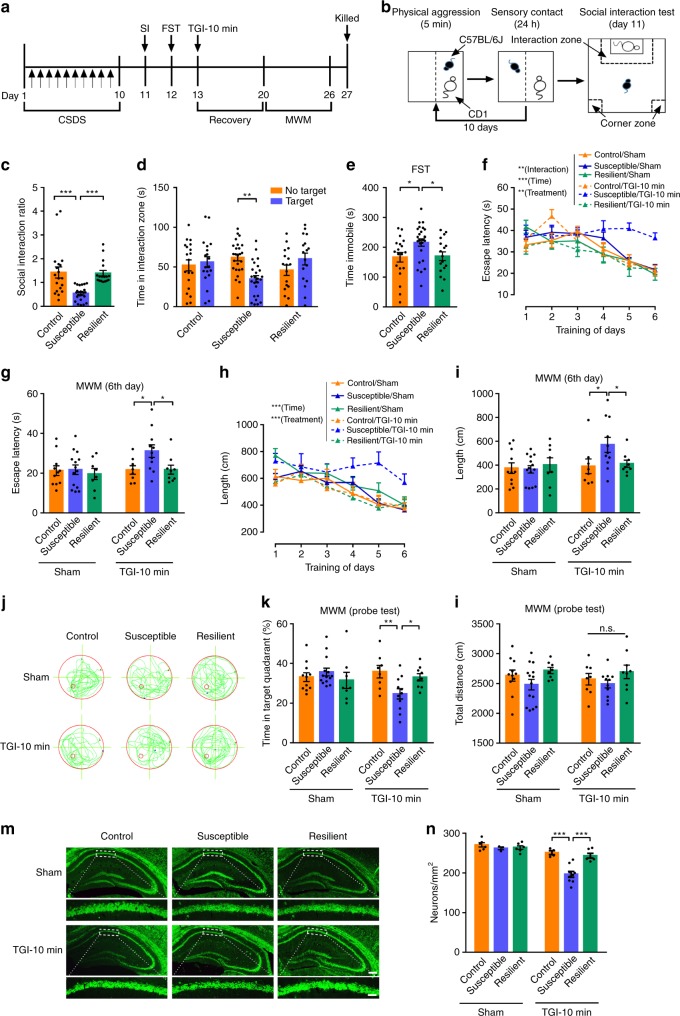
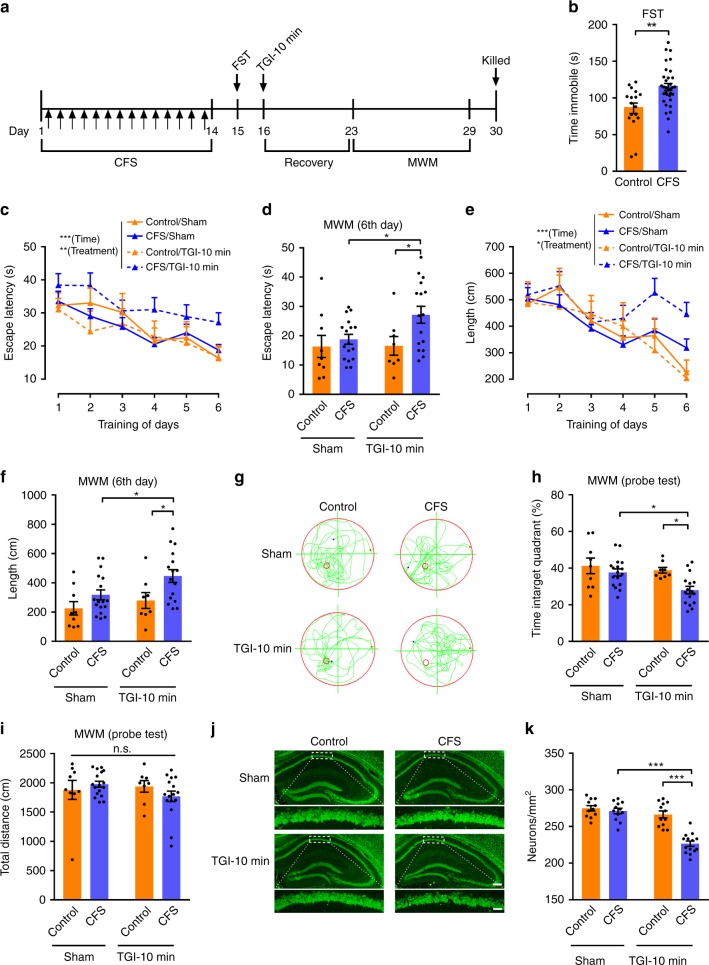
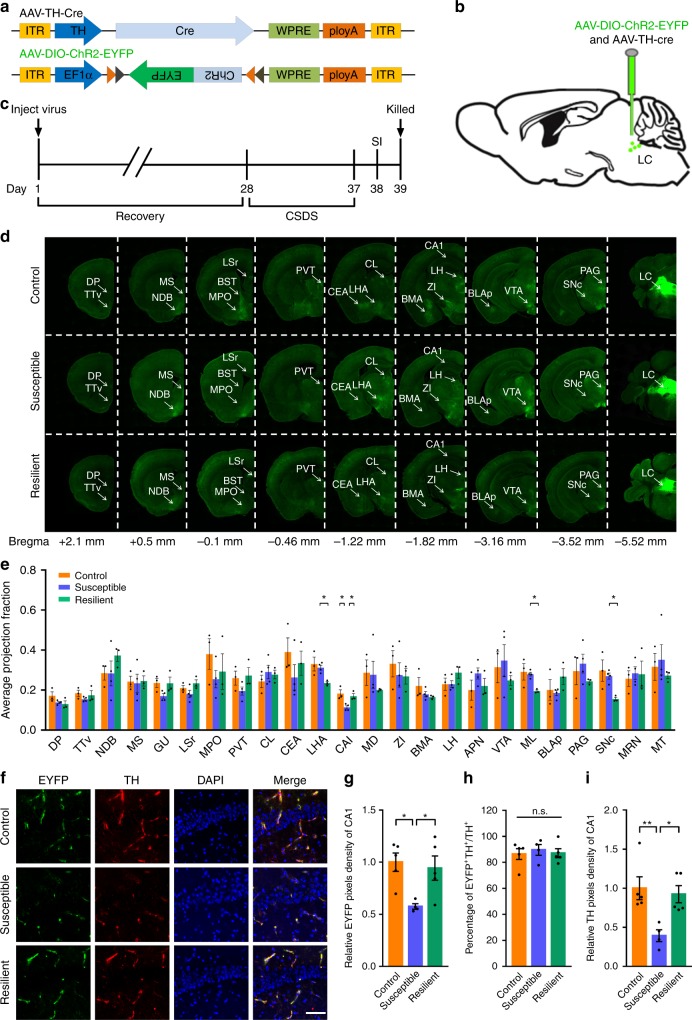
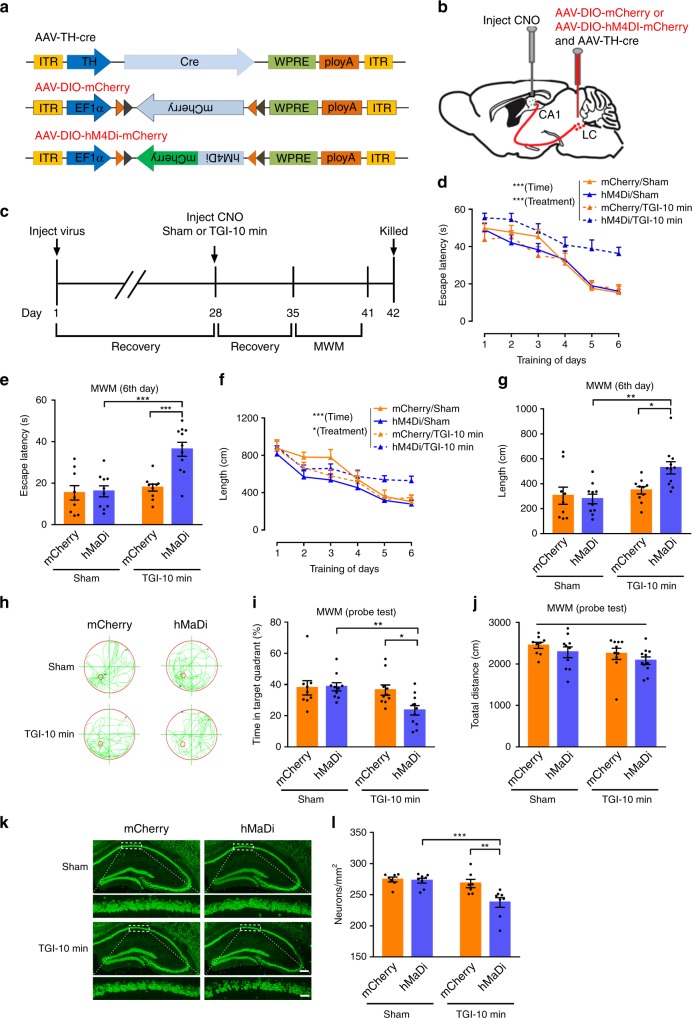
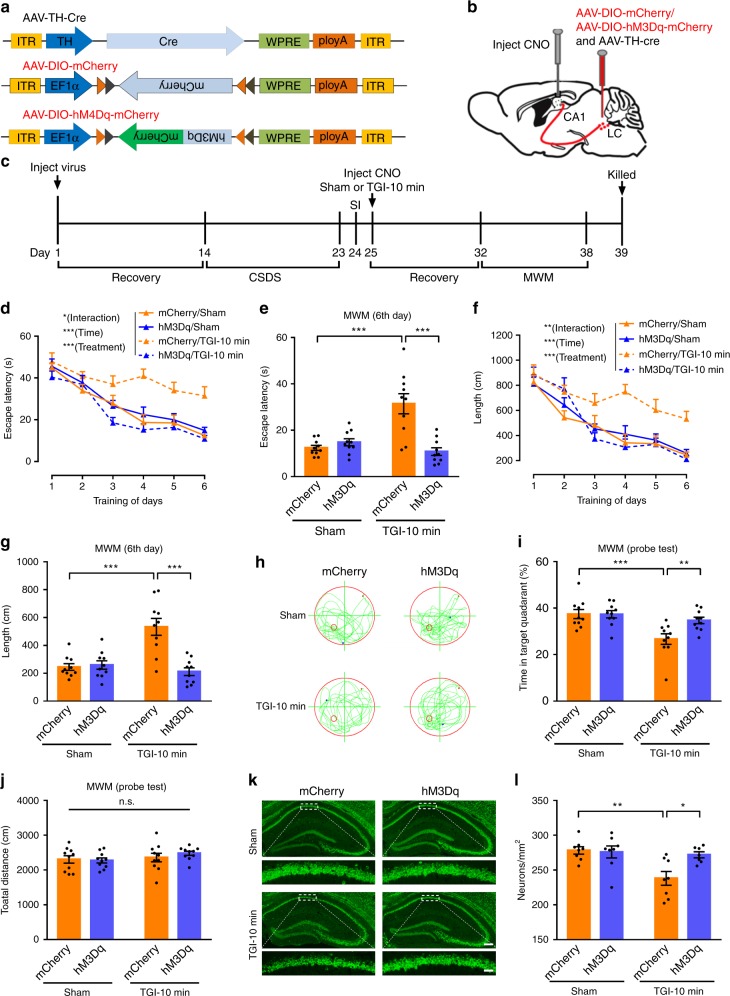
Depression and transient ischaemic attack represent the common psychological and neurological diseases, respectively, and are tightly associated. However, studies of depression-affected ischaemic attack have been limited to epidemiological evidences, and the neural circuits underlying depression-modulated ischaemic injury remain unknown. Here, we find that chronic social defeat stress (CSDS) and chronic footshock stress (CFS) exacerbate CA1 neuron loss and spatial learning/memory impairment after a short transient global ischaemia (TGI) attack in mice. Whole-brain mapping of direct outputs of locus coeruleus (LC)-tyrosine hydroxylase (TH, Th:) positive neurons reveals that LC-CA1 projections are decreased in CSDS or CFS mice. Furthermore, using designer receptors exclusively activated by designer drugs (DREADDs)-based chemogenetic tools, we determine that Th:LC-CA1 circuit is necessary and sufficient for depression-induced aggravated outcomes of TGI. Collectively, we suggest that Th:LC-CA1 pathway plays a crucial role in depression-induced TGI vulnerability and offers a potential intervention for preventing depression-related transient ischaemic attack.


Conflict of interest statement

The authors declare no competing interests.

Figures

Fig. 1
Fig. 1
Time-dependent hippocampal damage after transient global ischaemia. a Experimental scheme. Mice were exposed to various time-points of TGI at 10, 20 and 30 min and then evaluated by open field test (OFT), grip strength test (GST), rotarod test (RT), Kondziela's inverted screen test (KIST) and Morris water maze (MWM). Measurements for b locomotor activity were performed by OFT (one-way ANOVA, P = 0.5604), c muscular strength by the GST (one-way ANOVA, P = 0.8167) and d motor function by RT (one-way ANOVA, P = 0.3309) and e KIST (one-way ANOVA, P = 0.9277). f Mean latencies to a hidden platform from the acquisition trials (RM two-way ANOVA, interaction: P = 0.4005, time: P < 0.0001***, treatment: P = 0.0691). g The latency to reach a hidden platform during the training tests on day 6 (one-way ANOVA, P = 0.0047**; post hoc Dunnett's test, Sham vs. TGI-10 min, P = 0.8035, Sham vs. TGI-20 min, P = 0.0493*, Sham vs. TGI-30 min, P = 0.0181*). h The mean distance to reach a hidden platform (RM two-way ANOVA, interaction: P = 0.2621, time: P < 0.0001***, treatment: P = 0.9592). i The swim length to reach a hidden platform on day 6 (one-way ANOVA, P = 0.0141*; post hoc Dunnett's test, Sham vs. TGI-10 min, P = 0.6527, Sham vs. TGI-20 min, P = 0.0485*, Sham vs. TGI-30 min, P = 0.2347). j Representative path tracings from the probe trials on day 7. k The percentage of time spent in the target quadrant during the probe trial (one-way ANOVA, P = 0.0125*; post hoc Dunnett's test, Sham vs. TGI-10 min, P = 0.9758, Sham vs. TGI-20 min, P = 0.0159*, Sham vs. TGI-30 min, P = 0.0446*). l The total distance from the probe trials on day 7 (one-way ANOVA, P = 0.6342). m Representative images of the hippocampus (top) and CA1 area (bottom). The slices were stained with anti-NeuN (Green). Scaling bar: 250 μm (top), 50 μm (bottom). n Quantification of CA1 neurons by immunofluorescence as shown in (m), one-way ANOVA, P < 0.0001***, post hoc Dunnett's test (Sham vs. TGI-10 min, P = 0.8109, Sham vs. TGI-20 min, P < 0.0001***, Sham vs. TGI-30 min, P < 0.0001***). Sham (n = 8), TGI-10 min (n = 6), TGI-20 min (n = 9), TGI-30 min (n = 7). All data are displayed as means ± s.e.m
Fig. 2
Fig. 2
Chronic social defeat stress aggravates TGI-induced hippocampal injury. a Experimental timeline. b Behavioural paradigm of repeated chronic social defeat stress (CSDS) experiments. c The social interaction ratio by social interaction (SI) test (one-way ANOVA, P < 0.0001***; post hoc Dunnett's test, Control vs. Susceptible, P < 0.0001***, Susceptible vs. Resilient, P = 0.0002***). Control (n = 19), Susceptible (n = 25), Resilient (n = 17). d The time in the interaction zone (two-way ANOVA, interaction: P = 0.0011**, phonotype: P = 0.5481, No target/Target: P = 0.5378; post hoc Dunnett's test, Control/No target vs. Control/Target, P = 0.9542, Susceptible/No target vs. Susceptible/Target, P = 0.0012**, Resilient/No target vs. Resilient/Target, P = 0.3180). e The immobility time of forced swimming test (FST) (one-way ANOVA, P = 0.0216*; post hoc Dunnett's test, Control vs. Susceptible, P = 0.0253*, Susceptible vs. Resilient, P = 0.0474*). f Spatial learning curves in MWM test (RM two-way ANOVA, interaction: P = 0.0091**, time: P < 0.0001***, treatment: P = 0.0063**). Control/Sham (n = 11), Control/TGI (n = 8), Susceptible/Sham (n = 14), Susceptible/TGI (n = 11), Resilient/Sham (n = 8) and Resilient/TGI (n = 9). g The latency on day 6 (two-way ANOVA, interaction: P = 0.1809, phenotype: P = 0.0581, treatment: P = 0.076; post hoc Dunnett's test, Control/TGI-10 min vs. Susceptible/TGI-10 min, P = 0.0336*, Susceptible/TGI-10 min vs. Resilient/TGI-10 min, P = 0.0303*). h Swimming distance during training session (RM two-way ANOVA, interaction: P = 0.6481, time: P < 0.0001***, treatment: P = 0.0004***). i The swimming length on day 6 (two-way ANOVA, interaction: P = 0.0688, phenotype: P = 0.1882, treatment: P = 0.0619; post hoc Dunnett's test, Control/TGI-10 min vs. Susceptible/TGI-10 min, P = 0.0293*, Susceptible/TGI-10 min vs. Resilient/TGI-10 min, P = 0.0498*). j Representative swimming traces on day 7. k The percentage of time spent in the target quadrant (two-way ANOVA, interaction: P = 0.0159*, phenotype: P = 0.2483, treatment: P = 0.2639; post hoc Dunnett's test, Control/TGI-10 min vs. Susceptible/TGI-10 min, P = 0.0095**, Susceptible/TGI-10 min vs. Resilient/TGI-10 min, P = 0.0499*). l Total distance during the probe test (two-way ANOVA, interaction: P = 0.9241, phenotype: P = 0.0542, treatment: P = 0.7465). m Representative fluorescent images of hippocampus (top, scaling bar = 250 μm) and a higher magnification CA1 area (bottom, scaling bar = 50 μm). n Quantification of surviving CA1 pyramidal neurons. Control/Sham (n = 6), Control/TGI-10 min (n = 4), Susceptible/Sham (n = 3), Susceptible /TGI-10 min (n = 9), Resilient/Sham (n = 6), Resilient/TGI-10 min (n = 6). Two-way ANOVA, interaction: P = 0.0045**, phenotype: P = 0.0004***, treatment: P < 0.0001***; post hoc Dunnett's test, Control/TGI-10 min vs. Susceptible/TGI-10 min, P < 0.0001***, Susceptible/TGI-10 min vs. Resilient/TGI-10 min, P < 0.0001***. All data are displayed as means ± s.e.m.
Fig. 3
Fig. 3
Chronic footshock stress confers TGI susceptibility to hippocampal damage. a Overall schematic of the methodology utilised. b Immobility time was measured by FST (unpaired two-tailed Student’s t test, P = 0.0011**). Control (n = 17), CFS (n = 33). c The escape latency of water maze (RM two-way ANOVA, interaction: P = 0.9827, time: P < 0.0001***, treatment: P = 0.0027**). Control/Sham (n = 9), Control/TGI (n = 8), CFS/Sham (n = 17), CFS/TGI (n = 16). d The latency on day 6 (two-way ANOVA, interaction: P = 0.1692, Control vs. CFS: P = 0.03*, Sham vs. TGI-10 min: P = 0.1469; post hoc Dunnett's test, Control/TGI-10 min vs. CFS/TGI-10 min, P = 0.0413*, CFS/Sham vs. CFS/TGI-10 min, P = 0.0460*). e The swimming length during training session. (RM two-way ANOVA, interaction: P = 0.447, time: P < 0.0001***, treatment: P = 0.0254*). f The swimming length on day 6 (two-way ANOVA, interaction: P = 0.4233, Control vs. CFS: P = 0.0072**, Sham vs. TGI-10 min: P = 0.0558; post hoc Dunnett's test, Control/TGI-10 min vs. CFS/TGI-10 min, P = 0.0356*, CFS/Sham vs. CFS/TGI-10 min, P = 0.0465*). g Representative swimming paths for 2 min on day 7. h The percentage of time spent in the target quadrant (two-way ANOVA, interaction: P = 0.1712, Control vs. CFS: P = 0.008**, Sham vs. TGI-10 min: P = 0.2552; post hoc Dunnett's test, Control/TGI-10 min vs. CFS/TGI-10 min, P = 0.0167*, CFS/Sham vs. CFS/TGI-10 min, P = 0.0074**). i A probe trial showing the total distance in the MWM (two-way ANOVA, interaction: P = 0.1885, Control vs. CFS: P = 0.7202, Sham vs. TGI-10 min: P = 0.4574). j Images depicting hippocampal neurons with anti-NeuN and a higher magnification CA1 area (Scale bars represent 250 and 50 μm). k Quantitative assessment of CA1 neuronal survival, Control/Sham (n = 11), Control/TGI-10 min (n = 12), CFS/Sham (n = 12), CFS/TGI-10 min (n = 14). (Two-way ANOVA, interaction: P < 0.0001***, Control vs. CFS: P < 0.0001***, Sham vs. TGI-10 min: P < 0.0001***; post hoc Dunnett's test, Control/TGI-10 min vs. CFS/TGI-10 min, P < 0.0001***, CFS/Sham vs. CFS/TGI-10 min, P < 0.0001***). All data are displayed as means ± s.e.m
Fig. 4
Fig. 4
Whole-brain quantitative mapping of direct outputs from LC-TH+ neurons in CSDS. a Schematic maps of AAV vector constructs. b Schematic of Ef1α-DIO-hChR2(H134R)-EYFP combined with TH-Cre injection into the LC. c Experimental procedures. d Example of projections at nine coronal levels from LC-TH+ neuron populations. Measurements are given in millimetres from the bregma. Scaling bar = 1 mm. e Quantitative pixel density of output axons of LC-TH+ neurons in the corresponding brain area. Control (n = 3), Susceptible (n = 4), Resilient (n = 3). One-way ANOVA with post hoc Dunnett's test was used. DP (P = 0.1501), TTv (P = 0.3787), NDB (P = 0.4218), MS (P = 0.9735), GU (P = 0.0999), LSr (P = 0.1521), MPO (P = 0.4466), PVT (P = 0.2107), CL (P = 0.5693), CEA (P = 0.4194), LHA (P = 0.0387, Control vs. Susceptible, P = 0.7548, Susceptible vs. Resilient, P = 0.0486*), CA1 (P = 0.013, Control vs. Susceptible, P = 0.0188*, Susceptible vs. Resilient, P = 0.0307*), MD (P = 0.5691), ZI (P = 0.7302), BMA (P = 0.3187), LH (one-way ANOVA, P = 0.2466), APN (P = 0.3067), VTA (P = 0.6144), ML (P = 0.0598, Control vs. Susceptible, P = 0.9012, Susceptible vs. Resilient, P = 0.0497*), BLAp (P = 0.2787), PAG, periaqueductal grey (P = 0.4653), SNc (P = 0.0576, Control vs. Susceptible, P = 0.7394, Susceptible vs. Resilient, P = 0.0481*), MRN (P = 0.9015), MT (P = 0.6952). f Representative immunofluorescent staining shows the EYFP (green), anti-TH (red), and DAPI (blue) of CA1 region. Scaling bar = 250 μm. g Quantitative EYFP pixel density of directly projected axons of LC-TH+ neurons in CA1 area (one-way ANOVA, P = 0.0111*); post hoc Dunnett's test, Control vs. Susceptible, P = 0.0156*, Susceptible vs. Resilient, P = 0.0330*. Control (n = 5), Susceptible (n = 6), Resilient (n = 5). h Quantitation of EYFP+TH+ double positive in the whole TH+ signalling of CA1 region (one-way ANOVA, P = 0.8476). i Histogram depicting the TH+ signal of CA1 region (one-way ANOVA, P = 0.0188*; post hoc Dunnett's test, Control vs. Susceptible, P = 0.0094**, Susceptible vs. Resilient, P = 0.0203*). All data are displayed as means ± s.e.m
Fig. 5
Fig. 5
Chemogenetic inhibition of Th:LC-CA1 circuit mimics susceptibility effect. a Schematic representation. b AAV-DIO-hM4Di-mCherry (or AAV-DIO-mCherry) and AAV-TH-Cre viruses were bilaterally injected into LC region. c Timeline of the experiments performed. d The escape latency of the MWM test (RM two-way ANOVA, interaction: P = 0.1805, time: P < 0.0001***, treatment: P = 0.0002***). mCherry/Sham (n = 7), mCherry/TGI-10 min (n = 7), hM4Di/Sham (n = 8), hM4Di/TGI-10 min (n = 8). e The latency to reach a hidden platform on day 6 (two-way ANOVA, interaction: P = 0.0043**, Sham vs. TGI-10 min: P = 0.0004***, mCherry vs. hM4Di: P = 0.0022**; post hoc Dunnett's test, mCherry/TGI-10 min vs. hM4Di/TGI-10 min, P < 0.0001***, hM4Di/Sham vs. hM4Di/TGI-10 min, P < 0.0001***). f The swimming length during the spatial learning trial (RM two-way ANOVA, interaction: P = 0.2425, time: P < 0.0001***, treatment: P = 0.021*). g Distribution of the swimming length on day 6 (two-way ANOVA, interaction: P = 0.0376*, Sham vs. TGI-10 min: P = 0.004**, mCherry vs. hM4Di: P = 0.1153; post hoc Dunnett's test, mCherry/TGI-10 min vs. hM4Di/TGI-10 min, P = 0.0256*, hM4Di/Sham vs. hM4Di/TGI-10 min, P = 0.0016**). h Representative swimming traces on day 7. i The percentage of time spent in the target quadrant (two-way ANOVA, interaction: P = 0.0505, Sham vs. TGI-10 min: P = 0.0194*, mCherry vs. hM4Di: P = 0.0775; post hoc Dunnett's test, mCherry/TGI-10 min vs. hM4Di/TGI-10 min, P = 0.0227*, hM4Di/Sham vs. hM4Di/TGI-10 min, P = 0.0071**). j Total distance of each group in the probe test (two-way ANOVA, interaction: P = 0.9923, Sham vs. TGI-10 min: P = 0.0767, mCherry vs. hM4Di: P = 0.1486). k Representative images of the hippocampal CA1 sub-region. (Green, NeuN+, scale bars, 250 and 50 μm, respectively). l Quantification of CA1 pyramidal neurons. The statistical analysis was performed by two-way ANOVA (interaction: P = 0.023*, Sham vs. TGI-10 min: P = 0.0016**, mCherry vs. hM4Di: P = 0.0108*) with post hoc Dunnett's test (mCherry/TGI-10 min vs. hM4Di/TGI-10 min, P = 0.0032**, hM4Di/Sham vs. hM4Di/TGI-10 min, P = 0.0006***). mCherry/Sham (n = 7), mCherry/TGI-10 min (n = 7), hM4Di/Sham (n = 8) and hM4Di/TGI-10 min (n = 8). Data are displayed as means ± s.e.m
Fig. 6
Fig. 6
Chemogenetic enhancement of Th:LC-CA1 circuit alleviates CSDS-worsened TGI. a Schematic representation of viral vectors. b AAV-DIO-hM3Dq-mCherry (or AAV-DIO-mCherry) and AAV-TH-Cre viruses were bilaterally injected into the LC region. c Experimental procedures. d Spatial learning curves in the MWM test (RM two-way ANOVA, interaction: P = 0.0333*, time: P < 0.0001***, treatment: P < 0.0001***). mCherry/Sham (n = 10), mCherry/TGI-10 min (n = 10), hM3Dq/Sham (n = 10), hM3Dq/TGI-10 min (n = 10). e The latency of mice to reach a hidden platform on day 6 (two-way ANOVA, interaction: P < 0.0001***, Sham vs. TGI-10 min: P = 0.005**, mCherry vs. hM3Dq: P = 0.0009***; post hoc Dunnett's test, mCherry/TGI-10 min vs. hM3Dq/TGI-10 min, P < 0.0001***, mCherry/Sham vs. mCherry/TGI-10 min, P < 0.0001***). f Summary of the distance during the 6-day training (RM two-way ANOVA, interaction: P = 0.0055**, time: P < 0.0001***, treatment: P < 0.0001***). g The swimming length on day 6 (two-way ANOVA, interaction: P = 0.0001***, Sham vs. TGI-10 min: P = 0.0035**, mCherry vs. hM3Dq: P = 0.0003***; post hoc Dunnett's test, mCherry/ TGI-10 min vs. hM3Dq/TGI-10 min, P < 0.0001***, mCherry/Sham vs. mCherry/TGI-10 min, P < 0.0001***). h Representative swimming traces on day 7. i Percentage of the time spent in the target quadrant on day 7 (two-way ANOVA, interaction: P = 0.0326*, Sham vs. TGI-10 min: P = 0.0008***, mCherry vs. hM3Dq: P = 0.0359*; post hoc Dunnett's test, mCherry/TGI-10 min vs. hM3Dq/TGI-10 min, P = 0.0099**, mCherry/Sham vs. mCherry/TGI-10 min, P = 0.0006***). j Total distance on day 7 (two-way ANOVA, interaction: P = 0.4254, Sham vs. TGI-10 min: P = 0.1775, mCherry vs. hM3Dq: P = 0.6313). k Representative fluorescent images of the CA1 area (green, NeuN+) in mCherry/Sham, mCherry/TGI-10 min, hM3Dq/Sham and hM3Dq/TGI-10 min group. mCherry/Sham (n = 8), mCherry/TGI-10 min (n = 8), hM3Dq/Sham (n = 8), hM3Dq/TGI-10 min (n = 7). l Quantification of CA1 pyramidal neurons. Statistical analysis was performed by two-way ANOVA (interaction: P = 0.0239*, Sham/TGI-10 min factor: P = 0.0067**, mCherry/hM3Dq factor: P = 0.0446*) with post hoc Dunnett's test (mCherry/TGI-10 min vs. hM3Dq/TGI-10 min, P = 0.0114*, mCherry/Sham vs. mCherry/TGI-10 min, P = 0.0019**). All data were displayed as means ± s.e.m
Fig. 7
Fig. 7
Th:LC-CA1 circuit activation relieves CFS-induced TGI susceptibility. a Schematic representation of the construct of the AAV-DIO-hM3Dq-mCherry and AAV-TH-Cre virus. b The mixture viruses including AAV-DIO-hM3Dq-mCherry and AAV-TH-Cre were bilaterally injected into LC area. c Experimental timeline. d The immobility time by FST. Control (n = 15), CFS (n = 18). Unpaired two-tailed Student’s t test, P = 0.0086**. e Spatial learning curves in the MWM test (RM two-way ANOVA, interaction: P = 0.0029**, time: P < 0.0001***, treatment: P < 0.0001***). f Escape latency on day 6. Control/Saline (n = 9), Control/CNO (n = 6), CFS/Saline (n = 7), CFS/CNO (n = 11). Two-way ANOVA, interaction: P < 0.0001***, Control vs. CFS: P = 0.0007***, Saline vs. CNO: P = 0.0002***; post hoc Dunnett's test, CFS/Saline vs. CFS/CNO, P < 0.0001***, Control/Saline vs. CFS/Saline, P < 0.0001***. g Total distance during the 6-day training (RM two-way ANOVA, interaction: P = 0.2195, time: P < 0.0001***, treatment: P < 0.0001***). h Swimming length on day 6. Two-way ANOVA, interaction: P < 0.0001***, Control vs. CFS: P < 0.0001***, Saline vs. CNO: P < 0.0001***; post hoc Dunnett's test, CFS/Saline vs. CFS/CNO, P < 0.0001***, Control/Saline vs. CFS/Saline, P < 0.0001***. i Representative swimming traces on day 7. j Percentage of the time spent in the target quadrant on day 7. Two-way ANOVA, interaction: P = 0.0045**, Control/CFS factor: P = 0.0444*, Saline/CNO factor: P = 0.0195*; post hoc Dunnett's test, CFS/Saline vs. CFS/CNO, P = 0.0009***, Control/Saline vs. CFS/Saline, P = 0.0027**. k Total distance on day 7. Two-way ANOVA, interaction: P = 0.2149, Control vs. CFS: P = 0.9044, Saline vs. CNO: P = 0.9001. l Representative fluorescent images of the CA1 region (NeuN+ as green). m Quantification of CA1 neuronal survival. Control/Saline (n = 7), Control/CNO (n = 8), CFS/Saline (n = 7), CFS/CNO (n = 7). Two-way ANOVA, interaction: P = 0.0182*, Control vs. CFS: P = 0.0004***, Saline vs. CNO: P = 0.0143*; with post hoc Dunnett's test, CFS/Saline vs. CFS/CNO, P = 0.0039**, Control/Saline vs. CFS/Saline, P = 0.0003***. Data were displayed as means ± s.e.m

Similar articles

Cited by

References

    1. Easton JD, et al. Definition and evaluation of transient ischemic attack: a scientific statement for healthcare professionals from the American Heart Association/American Stroke Association Stroke Council; Council on Cardiovascular Surgery and Anesthesia; Council on Cardiovascular Radiology and Intervention; Council on Cardiovascular Nursing; and the Interdisciplinary Council on Peripheral Vascular Disease. The American Academy of Neurology affirms the value of this statement as an educational tool for neurologists. Stroke. 2009;40:2276–2293. doi: 10.1161/STROKEAHA.108.192218. - DOI - PubMed
    1. Kirino T. Delayed neuronal death in the gerbil hippocampus following ischemia. Brain Res. 1982;239:57–69. doi: 10.1016/0006-8993(82)90833-2. - DOI - PubMed
    1. Pulsinelli WA, Brierley JB, Plum F. Temporal profile of neuronal damage in a model of transient forebrain ischemia. Ann. Neurol. 1982;11:491–498. doi: 10.1002/ana.410110509. - DOI - PubMed
    1. Block F. Global ischemia and behavioural deficits. Prog. Neurobiol. 1999;58:279–295. doi: 10.1016/S0301-0082(98)00085-9. - DOI - PubMed
    1. Nusbaum MP, Blitz DM, Marder E. Functional consequences of neuropeptide and small-molecule co-transmission. Nat. Rev. Neurosci. 2017;18:389–403. doi: 10.1038/nrn.2017.56. - DOI - PMC - PubMed

Publication types