. 2019 Jul 3;10(1):2939.
doi: 10.1038/s41467-019-10901-x.

E2F4 regulates transcriptional activation in mouse embryonic stem cells independently of the RB family

Affiliations

E2F4 regulates transcriptional activation in mouse embryonic stem cells independently of the RB family

Jenny Hsu et al. Nat Commun. .

Abstract

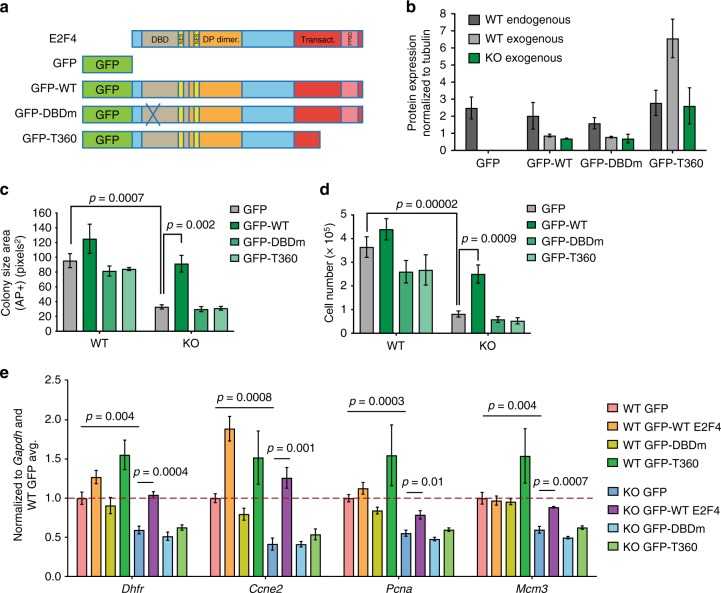
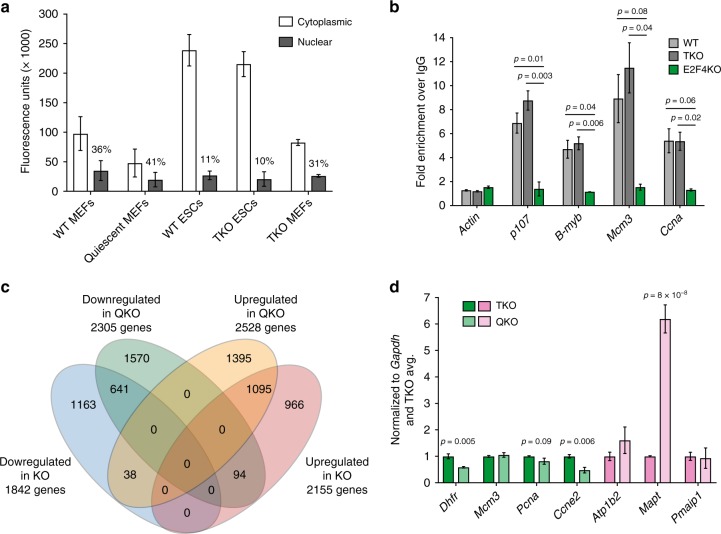
E2F transcription factors are central regulators of cell division and cell fate decisions. E2F4 often represents the predominant E2F activity in cells. E2F4 is a transcriptional repressor implicated in cell cycle arrest and whose repressive activity depends on its interaction with members of the RB family. Here we show that E2F4 is important for the proliferation and the survival of mouse embryonic stem cells. In these cells, E2F4 acts in part as a transcriptional activator that promotes the expression of cell cycle genes. This role for E2F4 is independent of the RB family. Furthermore, E2F4 functionally interacts with chromatin regulators associated with gene activation and we observed decreased histone acetylation at the promoters of cell cycle genes and E2F targets upon loss of E2F4 in RB family-mutant cells. Taken together, our findings uncover a non-canonical role for E2F4 that provide insights into the biology of rapidly dividing cells.


Conflict of interest statement

The authors declare no competing interests.

Figures

Fig. 1
Fig. 1
Loss of E2F4 leads to defects in mouse ES cell growth. a Representative brightfield images (scale bar, 400 µm) and alkaline phosphatase (AP) staining (wells from a 6-well plate are shown) of wild-type (WT) and E2F4KO (KO) colonies one week after plating single cells (n > 10 assays per genotype). b Quantification of the size of AP+ colonies (unpaired t-test; n = 3 biological replicates per clone). c Comparison of the area of AP staining (undifferentiated cells) versus Giemsa staining (all cells) in an independent set of colonies (n = 3 biological replicates per clone) (no significant differences). d Size of WT and E2F4KO individual cells as estimated by forward scatter in flow cytometric analysis (unpaired t-test; n = 2 biological replicates per clone). e Total number of cells per 10 cm dish one week after plating at low density (unpaired t-test; n = 3 biological replicates per clone). Data shown as the mean and standard error of the mean
Fig. 2
Fig. 2
E2F4 mutant mouse ES cells are defective for cell cycle and cell survival. a Quantification of the percentage of cells in G1, S, and G2/M phases based on BrdU/PI FACS analysis (unpaired t-test; n = 2 biological replicates with 2 wild-type (WT) and 4 E2F4KO (KO) clones), performed after 4 days of low density plating. b Schematic of synchronizing mESCs in G0 using the Myc inhibitor (Myci) 10085-F4 (left), and quantification of the percentage of cells in G0/G1 in WT, E2F4KO (KO), and RB family triple knockout (TKO)  populations at 24 and 48 h of treatment (unpaired t-test; n = 2–3 biological replicates with 2 clones of each genotype). c Quantification of the percentage of arrested and cycling cells post-release from Myci. Cell cycle structure was measured with BrdU/PI staining 6, 8, 10, and 12 h after withdrawal of Myci from the media (unpaired t-test was performed with all individual data points from n = 3–4 biological replicates with 1–2 clones of each genotype). d Quantification of the percentage of AnnexinVneg/PIneg cells (live cells) in WT and E2F4KO populations 4 days after low density plating (unpaired t-test; n = 3 biological replicates per clone). Data shown as the mean and standard error of the mean
Fig. 3
Fig. 3
Loss of E2F4 leads to genome-wide changes in gene expression. a Volcano plot of changes in gene expression upon E2F4 loss in mouse ES cells; y-axis represents -log10 transformation of p-value and x-axis represents log2 transformation of fold change. Red circles represent significantly changed genes (q-value < 0.05) while orange circles represent significantly changed genes with a fold change > 0.5 (log2). b Overlap between E2F4 targets in mouse ES cells  and genes differentially expressed in E2F4KO (KO)cells with respect to wild-type. c GO terms for biological processes enriched in genes downregulated in E2F4KO cells (q-value < 0.05, fold change > 0.5 (log2)). GO terms were filtered for redundancy through REVIGO and the top 20 most significant are shown. d RT-qPCR validation of differentially expressed genes. Expression of downregulated genes in WT (dark green) and E2F4KO cells (light green); and upregulated genes in WT (pink) and E2F4KO cells (light pink), was normalized to Gapdh expression and then to expression levels in WT cells (unpaired t-test was performed with all individual data points from n = 2–4 biological replicates with 2 WT and 2 E2F4KO clones). Data shown as the mean and standard error of the mean
Fig. 4
Fig. 4
The transactivation and DNA binding domains of E2F4 are required for its function in mouse ES cells. a Schematic of the design of E2F4 mutant constructs. All constructs were fused C-terminal to a GFP tag. Wild-type (WT) E2F4 contains a DNA binding domain (DBD), a dual nuclear export signal (NES), a DP dimerization domain, a transactivation domain, and an RB family/pocket proteins binding domain (PPBD). GFP-DBD contains three point mutations that make contacts with the E2F consensus binding motif and the DP dimerization partners. GFP-T360 is a truncation mutant that lacks the last 50 amino acid residues, inactivating the transactivation domain. b Quantification of endogenous and exogenous E2F4 expression by immunoassay (from fluorescence units) in WT (gray) and E2F4KO (KO, green) cells (n = 2 biological replicates with 1 WT and 1 E2F4KO clone). c Quantification of colony size by AP staining (unpaired t-test was performed with all individual data points from n = 2 biological replicates with 2 WT and 2 E2F4KO clones in each replicate) and d Total number of cells per well in 6-well plates one week after plating at low density (unpaired t-test was performed with all individual data points from n = 4 biological replicates with 2 WT and 2 E2F4KO clones in each replicate). e RT-qPCR analysis of E2F4 targets and canonical cell cycle genes. Expression of genes in WT and E2F4KO cells expressing each of the constructs, was normalized to Gapdh expression and then to expression levels in WT cells expressing GFP (unpaired t-test was performed with all individual data points from n = 2 biological replicates with 2 WT and 2 E2F4KO clones in each replicate). Data shown as the mean and standard error of the mean
Fig. 5
Fig. 5
Loss of E2F4 leads to defects in the growth of RB family TKO mouse ES cells. a Representative brightfield images (scale bar, 400 µm) and alkaline phosphatase (AP) staining (wells from a 6-well plate are shown) of RB family triple knockout (TKO) and RB family knockout, E2F4KO (QKO) colonies one week after plating single cells (n > 10 assays per genotype). b Quantification of the size of AP+ colonies (unpaired t-test; n = 2 biological replicates per clone). c Total number of cells per 10 cm dish one week after plating at low density (unpaired t-test; n = 2 biological replicates per clone). d Quantification of the percentage of cells in G1, S, and G2/M phases based on BrdU/PI FACS analysis (unpaired t-test; n = 2–3 biological replicates with 2 TKO and 2 QKO clones), performed 4 days after low density plating. e Quantification of  the percentage of AnnexinVneg/PIneg cells (live cells) in TKO and QKO populations 4 days after low density plating (unpaired t-test; n = 2 biological replicates per clone). Error bars represent ± s.e.m. Data shown as the mean and standard error of the mean
Fig. 6
Fig. 6
E2F4 can access chromatin and regulate target genes in an RB family-independent manner. a Quantification of cytoplasmic and nuclear E2F4 expression by immunoassay in cycling and quiescent mouse embryonic fibroblasts (MEFs), WT and TKO mouse ES cells, and TKO MEFs (n = 2–3 biological replicates per cell type). The percentage of nuclear E2F4 is shown. See Supplementary Fig. 9 for fractionation controls. b Quantification of E2F4 binding to target genes and an Actin negative control in WT, TKO, and E2F4KO mouse ES cells, assayed by ChIP-qPCR (unpaired t-test was performed with all individual data points from n = 2–3 biological replicates of 2 WT, 2 TKO, and 1 E2F4KO clone(s)). Binding was normalized to 10% input and then to binding of an IgG control. c Overlap of genes that are differentially expressed in QKO versus TKO mouse ES cells, and genes that are differentially expressed in E2F4KO (KO) versus wild-type (WT) mouse ES cells (q-value < 0.05 with a fold change > 0.5 (log2)). The sets of upregulated (1095) and downregulated (641) genes between E2F4KO/WT and QKO/TKO mouse ES cells are highly similar (p-value close to zero). d RT-qPCR validation of differentially expressed genes. Expression of downregulated genes in TKO (dark green) and QKO mouse ES cells (light green); and upregulated genes in TKO (pink) and QKO mouse ES cells (light pink), was normalized to Gapdh expression and then to expression levels in TKO cells (unpaired t-test was performed with all individual data points from n = 2–4 biological replicates with 2 TKO and 2 QKO clones). Data shown as the mean and standard error of the mean
Fig. 7
Fig. 7
Transcriptional activation by E2F4 in mouse ES cells is mediated by chromatin modifiers. a Schematic representation of the affinity purification-mass spectrometry approach to identify the E2F4 interactome. b Silver stain of eluted fractions from RPE cells and mouse ES cells . Slices of gel were subjected to mass spectrometry, and the indicated protein bands were identified by analyzing the proteins enriched in each slice. c GO terms for cellular components enriched in the list of mouse ES cell-specific candidate interactors. d Validation of interactions between GFP-E2F4 and DP-1, HCFC1, YEATS2, LIN54, and LIN9, by co-immunoprecipitation followed by immunoassay, in mouse ES cells and human RPE cells. Transcriptional activators (HCFC1 and YEATS2) preferentially bind to E2F4 in mouse ES cells while members of the DREAM repressor complex (LIN54 and LIN9) bind preferentially to E2F4 in RPE cells. Molecular weights (kDa) are indicated on the left side (one experiment shown of at least two experiments)
Fig. 8
Fig. 8
ChIP-seq analysis of the role of E2F4 in gene activation in mouse ES cells. a Heatmap of enrichment scores of H3K9ac and H3K4me3 ChIP-seq signal across transcription start sites (TSS, −1/ + 1 kb) in 2 biological replicates of 2 TKO and 2 QKO clones (biological replicates are next to each other). b Average enrichment of H3K9ac and H3K4me3 signal around TSS (-1/ + 1 kb) in TKO and QKO clones. c Volcano plot showing genome-wide comparison of detected peaks in TKO and QKO cells for H3K9ac and H3K4me3. d, e Average enrichment of H3K9ac (d) and H3K4me3 (e) signal around TSS (−1/+1 kb) comparing all downregulated genes in QKO cells compared to TKO cells, genes that are downregulated and bound by E2F4, and a random set of downregulated genes. f Enrichr analysis of CHEA/ENCODE motifs and KEGG pathways significantly (p < 0.05) enriched in genes with downregulated and upregulated H3K9ac and H3K4me3 signal upon E2F4 loss. Top motifs/pathways (by combined score) are shown

References

    1. Soufi A, Dalton S. Cycling through developmental decisions: how cell cycle dynamics control pluripotency, differentiation and reprogramming. Development. 2016;143:4301–4311. doi: 10.1242/dev.142075. - DOI - PMC - PubMed
    1. Sherr CJ. Cancer cell cycles. Science. 1996;274:1672–1677. doi: 10.1126/science.274.5293.1672. - DOI - PubMed
    1. Campisi J. Senescent cells, tumor suppression, and organismal aging: good citizens, bad neighbors. Cell. 2005;120:513–522. doi: 10.1016/j.cell.2005.02.003. - DOI - PubMed
    1. Trimarchi JM, Lees JA. Sibling rivalry in the E2F family. Nat. Rev. Mol. Cell Biol. 2002;3:11–20. doi: 10.1038/nrm714. - DOI - PubMed
    1. Chen HZ, Tsai SY, Leone G. Emerging roles of E2Fs in cancer: an exit from cell cycle control. Nat. Rev. Cancer. 2009;9:785–797. doi: 10.1038/nrc2696. - DOI - PMC - PubMed

Publication types

MeSH terms