. 2019 Jul 3;10(1):2935.
doi: 10.1038/s41467-019-11002-5.

Iron-dependent histone 3 lysine 9 demethylation controls B cell proliferation and humoral immune responses

Affiliations

Iron-dependent histone 3 lysine 9 demethylation controls B cell proliferation and humoral immune responses

Yuhang Jiang et al. Nat Commun. .

Abstract

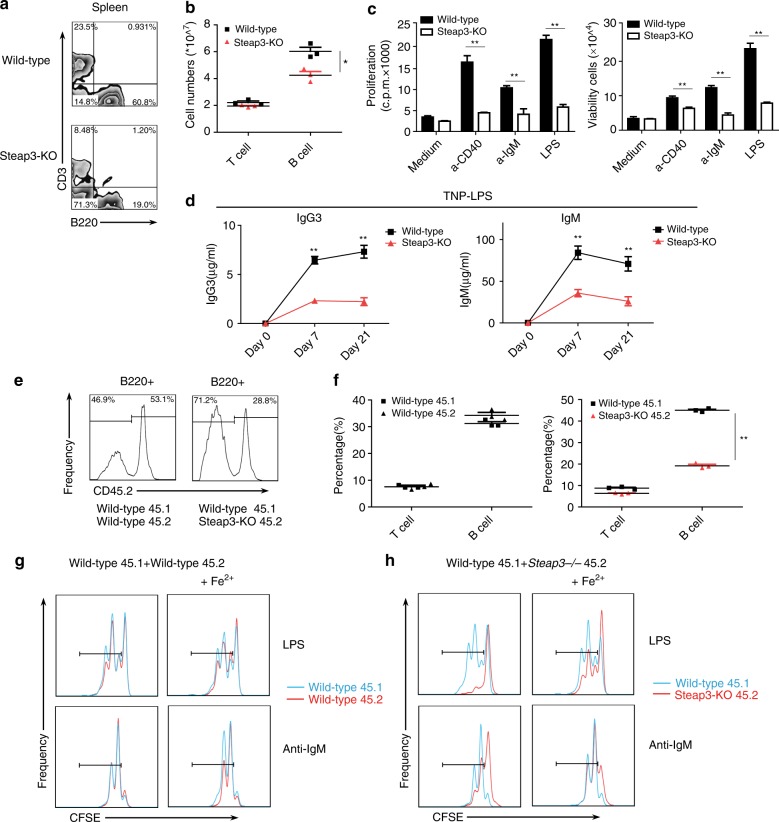
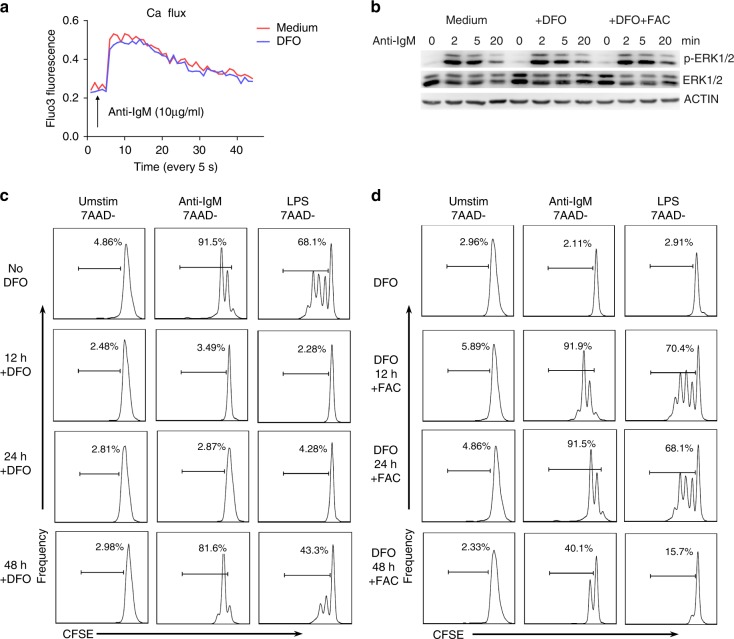
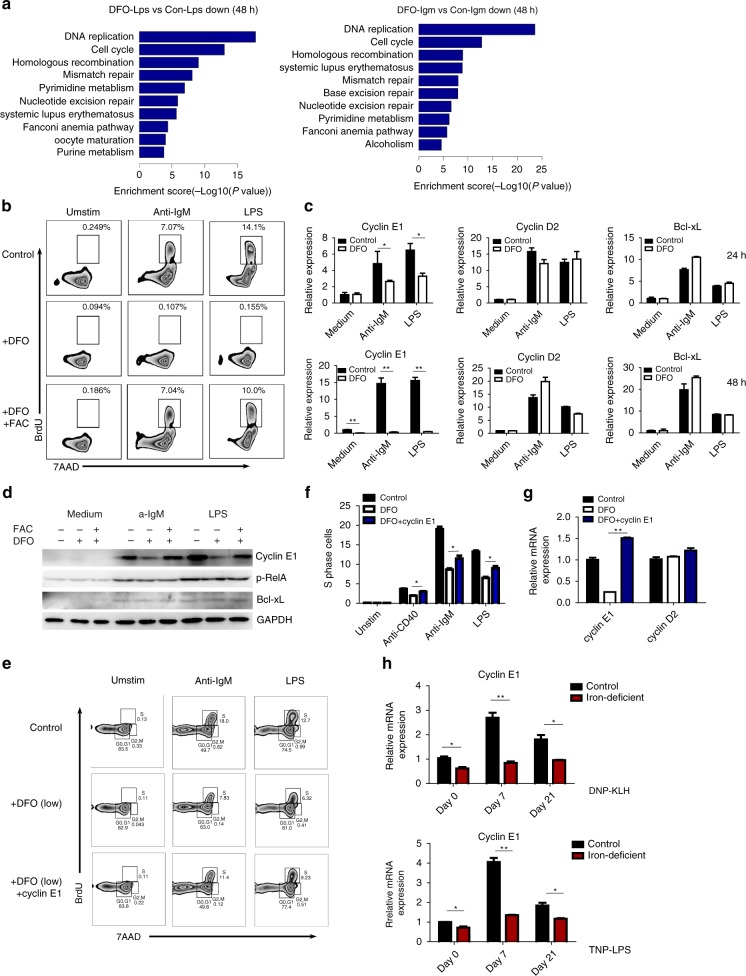
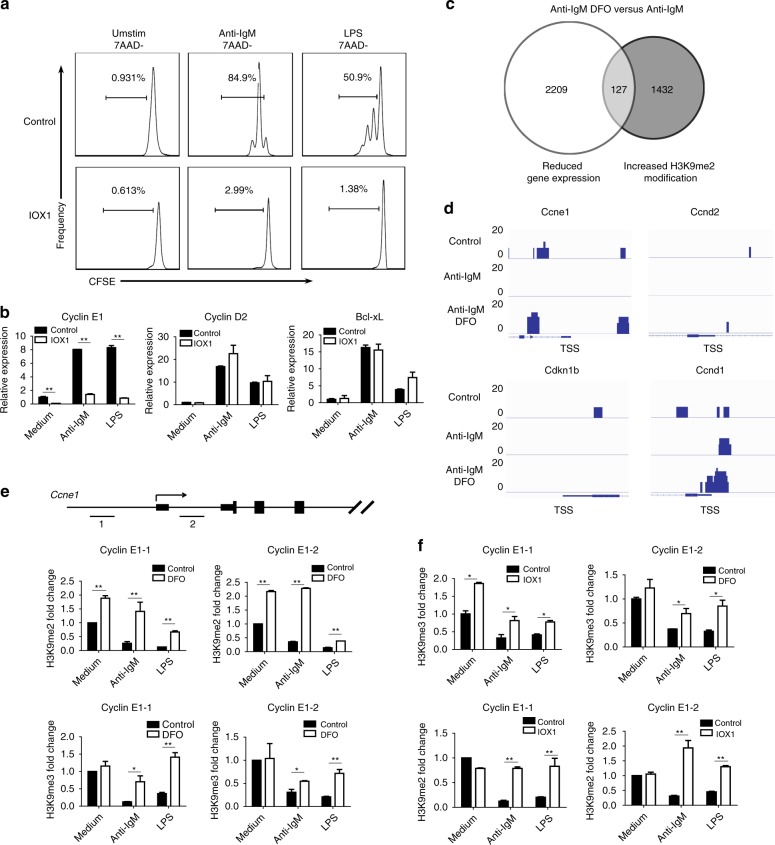
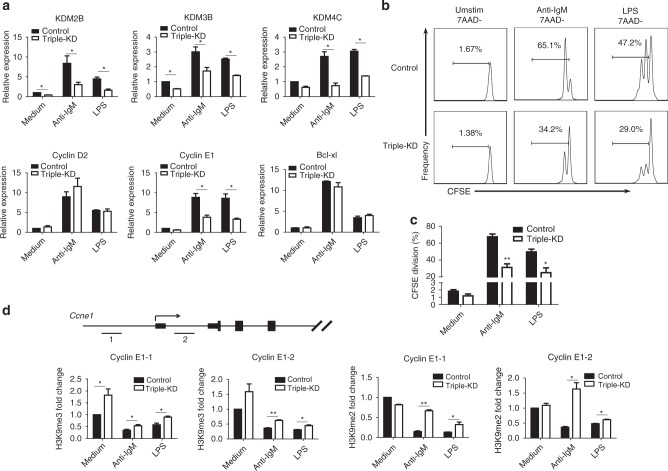
Trace elements play important roles in human health, but little is known about their functions in humoral immunity. Here, we show an important role for iron in inducing cyclin E and B cell proliferation. We find that iron-deficient individuals exhibit a significantly reduced antibody response to the measles vaccine when compared to iron-normal controls. Mice with iron deficiency also exhibit attenuated T-dependent or T-independent antigen-specific antibody responses. We show that iron is essential for B cell proliferation; both iron deficiency and α-ketoglutarate inhibition could suppress cyclin E1 induction and S phase entry of B cells upon activation. Finally, we demonstrate that three demethylases, KDM2B, KDM3B and KDM4C, are responsible for histone 3 lysine 9 (H3K9) demethylation at the cyclin E1 promoter, cyclin E1 induction and B cell proliferation. Thus, our data reveal a crucial role of H3K9 demethylation in B cell proliferation, and the importance of iron in humoral immunity.


Conflict of interest statement

The authors declare no competing interests.

Figures

Fig. 1
Fig. 1
MV response is positively correlated with iron metabolism indicators in humans. a, b MV-specific IgG antibody titers in human patients with iron deficiency (defined as serum iron < 50 μg/dl or TS < 16%) vs. normal subjects. *P < 0.05, **P < 0.01, Student’s t-test. c Serum iron levels and transferrin saturation in individuals with different degrees of MV response. *P < 0.05, **P < 0.01, Student’s t-test. d A linear regression model was used to analyze the relationship between serum iron parameters (serum iron and TS) and MV concentrations in humans. The scatter-plot graphs with error bars indicate the mean ± SEM, and the box and whisker graphs with error bars indicate the range from the minimum value to the maximum value
Fig. 2
Fig. 2
Iron deficiency results in impaired TD and TI immune responses in mice. Three-week-old wild-type C57BL/6J mice (male) were divided into two groups and fed either a control iron-adequate diet (45.4 mg/kg iron) or an iron-deficient diet (0.9 mg/kg iron) for 5 weeks. a Flow cytometry of splenocytes from control and iron-deficient mice stained with anti-B220 to identify peripheral B cells. Bone marrow cells from control and iron-deficient mice were stained with anti-B220, anti-IgM, and anti-IgD antibodies to assess pre- and pro-B cells (IgMIgD), immature B cells (IgM+IgDint), and mature circulating B cells (IgM+IgDhi). b Statistics for the numbers of splenic B cells in the two groups (mean ± SEM of three mice per group). ce Antigen-specific antibody responses of control and iron-deficient mice immunized with DNP-KLH (TD), DNP-Ficoll (TI-2), or TNP-LPS (TI-1). Serum was collected preimmunization and at 7 days and 21 days after immunization. In the case of DNP-KLH, the mice were rechallenged at day 21 as indicated by the arrow, and serum was collected at day 28 and to a long-term at day 60 (the data represent the mean ± SEM of four mice per group). f Control and iron-deficient mice were immunized with SRBCs, DNP-KLH or PBS as a control, and at day 10, splenocytes were stained with anti-B220, anti-IgD, anti-GL7, and anti-CD95 (Fas) antibodies to assess the GCB cells (B220+IgDlowGL7+Fas+). g Statistics for the proportions of GCB cells in mice immunized with DNP-KLH or SRBCs (mean ± SEM of three mice per group). h Frozen sections of spleens from mice immunized with SRBCs were stained with anti-IgD antibody and PNA to identify germinal center reactions. The data were representative of at least two independent experiments. *P < 0.05, **P < 0.01, Student’s t-test
Fig. 3
Fig. 3
Defective mature B-cell population and proliferation in Steap3-KO mice. a Flow cytometry of splenocytes from wild-type and Steap3-KO mice was used to identify CD3 + T cells and B220 + B cells. b Statistics for the numbers of splenic B and T cells in the two groups (mean ± SEM of three mice per group). c Wild-type or Steap3-KO splenic B cells were stimulated with anti-CD40 (1 μg/ml), anti-IgM (10 μg/ml), or LPS (2 μg/ml), and proliferation was assessed by [3H] thymidine incorporation (b, top). Viable B cells were counted 48 h after stimulation (b, top). d ELISA to check antigen-specific antibody responses of wild-type and Steap3-KO mice 7 days and 21 days after immunization with TNP-LPS (the data represent the mean ± SEM of four mice per group). CD45.1 + wild-type bone marrow cells were mixed 1:1 with CD45.2 + wild-type or Steap3-KO bone marrow cells and cotransferred into irradiated wild-type C57BL/6J recipient mice. Six weeks later, e flow cytometry of splenocytes from recipient mice was conducted to compare the quantity of CD45.1 + wild-type B cells with that of CD45.2 + wild-type or Steap3-KO B cells. The splenocytes were further stained with anti-CD21 and anti-CD23 antibodies to evaluate MZB cells and FOB cells. f Statistics obtained for CD45.1 + or CD45.2 + T cells and B cells in the spleens of recipient mice (mean ± SEM of three mice per group). g, h Splenic B cells from recipient mice containing CD45.1 + and CD45.2 + B cells were labeled with CFSE, cultured and stimulated with anti-IgM (10 μg/ml) or LPS (2 μg/ml). The right panel shows the results after additional Fe2 + (ferrous iron) was added to the medium. B-cell proliferation was assessed by CFSE dilution, and the portion of cells that underwent at least one cellular division are outlined. The data were representative of three mice or two independent experiments. *P < 0.05, **P < 0.01, Student’s t-test
Fig. 4
Fig. 4
Iron is required for rapid B-cell proliferation and plasma cell formation in vitro. a Proliferation of splenic B cells cultured in normal medium or in the presence of DFO (20 μM), DFO accompanied by FAC (100 μM), or FAC alone (100 μM) and unstimulated or stimulated with anti-CD40 (1 μg/ml), anti-IgM (10 μg/ml) or LPS (2 μg/ml) for 72 h. B-cell proliferation was assessed by [3H] thymidine incorporation. b The number of viable B cells in a was counted. c Cell division (CFSE dilution) of CFSE-labeled B cells unstimulated or stimulated with anti-IgM (10 μg/ml) or LPS (2 μg/ml) under different iron conditions. Cells that underwent at least one cellular division are outlined. d Cell survival (7AAD-) and cell division of CFSE-labeled splenic B cells unstimulated or stimulated with anti-CD40 (1 μg/ml) or BAFF (100 ng/ml) in the presence or absence of DFO (20 μM). e Splenic B cells were purified from wild-type C57BL/6 mice, stimulated for 5 days with LPS under different iron conditions, and stained with anti-B220 and anti-CD138 (a plasma cell marker). The outlined areas indicate plasma cells (B220lowCD138+). f Human B cells were isolated from peripheral blood of iron-deficient subjects and iron-normal subjects, cultured in 20% autologous serum conditions and cell proliferation in response to TLR stimulation were assessed. g Serum iron level and TS examination data of the two iron-deficient subjects and two iron-normal subjects. Red line indicates minimum normal value of serum iron and TS in human. h, i Statistics for divided B cells in f. The data were representative of two independent experiments. *P < 0.05, **P < 0.01, Student’s t-test
Fig. 5
Fig. 5
Iron is essential only for the middle and late stages of BCR- and TLR-induced B-cell proliferation. a Intracellular calcium flux in control and iron-deficient (pretreated with 20 µM DFO for 2 h) resting B cells purified from wild-type C57BL/6 splenocytes in response to BCR stimulation. b Control and iron-deficient (pretreated with 20 µM DFO for 2 h) B cells were stimulated with anti-IgM (10 µg/ml) for 0–20 min. At the indicated time points, the cells were immediately collected, washed, and lysed. Subsequently, the phosphorylation of ERK1/2 was measured by immunoblotting. c CFSE-labeled splenic B cells from wild-type mice were unstimulated or stimulated with anti-IgM and LPS, and cell proliferation was assessed by CFSE dilution at 72 h. During this process, DFO (20 µM) was added to the culture medium at different time points to deplete iron. d CFSE-labeled iron-deficient B cells (in the presence of 20 µM DFO) were stimulated as in c, and cell proliferation was assessed at 72 h. During this process, FAC was added to the culture medium at different time points to restore the iron supply. The data are representative of three independent experiments
Fig. 6
Fig. 6
Iron is responsible for S Phase entry and cyclin E1 induction during B-cell proliferation. a Microarray analysis of global gene expression in control and iron-deficient B cells that were unstimulated or stimulated with anti-IgM (10 μg/ml) or LPS (2 μg/ml) for 48 h. Pathway analysis was conducted to map genes that were associated with Kyoto Encyclopedia of Genes and Genomes (KEGG) pathways. b B cells cultured and stimulated as in a were cocultured with 10 μM BrdU for the last 45 min, stained with anti-BrdU and 7AAD, and analyzed by flow cytometry. The outlined areas represent the percentage of cells in S phase (with BrdU incorporation during DNA replication). c The mRNA levels of cyclin D2, cyclin E1, and Bcl-xL were measured by qRT-PCR in control and iron-deficient B cells that were cultured and stimulated as described in a. d Immunoblot analysis of cyclin E1, Bcl-xL, and phos-RelA in splenic B cells cultured in normal medium or in the presence of DFO (20 μM) or DFO with FAC (50 μM) under the indicated conditions for 48 h. e Splenic B cells from wild-type C57BL/6 mice in low-DFO conditions (10 µM) were infected with cyclin E1 overexpression lentivirus, and BrdU incorporation was analyzed by flow cytometry following anti-IgM (10 μg/ml) or LPS (2 μg/ml) stimulation for 48 h. f Statistics for the percentage of B cells proceeding through DNA replication and entering S phase. g Cyclin E1 and cyclin D2 mRNA were checked by qRT-PCR in control and cyclin E1-overexpression B cells. h qRT-PCR of cyclin E1 mRNA expression in splenic B cells isolated from control and iron-deficient mice immunized with DNP-KLH or TNP-LPS. The data are representative of two independent experiments. All graphs with error bars indicate the mean ± SEM, *P < 0.05, **P < 0.01, Student’s t-test
Fig. 7
Fig. 7
Iron deprivation impairs Cyclin E1 induction through inhibiting H3K9me3/2 demethylation. a Flow cytometry of CFSE-labeled B-cell proliferation following stimulation with anti-IgM (10 µg/ml) or LPS (2 µg/ml) for 72 h in the presence of the 2-OG inhibitor IOX1 (100 µM) or dimethyl sulfoxide (DMSO) as a control. b Results of qRT-PCR to analyze cyclin E1, cyclin D2, and Bcl-xL induction 48 h after anti-IgM or LPS stimulation in control and 2-OG-inhibited B cells. c Venn diagram indicating the overlap of genes with reduced expression and increased H3K9me2 modifications in iron-deficient B cells. d ChIP-seq analysis of H3K9me2 modifications in control and iron-deficient B cells post BCR stimulation. The results for four representative cell cycle-related genes are shown in the graph. e Results of ChIP-qRT-PCR to confirm changes in H3K9me3/H3K9me2 modification near the TSS of cyclin E1 in control and iron-deficient B cells following BCR or TLR stimulation for 48 h. The numbers and horizontal lines show the locations of the ChIP-qRT-PCR primers. f ChIP-qRT-PCR to analyze changes in H3K9me3/2 near the cyclin E1 TSS in control and 2-OG-inhibited B cells 48 h post stimulation. All graphs with error bars indicate the mean ± SEM, and *P < 0.05, **P < 0.01, Student’s t-test
Fig. 8
Fig. 8
Triple-KD of three JmjC-demethylases reduces H3K9me3/2 demethylation and inhibits B-cell proliferation. shRNA lentiviruses targeting KDM2B, KDM3B, and KDM4C were mixed and used to infect splenic B cells. a The expression of cyclin E1, cyclin D2, Bcl-xL, and the three demethylases was analyzed by qRT-PCR 48 h after anti-IgM and LPS stimulation. b CFSE-labeled splenic B cells were infected with the shRNA lentivirus mixture, and cell proliferation was analyzed by flow cytometry at 72 h after anti-IgM and LPS stimulation. c Statistics for the percentage of B cells that underwent division following infection with the shRNA lentivirus mixture or control. d Changes in H3K9me2 at the cyclin E1 promoter were analyzed by ChIP-qPCR. All graphs with error bars indicate the mean ± SEM, *P < 0.05, **P < 0.01, Student’s t-test

References

    1. Chandra RK. Nutrition and the immune system from birth to old age. Eur. J. Clin. Nutr. 2002;56:S73–S76. doi: 10.1038/sj.ejcn.1601492. - DOI - PubMed
    1. Fleming MD, et al. Microcytic anaemia mice have a mutation in Nramp2, a candidate iron transporter gene. Nat. Genet. 1997;16:383–386. doi: 10.1038/ng0897-383. - DOI - PubMed
    1. Fleming MD, et al. Nramp2 is mutated in the anemic Belgrade (b) rat: evidence of a role for Nramp2 in endosomal iron transport. Proc. Natl Acad. Sci. USA. 1998;95:1148–1153. doi: 10.1073/pnas.95.3.1148. - DOI - PMC - PubMed
    1. Gunshin H, et al. Cloning and characterization of a mammalian proton-coupled metal-ion transporter. Nature. 1997;388:482–488. doi: 10.1038/41343. - DOI - PubMed
    1. Jabara HH, et al. A missense mutation in TFRC, encoding transferrin receptor 1, causes combined immunodeficiency. Nat. Genet. 2016;48:74–78. doi: 10.1038/ng.3465. - DOI - PMC - PubMed

Publication types

MeSH terms