. 2019 Jul 3;9(1):9624.
doi: 10.1038/s41598-019-46045-7.

Functional and metabolic impairment in cigarette smoke-exposed macrophages is tied to oxidative stress

Affiliations

Functional and metabolic impairment in cigarette smoke-exposed macrophages is tied to oxidative stress

Daniel S Aridgides et al. Sci Rep. .

Abstract

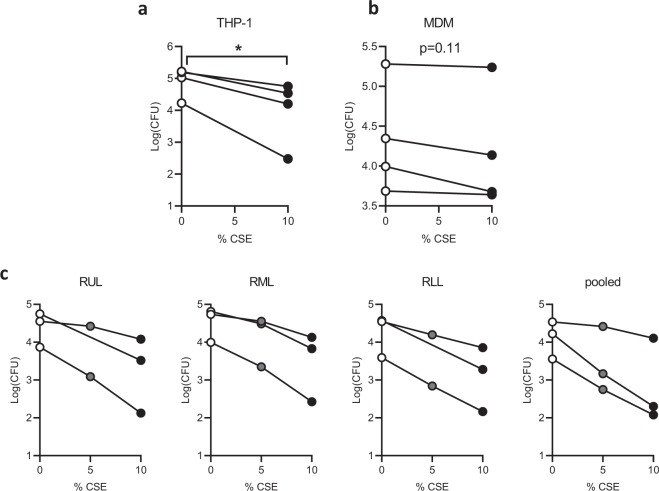
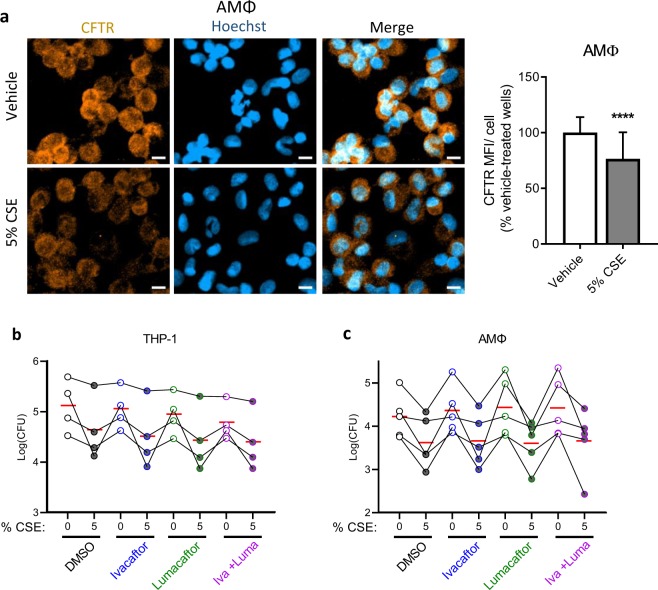
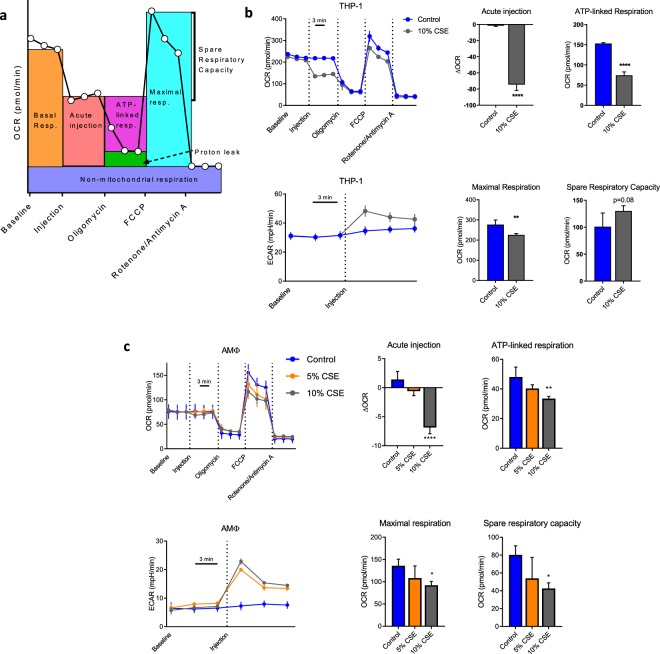
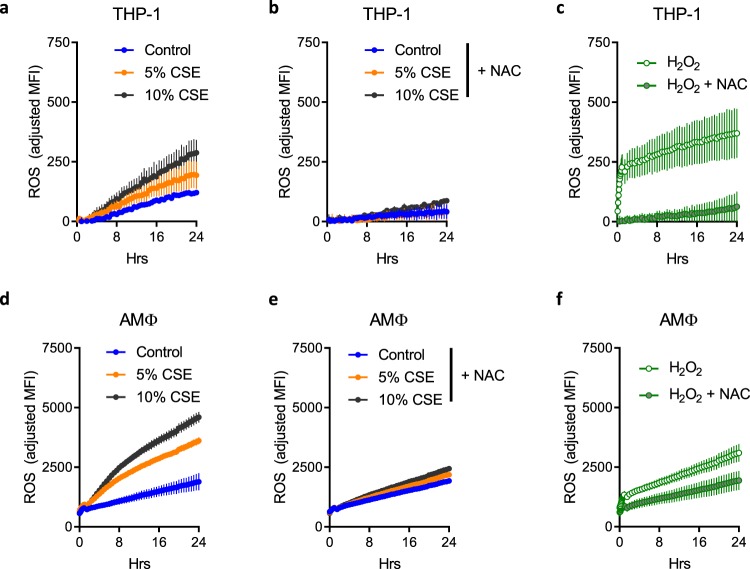
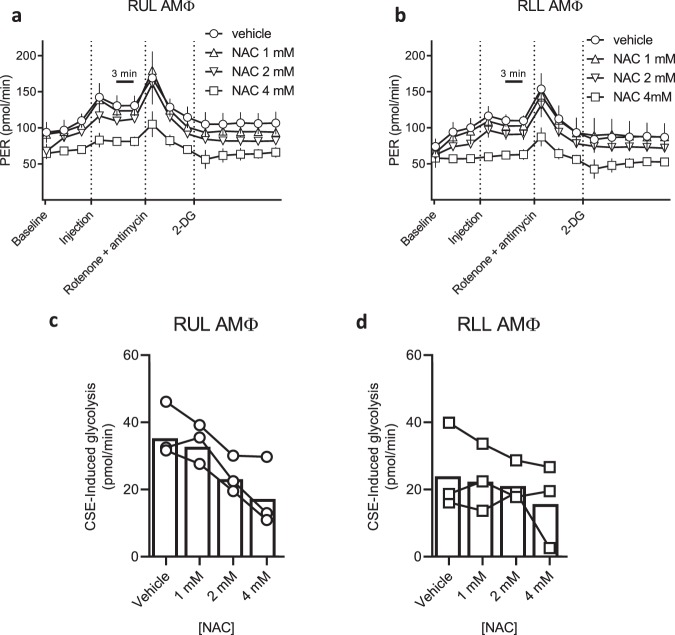
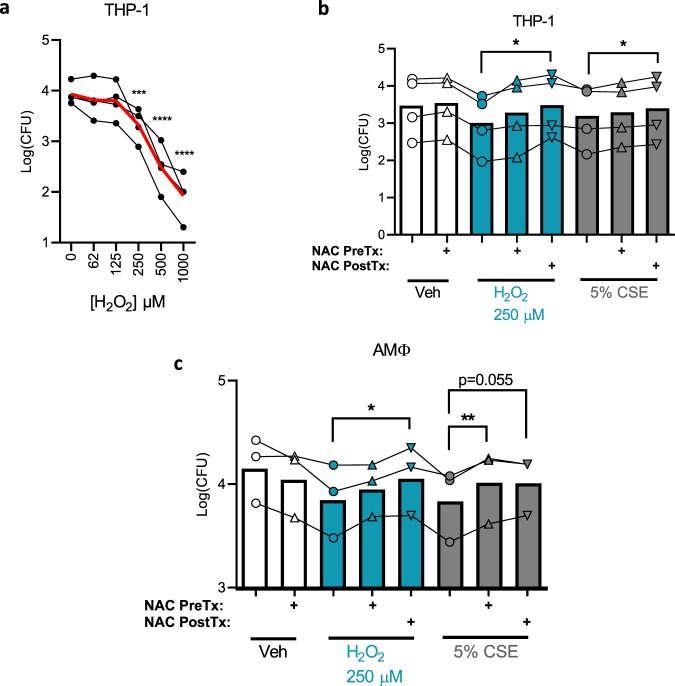
Cigarette smoke inhalation exposes the respiratory system to thousands of potentially toxic substances and causes chronic obstructive pulmonary disease (COPD). COPD is characterized by cycles of inflammation and infection with a dysregulated immune response contributing to disease progression. While smoking cessation can slow the damage in COPD, lung immunity remains impaired. Alveolar macrophages (AMΦ) are innate immune cells strategically poised at the interface between lungs, respiratory pathogens, and environmental toxins including cigarette smoke. We studied the effects of cigarette smoke on model THP-1 and peripheral blood monocyte derived macrophages, and discovered a marked inhibition of bacterial phagocytosis which was replicated in primary human AMΦ. Cigarette smoke decreased AMΦ cystic fibrosis transmembrane conductance regulator (CFTR) expression, previously shown to be integral to phagocytosis. In contrast to cystic fibrosis macrophages, smoke-exposed THP-1 and AMΦ failed to augment phagocytosis in the presence of CFTR modulators. Cigarette smoke also inhibited THP-1 and AMΦ mitochondrial respiration while inducing glycolysis and reactive oxygen species. These effects were mitigated by the free radical scavenger N-acetylcysteine, which also reverted phagocytosis to baseline levels. Collectively these results implicate metabolic dysfunction as a key factor in the toxicity of cigarette smoke to AMΦ, and illuminate avenues of potential intervention.


Conflict of interest statement

The authors declare no competing interests.

Figures

Figure 1
Figure 1
CSE inhibits phagocytosis of Pseudomonas aeruginosa by immortalized and primary macrophages. (a) THP-1 cells were treated with 50 nM PMA for 48 hours to differentiate into macrophages, then phagocytosis was quantified by a gentamicin protection assay. Cells were cultured in standard medium without antibiotics, pre-treated with 10% CSE or media vehicle for 20 min, then infected with log-phase P. aeruginosa at a multiplicity of infection (MOI) of 10 for 20 min. They were then washed and 10x gentamicin was added to kill extracellular bacteria. Three additional washes were performed and cells were lysed in 0.1% triton X-100 in PBS. Colony forming units (CFU) were quantified on LB agar plates and CFU per million macrophages was calculated, log(mean CFU) for four individual experiments are graphed with lines connecting replicates from an individual experiment. *p < 0.05 by paired t-test (b) Primary human peripheral blood monocytes were differentiated into monocyte-derived macrophages (MDM) by treatment for 7 days with 100 ng/mL M-CSF, followed by a gentamicin protection assay as in a. Means of triplicate technical replicates from four independent experiments (separate donors) are graphed. (c) Primary alveolar macrophages (AMΦ) were purified from right upper lobe (RUL), right middle lobe (RML), or RLL (RLL) bronchoalveolar lavage, followed by phagocytosis assays after pretreatment with vehicle, 5% CSE or 10% CSE (5% point was omitted from RUL and RLL replicates of one donor due to limited cell number). Means of triplicate technical replicates from three separate donors are graphed. CSE significantly reduced phagocytosis (p < 10−15) based on a linear model of log10 CFU as a function of CSE concentration, experimental batch and location in the lung.
Figure 2
Figure 2
CSE decreases CFTR expression while CFTR modulators fail to rescue phagocytosis. (a) Primary AMΦ from healthy donors were plated overnight onto glass slide chambers. The following morning they were treated with vehicle or 5% CSE for one hour. They were then washed, fixed in methanol, and stained for CFTR and counterstained with Hoechst. Three 20x fields in three separate wells for each condition were imaged, mean orange fluorescence was calculated and divided by the number of cell nuclei/field then normalized to vehicle-treated wells. Mean and standard deviations from five independent experiments from different donors with 6–9 fields imaged from each are graphed, ****p < 0.0001 by Mann-Whitney test. Scale bars = 10 μm. (b) Phagocytosis assay was performed with THP-1 cells as in Fig. 1 except cells were pre-treated with DMSO, ivacaftor 30 nM, lumacaftor 3 μM or the combination of the two for 48 hrs prior to assay, after differentiation with PMA. Points with connecting lines represent means from four individual experiments, each performed in triplicate. Red horizontal lines indicate mean of the four experiments. Linear models revealed that all three treatments reduced log10 CFU (ivacaftor: p = 0.08; lumacaftor: p < 0.01; 5% CSE: p < 0.001) in THP-1 cells. (c) In AMΦ, only 5% CSE was associated with significant reduction in phagocytosis (p < 0.001).
Figure 3
Figure 3
CSE induces a shift in MΦ from oxidative to glycolytic metabolism. (a) Schematic of parameters measured in mitostress assay, adapted from (b) THP-1 derived MΦ were subjected to a Seahorse mitostress assay per manufacturer protocol. Either CSE or vehicle was added to injection port A of the Seahorse plate, with a final concentration of 10% after injection. Oligomycin (final concentration 1 μM), FCCP (0.5 μM) and Rotenone/antimycin A (0.5 μM each) were added to injection ports B, C and D. Oxygen consumption rate (OCR, top panel) and extracellular acidification rate (ECAR, right panel) were measured simultaneously three times each at baseline and after each serial injection with three minute intervals between measurements. 3–4 technical replicates per condition were run and mean ± s.d. are graphed, data are representative of three independent experiments. Bar graphs are data computed from OCR line graph with parameters as per a. All calculations were performed relative to values from a given well. **p < 0.01, ****p < 0.0001 by unpaired t-test. (c) Alveolar macrophages purified from a healthy volunteer and subjected to an identical mitostress assay as in (b), excepting that injection was with 5% or 10% CSE. Six technical replicates per condition were run and mean ± s.d. are graphed, data are representative of three unique experiments performed with cells from different donors. *p < 0.05, **p < 0.01, ****p < 0.0001 relative to control wells by ANOVA with Dunnett’s post-test.
Figure 4
Figure 4
CSE induction of ROS is mitigated by NAC. THP-1 derived MΦ were plated in 96-well plates, then loaded with 10 μM DCF-DA for 30 min. Cells were washed once with PBS and treated with vehicle (a) or NAC 4 mM (b,c) as indicated for 30 min, followed by the addition of vehicle, CSE or H2O2 (250 μM). Fluorescence readings with excitation at 488 nm and emission 523 nm were taken every 5 min for one hour then every 30 min for 23 hrs. Readings were normalized to those of identically treated wells without fluorescent dye. Plots from (ac) are derived from a single experiment, data were separated onto three graphs for clarity. Four wells per condition were run and mean ± s.d. graphed, data are representative of three independent experiments. (df) Experiments were performed as above using primary AMΦ from a healthy donor. Data are representative of unique experiments on cells from three separate donors with six technical replicates each.
Figure 5
Figure 5
NAC blunts the CSE-induced metabolic shift in primary upper and lower lobe AMΦ. (a) RUL and (b) RLL AMΦ were purified from a healthy volunteer and plated overnight. Wells were pre-treated with vehicle or NAC at the indicated concentrations for 30 min prior to standard glycolytic rate assay performed according to manufacturer instructions. CSE was placed in injection port A of the Seahorse assay (final concentration 5% after dilution). Glycolytic rate assay was then run and proton efflux rate (PER) quantified at three minute intervals. 5–6 technical replicates per condition were run and mean ± s.d. graphed. Data are representative of three unique experiments with cells from separate donors. (c,d) CSE-induced glycolysis was calculated in RUL and RLL AMΦ, respectively, from three independent donors. Symbols represent means of 5–6 technical replicates per experiment, and bars indicate combined means of the three donors. CSE-induced glycolysis is reduced in a dose dependent fashion by NAC concentration in both the RUL (p < 0.0001) and RLL (p < 0.05) based on linear models.
Figure 6
Figure 6
Reactive oxygen species inhibit phagocytosis. (a) Phagocytosis was carried out as in Fig. 1 except varying doses of hydrogen peroxide were used to pre-treat cells for 30 min prior to infection. Phagocytosis generally decreases with increasing hydrogen peroxide concentration (p < 10−9, linear model). Means of four independent experiments are graphed (black dots) with the mean of all four experiments combined (red line). ***p < 0.001, ****p < 0.0001 compared with control by ANOVA with Dunnett’s post-hoc test. p < 10−9 for an effect of hydrogen peroxide concentration on phagocytosis as determined by linear modeling. (b) Phagocytosis assay similar to a except NAC 4 mM was added to indicated wells either 30 min before hydrogen peroxide/CSE (NAC PreTx) or 30 min after (NAC PostTx). Infection was started 30 min after post-treatment. Points represent means of four independent experiments each performed in triplicate, with bars indicating the overall means of the combined experiments. *p < 0.05 by paired t-test. (c) Identical phagocytosis assays to (b) were carried out using AMΦ from healthy donors, points represent means of three unique experiments from distinct donors each performed in triplicate, with bars indicating the overall means of the combined experiments. *p < 0.05, **p < 0.01 by paired t-test.

Similar articles

Cited by

References

    1. Pappas RS, Gray N, Gonzalez-Jimenez N, Fresquez M, Watson CH. Triple Quad-ICP-MS Measurement of Toxic Metals in Mainstream Cigarette Smoke from Spectrum Research Cigarettes. J. Anal. Toxicol. 2016;40:43–48. - PubMed
    1. Pazo DY, et al. Mainstream Smoke Levels of Volatile Organic Compounds in 50 U.S. Domestic Cigarette Brands Smoked With the ISO and Canadian Intense Protocols. Nicotine Tob. Res. Off. J. Soc. Res. Nicotine Tob. 2016;18:1886–1894. doi: 10.1093/ntr/ntw118. - DOI - PMC - PubMed
    1. Savareear B, et al. Comprehensive comparative compositional study of the vapour phase of cigarette mainstream tobacco smoke and tobacco heating product aerosol. J. Chromatogr. A. 2018;1581–1582:105–115. doi: 10.1016/j.chroma.2018.10.035. - DOI - PubMed
    1. WHO | The global burden of disease: 2004 update. WHO Available at, http://www.who.int/healthinfo/global_burden_disease/2004_report_update/en/. (Accessed: 14th April 2018).
    1. Vogelmeier CF, et al. Global Strategy for the Diagnosis, Management, and Prevention of Chronic Obstructive Lung Disease 2017 Report. GOLD Executive Summary. Am. J. Respir. Crit. Care Med. 2017;195:557–582. doi: 10.1164/rccm.201701-0218PP. - DOI - PubMed

Publication types

MeSH terms

Substances