. 2019 Jul 3;9(1):9626.
doi: 10.1038/s41598-019-46131-w.

Species-Specific Biodegradation of Sporopollenin-Based Microcapsules

Affiliations

Species-Specific Biodegradation of Sporopollenin-Based Microcapsules

Teng-Fei Fan et al. Sci Rep. .

Abstract

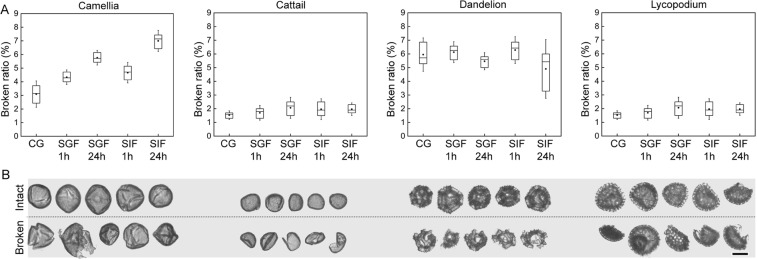
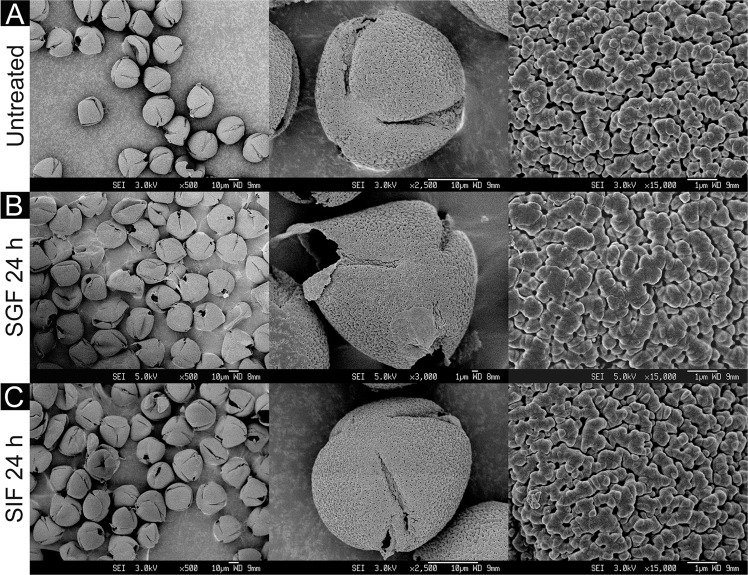
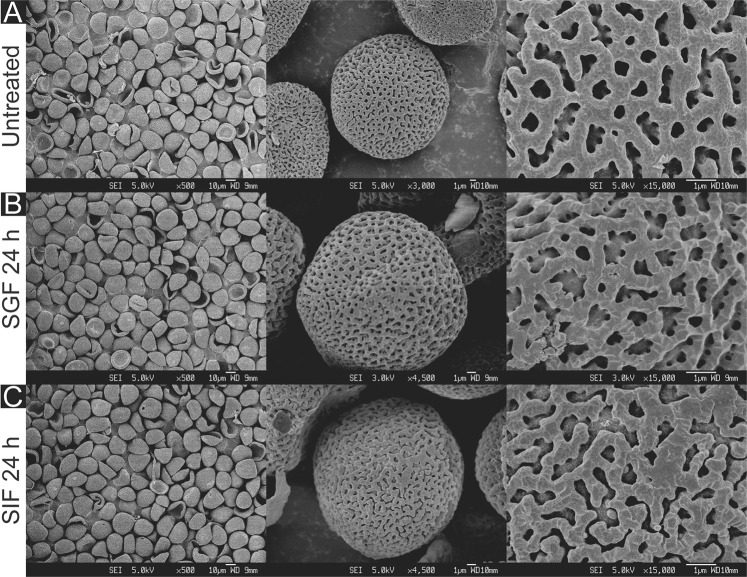
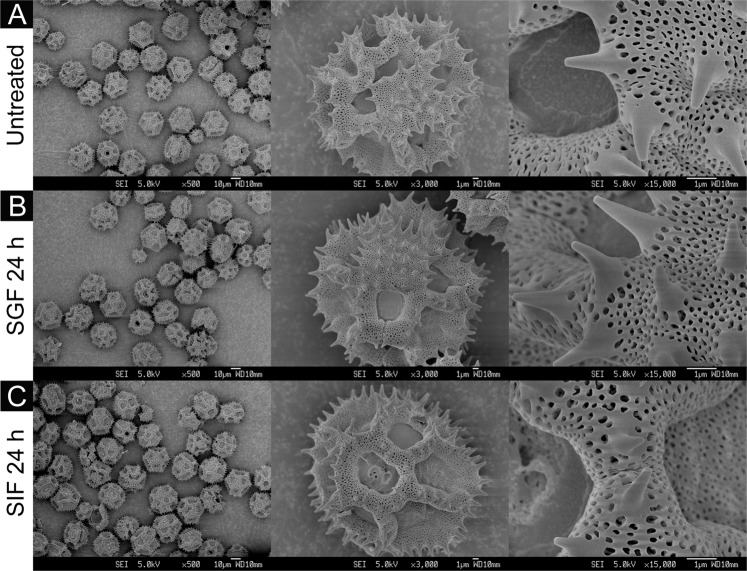
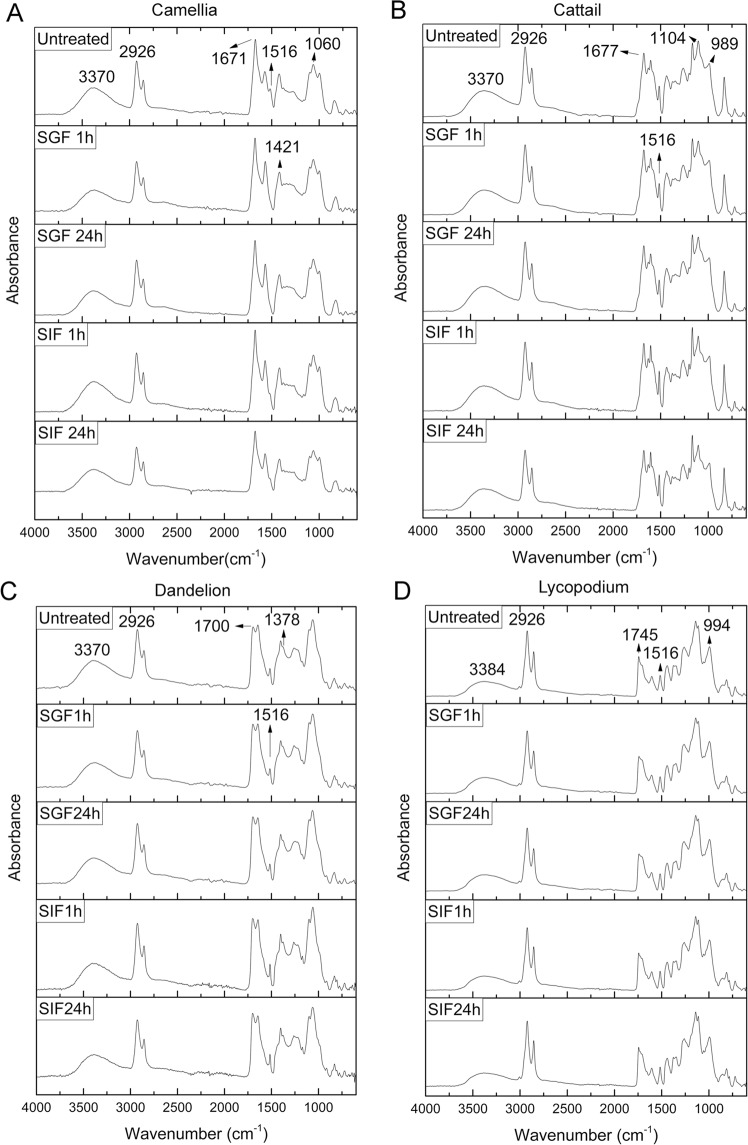
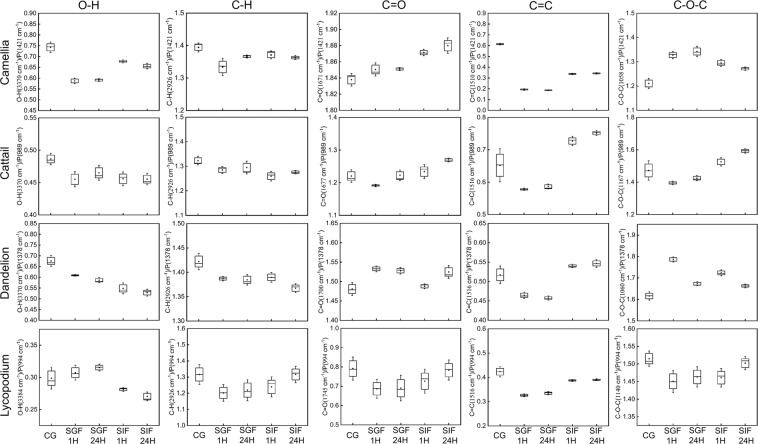
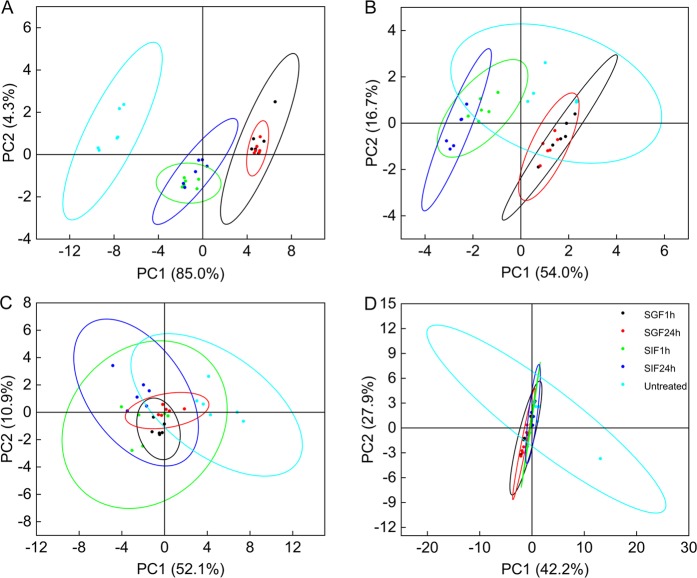
Sporoderms, the outer layers of plant spores and pollen grains, are some of the most robust biomaterials in nature. In order to evaluate the potential of sporoderms in biomedical applications, we studied the biodegradation in simulated gastrointestinal fluid of sporoderm microcapsules (SDMCs) derived from four different plant species: lycopodium (Lycopodium clavatum L.), camellia (Camellia sinensis L.), cattail (Typha angustifolia L.), and dandelion (Taraxacum officinale L.). Dynamic image particle analysis (DIPA) and field-emission scanning electron microscopy (FE-SEM) were used to investigate the morphological characteristics of the capsules, and Fourier-transform infrared (FTIR) spectroscopy was used to evaluate their chemical properties. We found that SDMCs undergo bulk degradation in a species-dependent manner, with camellia SDMCs undergoing the most extensive degradation, and dandelion and lycopodium SDMCs being the most robust.


Conflict of interest statement

The authors declare no competing interests.

Figures

Figure 1
Figure 1
DIPA analysis of the four SDMCs after incubation in simulated gastrointestinal fluids. (A) Boxplot representations of the broken particle population for the four SDMCs. Dots indicate the median and the whiskers indicate the highest and lowest points within 1.5 standard deviations. The broken particle population of untreated samples served as a control for each SDMCs species. (B) Representative DIPA images of intact and broken SDMCs.
Figure 2
Figure 2
SEM images of camellia SDMCs before and after degradation treatment with simulated gastrointestinal fluids (SGF and SIF). Surface morphology of (A) untreated camellia SDMCs and those treated for 24 h with (B) SGF or (C) SIF, at different magnifications.
Figure 3
Figure 3
SEM images of cattail SDMCs before and after degradation treatment with simulated gastrointestinal fluids (SGF and SIF). Surface morphology of (A) untreated cattail SDMCs and those treated for 24 h with (B) SGF or (C) SIF, at different magnifications.
Figure 4
Figure 4
SEM images of dandelion SDMCs before and after degradation treatment with simulated gastrointestinal fluids (SGF and SIF). Surface morphology of (A) untreated dandelion SDMCs and those treated for 24 h with (B) SGF or (C) SIF, at different magnifications.
Figure 5
Figure 5
SEM images of lycopodium SDMCs before and after degradation treatment with simulated gastrointestinal fluids (SGF and SIF). Surface morphology of (A) untreated lycopodium SDMCs and those treated for 24 h with (B) SGF or (C) SIF, at different magnifications.
Figure 6
Figure 6
FTIR spectra of SDMCs before and after incubation in SGF/SIF. The spectra presented are the means of six replicates. (A) Camellia, (B) cattail, (C) dandelion, and (D) lycopodium.
Figure 7
Figure 7
FTIR absorbance difference spectra of the four species of SDMCs after degradation treatment. Each plot was produced with the treated sample mean spectrum minus the mean untreated spectrum. The gray dashed lines indicate the0 value. (A) Camellia, (B) cattail, (C) dandelion, and (D) lycopodium.
Figure 8
Figure 8
Boxplot representations of peak height ratios for the different functional groups in the four species of SDMCs before and after incubation. Internal standard peaks were set as 1,421 cm−1 for camellia, 989 cm−1 for cattail, 1,378 cm−1 for dandelion, and 994 cm−1 for lycopodium. The dots indicate the median and whiskers indicate the highest and lowest points within 1.5 standard deviations.
Figure 9
Figure 9
Comparison of the normalized peak height ratios for different functional groups in the four species of SDMCs after different treatments. The color of the bar changes from red to blue, indicating that the peak ratio values increase from the minimum (0.314) to the maximum (1.153). For each SDMCs species, the peak ratio of each corresponding functional group was set as 1 (not shown). The peak ratio was the mean value of six replicates.
Figure 10
Figure 10
PCA of SDMCs before and after incubation in gastrointestinal fluids. (A) Camellia, (B) cattail, (C) dandelion, and (D) lycopodium. The cyan dots denote untreated samples, the blue dots denote samples treated with SIF for 1 h, the green dots denote samples treated with SIF for 24 h, the red dots denote samples treated with SGF for 1 h, and the black dots denote samples treated with SGF for 24 h. The ellipses represent 95% confidence intervals for each group.

References

    1. Bernard S, et al. Ultrastructural and chemical study of modern and fossil sporoderms by Scanning Transmission X-ray Microscopy (STXM) Rev. Palaeobot Palynol. 2009;156:248–261. doi: 10.1016/j.revpalbo.2008.09.002. - DOI
    1. Punt W, Hoen P, Blackmore S, Nilsson S, Le Thomas A. Glossary of pollen and spore terminology. Rev. Palaeobot Palynol. 2007;143:1–81. doi: 10.1016/j.revpalbo.2006.06.008. - DOI
    1. Gabarayeva NI. Pollen wall and tapetum development in Anaxagorea brevipes (Annonaceae): sporoderm substructure, cytoskeleton, sporopollenin precursor particles, and the endexine problem. Rev. Palaeobot Palynol. 1995;85:123–152. doi: 10.1016/0034-6667(94)00125-4. - DOI
    1. Furness CA, Rudall PJ, Sampson FB. Evolution of microsporogenesis in angiosperms. Int. J. Plant Sci. 2002;163:235–260. doi: 10.1086/338322. - DOI
    1. Stephen A. Pollen: A microscopic wonder of plant kingdom. Int. J. Adv. Res. Biol. Sci. 2014;1:45–62.

Publication types