. 2019 Jul;571(7764):205-210.
doi: 10.1038/s41586-019-1362-5. Epub 2019 Jul 3.

Single-cell analysis reveals T cell infiltration in old neurogenic niches

Affiliations

Single-cell analysis reveals T cell infiltration in old neurogenic niches

Ben W Dulken et al. Nature. 2019 Jul.

Abstract

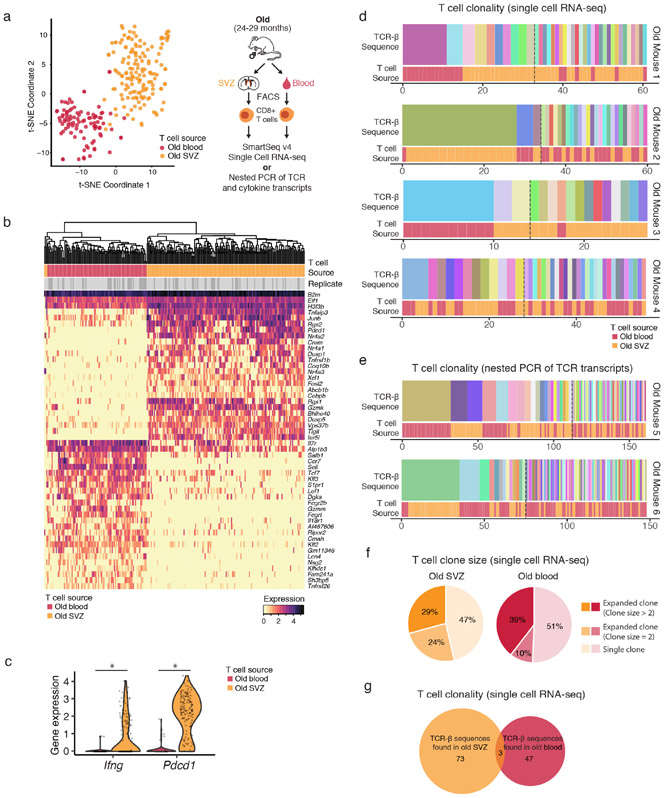
The mammalian brain contains neurogenic niches that comprise neural stem cells and other cell types. Neurogenic niches become less functional with age, but how they change during ageing remains unclear. Here we perform single-cell RNA sequencing of young and old neurogenic niches in mice. The analysis of 14,685 single-cell transcriptomes reveals a decrease in activated neural stem cells, changes in endothelial cells and microglia, and an infiltration of T cells in old neurogenic niches. T cells in old brains are clonally expanded and are generally distinct from those in old blood, which suggests that they may experience specific antigens. T cells in old brains also express interferon-γ, and the subset of neural stem cells that has a high interferon response shows decreased proliferation in vivo. We find that T cells can inhibit the proliferation of neural stem cells in co-cultures and in vivo, in part by secreting interferon-γ. Our study reveals an interaction between T cells and neural stem cells in old brains, opening potential avenues through which to counteract age-related decline in brain function.


Figures

Extended Data Figure 1
Extended Data Figure 1. Quality control for 10x Genomics single cell RNA-seq data.
a) Unique gene counts for 14,685 cells, separated by cell type and individual mouse (complete cell count breakdown available in Supplementary Table 3). Mean +/− 25th and 75th percentile are shown. Upper and lower whisker extend to 1.5x of the interquartile range; b) Heatmap showing the expression of the top 5 marker genes for each significant cell cluster identified by Seurat. The cell identity assigned to each cluster is indicated on the bottom of each column; c) t-SNE plots of all 14,685 10x Genomics single cell transcriptomes, colored by replicates, individual mouse, and separated by age. Clustering was the same as for Fig. 1a. 8,884 cells from young (Young 1: 2,306, Young 2: 2,675, Young 3: 3,903) and 5,801 cells from old (Old 1: 1435, Old 2: 2,541, Old 3: 1,825).
Extended Data Figure 2
Extended Data Figure 2. T cells in old brains are within the brain parenchyma and express Ifng.
a) Immunofluorescence staining of brain sections of the SVZ neurogenic niche from old (24 months) male mice shows that age-associated T cells do not co-localize with markers of endothelial cells (CD31). Representative of n=4 old mice showing similar results. White: CD3 (T cells); Green: CD31 (endothelial cells); Blue: DAPI (DNA). The image on the right is from the white square. White arrows point at T cells. Scale bar: 50 μm; b) Violin plots showing expression of Ifna1 (encoding IFNα), Ifnb1 (encoding IFNβ) and Ifng (encoding IFNγ) in single cells from different cell types. The data for Ifng are also presented in Fig. 1h. Cell types were defined by cell clustering as defined in Fig. 1a. Cells were colored by age as in Fig. 1b. Expression values represented as normalized log2-transformed counts; c) Schematic of the experimental design for quantifying T cell infiltration in old human brains. Formalin-fixed paraffin-embedded brain tissue blocks of the basal ganglia with an identifiable ependymal lining (left and middle) from young and old humans were sectioned and stained with H&E or antibodies to CD3 or CD8 for T cell quantification (right). Scale bars: 100 µm.
Extended Data Figure 3
Extended Data Figure 3. T cells infiltrating old brains are clonally expanded and differ from T cells in old blood.
a) t-SNE projections of 247 CD8+ T cell transcriptomes from old blood and old SVZ (as in Fig. 2a), colored by experimental replicate and individual mouse; b) Expression of the top 50 differentially expressed genes upregulated for 247 CD8+ T cells isolated from old blood or old brain (SVZ) of old mice. Heat map of log-normalized counts, with single cells clustered by the expression of the genes shown in the plot. c) Expression of Ifng in T cells from blood or brains (SVZs) of 2 old (24 months) mice, as measured by nested PCR. Mean +/− s.e.m. of percent of T cells positive for Ifng. Nested PCR does not provide a quantitative metric but rather a binary determination of whether the T cell expresses the transcript for the cytokine or not. Percent of cells isolated from the SVZ or blood expressing Ifng is shown; d, e) Clonality of T cells isolated from the blood and perfused brain of old mice represented with the same X axis to enable direct comparison of clone sizes from different mice (the data are the same as Fig. 2c, d). TCR sequences were extracted from single cell RNA-sequencing data using TraCer (Old Mouse 1, 2, 3, and 4) (d) or by nested PCR of the TCR transcripts (Old Mouse 5 and 6) (e). For each mouse TCR-β sequence clones are ordered from left to right in order of decreasing frequency in the top row. The source of the T cell is indicated in the bottom row. f) Venn diagram showing lack of overlap between T cell clones from separate mice, for the four mice for which their TCR repertoire was analyzed by single cell RNA-seq via TraCeR. TCR-β sequences were used, and all unique sequences were only counted once; g, h) Venn diagram showing lack of overlap between T cell clones from the old blood and old SVZ (g) or separate mice (h), for the two mice whose TCR repertoire was analyzed by nested PCR. TCR-β sequences were used, and all unique sequences were only counted once.
Extended Data Figure 4
Extended Data Figure 4. The neurogenic niche responds to IFNγ.
a) t-SNE plot showing levels of expression of Ifngr1 and Ifngr2 (summed), which encode the IFNγ receptor, in 14,685 cells clustered as in Fig. 1a. Darker color indicates higher summed expression of Ifngr1 and Ifngr2. Note that there is a lack of correlation between the age-dependent changes in Ifngr1 and Ifngr2 levels and changes in the IFNγ response (Fig. 3a), possibly because of post-transcriptional changes of the IFNγ receptor; b) Violin plots showing expression of Ifngr1 and Ifngr2 (summed) by age and cell type. Decrease in microglia is significant at P<10−15 and others are not significant (n.s.), two-sided Wilcoxon rank sum test. Horizontal lines in violin plots denote median summed Ifngr1 and Ifngr2 expression. See Supplementary Table 3 for exact cell counts; c) MSigDB Hallmarks (v6.1) GSEA results for old versus young astrocytes/qNSCs, aNSCs/NPCs, Neuroblasts, OPCs, Oligodendrocytes, Endothelial cells, Microglia, Macrophages, and T cells in the neurogenic niche. Normalized enrichment score is presented for each pathway with FDR<0.05. Other cell types did not show pathways meeting this FDR cutoff; d) Combined log-normalized expression values of genes in IFNγ Response Hallmark in various cell types of the SVZ. Single cells were grouped by cell type and age (Supplementary Table 3); e) FACS analysis of STAT1 levels in the young and old NSCs lineage (PROM1+CD45-CD31-CD24-O4-) freshly isolated from the brains of 5 young (5 months) and 4 old (26 months) male mice. Mean +/− s.e.m. of the mean STAT1 fluorescence of the ~500 cells analyzed for each mouse. Each dot represents ~500 cells from one mouse. *P=0.016, two-sided Wilcoxon rank sum test. Data from one experiment (all experiments are plotted in Extended Data Fig. 5d); f) FACS analysis of STAT1 levels in endothelial cells freshly isolated from the brains of 5 young (5 months) and 4 old (26 months) male mice. Mean +/− s.e.m. of the mean STAT1 fluorescence of the ~500 cells analyzed for each mouse. Each dot represents ~500 cells from one mouse. *P=0.016, two-sided Wilcoxon rank sum test; g) Immunofluorescence staining of SVZ brain sections from young (4 months) and old (29 months) male mice showing BST2 levels in microglia. Green: BST2; red: IBA1 (microglia maker); blue: DAPI. Scale bar: 20µm. h) t-SNE plot of 14,685 single cell transcriptomes with points colored by putative cell cycle phase (G0/G1, G2/M, or S) as predicted using Seurat’s CellCycleScoring function; i) t-SNE plot of 14,685 single cell transcriptomes clustered as in Fig. 1a showing levels of expression of Bst2 in cells of the subventricular zone (SVZ) neurogenic niche. Darker color indicates higher expression of Bst2; j) Violin plots showing Bst2 expression by age and cell type. Horizontal lines in violin plots denote median Bst2 expression. Increase in Astrocytes/qNSCs is significant at P=6.4×10⁻¹⁴, increase in Oligodendrocytes at P=0.025, increase in microglia at P<2.2×10⁻¹⁶, and others are not significant (n.s.), two-sided Wilcoxon rank sum test. See Supplementary Table 3 for exact cell counts.
Extended Data Figure 5
Extended Data Figure 5. The old NSC lineage exhibits a heterogeneous response to IFNγ.
a) Principal component analysis (PCA) of 562 old cells in the neural stem cell lineage (astrocytes/qNSCs and aNSCs/NPCs) performed only using genes in the IFNγ Response Hallmark from MSigDB (Supplementary Table 8). IFNγ-high cells (dark red with black ring) are defined as old cells exhibiting an average expression of genes in the IFNγ Response Hallmark pathway in the top 5% of old cells; b) PCA as in (a), but with a separate PCA performed for each of three 10x Genomics replicates (n=162, n=315, n=85 cells respectively) and for the dataset generated with Fluidigm C1 technology (n=137 cells); c) Average of normalized expression values of genes in IFNγ Response Hallmark for young and old cells in cells of the NSC lineage (Astrocytes/qNSCs and aNSCs/NPCs). Cells are grouped by age. IFN-high cells (in black) are defined as cells exhibiting an average expression of genes in the IFNγ Response Hallmark pathway in the top 5% of the cells analyzed within each 10x Genomics replicate. Note that replicate three contains ~2 fold more young cells than old cells. Horizontal lines in violin plots denote median IFNγ Response Pathway expression. See Supplementary Table 3 for exact cell counts; d) FACS analysis of STAT1 positive cells in the young and old NSC lineage (PROM1+CD45−CD31−CD24−O4−). Left: FACS histograms of STAT1 fluorescence in PROM1+ cells isolated from the SVZ from two representative young (3 months) and old (20 months) male mice. Inset: Quantification of the percentage of STAT1-high cells in 15 young (3-5 months) and 14 old (19-26 months) mice. Mean +/− s.e.m. of percentage of cells that are STAT1-high of the ~500 cells analyzed for each mouse. Each dot represents ~500 cells from one mouse. The combined results from five independent experiments are shown (for independent experiments, see Supplementary Table 12). ***P=5.08 × 10⁻⁶, two-sided Wilcoxon rank sum test; e) The gene encoding the surface marker BST2/Tetherin is expressed in the old NSC lineage and is correlated with genes that belong to IFNγ signaling. Data is shown as heatmap with log-normalized expression of Bst2 and other select genes in the IFNγ Response Hallmark pathway. Cells are clustered based on expression of this gene set. The age of the mouse from which the cells are isolated is indicated in a bar above the heatmap; f) Live FACS analysis for BST2 in cultured NSCs following IFNγ treatment for 48 hours; g) Abundance of total STAT1 protein in BST2-positive versus BST2-negative aNSCs/NPCs isolated from 9 old (25 months) mice, as measured by intracellular FACS. Mean +/− s.e.m. of total STAT1 fluorescence. Each dot represents cells from one mouse. The combined results from two independent experiments are shown (for independent experiments, see Supplementary Table 12). *P=0.04, two-sided Wilcoxon rank sum test; h) FACS quantification for KI67, a marker of cycling cells, in BST2-positive and BST2-negative aNSCs/NPCs from 15 old (23-25 months) mice. Mean +/− s.e.m. of percentage of cells that are KI67 positive of the ~100 cells analyzed for each mouse. Each dot represents ~100 cells from one mouse. The combined results from three independent experiments are shown (for independent experiments, see Supplementary Table 12). ***P=7.80 × 10⁻⁴, two-sided Wilcoxon rank sum test.
Extended Data Figure 6
Extended Data Figure 6. T cells can influence NSCs in vivo and in co-cultures.
a) Schematic showing approach for inducing T cell infiltration of the brains of young mice by immunization with recombinant myelin oligodendrocyte glycoprotein (MOG). NSCs were purified 13-15 days after MOG immunization, and BST2 levels and proliferative (cycling) status (as determined by intracellular KI67 levels) of NSCs were measured by FACS; b, c) FACS analysis of CD8+ (b) and CD4+ (c) T cells freshly isolated from the brains of 5 control or 5 MOG-injected young mice (3 months). Mean +/− s.e.m of the percent of live cells that are defined as CD8+ or CD4+ T cells, defined as CD3+CD45+TCRγ/δ−B220−TER119−CD11b−. *P=0.016 (b), *P=0.045 (c), two-sided Wilcoxon rank sum test. Each dot represents one mouse; d) Percent of aNSCs/NPCs that are BST2-positive sorted from 30 young (3 months) male mice injected with adjuvant (control) and 31 young (3 months) male mice injected with adjuvant with MOG (See Experimental Procedures), combined over 5 experiments (for individual experiments, see Supplementary Table 12). Mean +/− s.e.m. of the percentage of cells that are BST2-positive of the ~500 cells analyzed from each mouse. Each dot represents cells from one mouse. **P=0.002, two-sided Wilcoxon rank sum test. e) FACS analysis for KI67, a marker of cycling cells, in freshly isolated BST2-positive and BST2-negative aNSCs/NPCs sorted from 7 MOG-injected young mice (3 months). Mean +/− s.e.m. of the percentage of cells that are KI67-positive of the ~100 cells analyzed from each mouse. Samples were excluded if there were fewer than 30 intact cells analyzed in a given sample (resulting in 7 samples for BST2-negative and 5 samples for BST2-positive aNSCs/NPCs). Each dot represents cells from one mouse. *P=0.018, Two-sided Wilcoxon rank sum test. f, g) BST2 levels (f) and EdU incorporation (g) in cultured NSCs following co-culture with spleen CD8+ T cells incubated with a combination of IL2, along with beads coated with anti-CD3 and anti-CD28 antibodies, which are known to activate CD8+ T cells. BST2 levels in NSCs, measured by live FACS analysis, plotted as mean BST2 fluorescence. Percent of NSCs incorporating EdU, a nucleotide analogue, during a 4-hour pulse of EdU. Effects of activated T cells on NSCs are reversed by the addition of a neutralizing antibody to IFNγ. Mean+/− s.e.m. of the percentage of cells that are BST2-positive or EdU-positive of the ~1,000 cells analyzed from each NSC culture. Each dot represents an independent culture of NSCs, derived from a separate mouse (n=5). One independent experiment (see Supplementary Table 12). **P=0.008, n.s.=not significant, two-sided Wilcoxon rank sum test.
Extended Data Figure 7
Extended Data Figure 7. FACS gating strategies.
a) FACS scheme for the isolation of PROM1+EGFR+CD45−CD31−O4−CD24a− aNSCs/NPCs from the adult SVZ. Gate shown on each plot is indicated above the plot. Marker and fluorophore are shown on each axis; b) FACS scheme for the isolation of CD8+CD4-CD3+CD45+TCRγ/δ−B220−TER119−CD11b− T cells from adult SVZ, spleen, and blood. Gate shown on each plot is indicated above the plot. Marker and fluorophore are shown on each axis.
Figure 1 –
Figure 1 –. Single cell RNA-seq reveals changes in cell composition in old neurogenic niches, with infiltration of T cells in proximity to neural stem cells.
a) Single cell RNA-sequencing of the subventricular zone (SVZ) from 3 independent replicates of young (3 months) and old (28-29 months) perfused male mice using 10x Genomics Chromium. t-SNE clustering of 14,685 single cell transcriptomes (8,884 from young and 5,801 from old) colored by significant cell type clusters; b) t-SNE clustering as in a, but colored by age (for independent replicates, see Extended Data Fig. 1c); c) Age-dependent changes (log2 fold) in the percentage of each cell type. Data are mean +/− s.e.m. Each dot represents one replicate; d) Age-dependent changes in gene expression for each cell type. Each dot represents the differential expression MAST z-score of a gene. Dots with Bonferroni-corrected P<0.05 are in color; e) Immunofluorescence staining of the perfused SVZ neurogenic niche from young (3 months) and old (24 months) male mice. White: CD3 (T cells); Magenta: SOX2 (NSCs); Green: KI67 (cycling cells); Blue: DAPI (nuclei). Scale bar: 20 μm; f, g) Number of CD3+ T cells (f) and NSCs/NPCs (SOX2+KI67+) (g) per coronal section in 5 young (3-7 months) and 4 old (20-24 months) male mice. Data are mean +/− s.e.m. Each dot represents cells from one mouse. *P=0.020 (f), *P=0.016 (g), two-sided Wilcoxon rank sum test; h) Violin plot showing expression of cd3 (cd3e), cd8 (cd8a), cd4, and ifng in various cell types. Each dot represents expression levels in one cell. n=6 mice; i) T cells exhibit markers of effector memory T cells (Cd62Llow, Cd44high), activation (Cd69+, Xcl1+), tissue retention (Itga1+, Itga4+), and express interferon (Ifng). Each dot represents expression levels in one cell. n=6 mice; j) FACS plot of T cells in the SVZ of an old (24 months) male mouse. CD8+ T cells are defined as CD45+CD3+CD8+CD4−CD11b−B220−TER119−TCRγ/δ−; k) FACS quantification of the percentage of CD8+ T cells per SVZ in 4 young (3-5 months) and 5 old (24-25 months) male mice (combined over 2 independent experiments, Supplementary Table 12). Data are mean +/− s.e.m. Each dot represents T cells from one mouse. *P=0.016, two-sided Wilcoxon rank sum test. l) Immunohistochemical staining for CD3 and CD8 (brown) in young (20 years) and old (83 years) human brain sections including the lateral ventricle, counterstained with hematoxylin (blue). Scale bar: 100 μm. m) Number of CD3+ (left) or CD8+ (right) T cells per unit area (mm2) in proximity to the ventricle in 5 young (20-44 years) and 6 old (78-93 years) human brain sections of both sexes. Data are mean +/− s.e.m. Each dot represents T cells from one human specimen (Supplementary Table 4). *P=0.030, two-sided Wilcoxon rank sum test.
Figure 2 –
Figure 2 –. T cells invading old brains are clonally expanded and differ from T cells in old blood.
a) CD8+ T cells from 6 old (24-29 months) male mice were FACS-isolated from the blood and perfused subventricular zones (SVZs) and analyzed by single cell RNA-sequencing using Smart-seq v4 (4 mice) or nested PCR (2 mice). Left: t-SNE plot of 247 CD8+ T cell transcriptomes, colored by source (blood=red and SVZ=orange). Each dot represents a single T cell transcriptome (n=4 old mice, 25-29 months); b) Expression of Ifng (IFNγ) and the checkpoint gene Pdcd1 (PD-1), represented as log-normalized counts. Each dot represents expression levels in one single cell. n=247 cells from 4 old (25-29 months) mice. Ifng ***FDR=2.89×10⁻¹², Pdcd1 ***FDR=1.29×10−40, MAST differential expression test; c, d) Clonality of T cells in the blood or SVZs of old mice determined by TCR sequencing from Smart-seq v4 data using TraCeR (Mouse 1-4) (d) or by nested PCR of the TCR transcripts (Mouse 5, 6) (e). TCR-β sequence clones are ordered by decreasing frequency. T cell source is indicated in the bottom row. Dashed lines indicate transitions from expanded to unique TCR-β sequence clones; e) Percentage of T cells isolated from the SVZ or blood found in clones of increasing sizes; f) Venn diagram showing lack of overlap between T cell clones from old blood and brain (SVZ) for Mouse 1-4. Clones were designated as clonally expanded if the same TCR β-chain sequence was detected in multiple T cells.
Figure 3 –
Figure 3 –. The neurogenic niche responds to IFN signaling.
a) t-SNE plot showing combined log-normalized expression values of genes in the IFNγ Response Hallmark from MSigDB (e.g. Ifit1, Stat1, and Bst2; Supplementary Table 8) in cells of the SVZ. Darker color indicates higher expression. n=14,685 cells clustered as in Fig. 1a; b) Combined log-normalized expression values of genes in IFNγ Response Hallmark in various cell types of the SVZ. Single cells were grouped by cell type and age (Supplementary Table 3). Median cellular IFNγ response values denoted by horizontal lines. Astrocytes/qNSCs P<2.2×10⁻¹⁶; aNSCs/NPCs P=1.4×10⁻⁹; Neuroblasts P=0.056, Endothelial P<2.2×10⁻¹⁶; Microglia P<2.2×10⁻¹⁶; T cells P=0.230, two-sided Wilcoxon rank sum test. c-e) Immunofluorescence staining of the IFN response gene STAT1 in different cell types in the SVZ of young (4 months) and old (29 months) male mice. Red: STAT1; Green: (c) SOX2 (NSCs), (d) IBA1 (microglia), or (e) CD31 (endothelial cells); White: KI67 (cycling cells); Blue: DAPI (nuclei). Scale bar: 20μm. Arrows: STAT1 staining in microglia and endothelial cells. f-i) Normalized STAT1 fluorescence intensity overlapping with cell marker fluorescence in 5 young (4-6 months) and 4 old (29-30 months) male mice. Data are mean +/− s.e.m. Each dot represents cells from one mouse. *P=0.016, two-sided Wilcoxon rank sum test.
Figure 4.
Figure 4.. IFNγ signaling from T cells negatively impacts NSCs.
a) FACS histograms of BST2 fluorescence in aNSCs/NPCs from young (3 months, n=4) and old (24 months, n=4) mice. Inset: Percentage of aNSCs/NPCs that are BST2-positive of the ~500 cells analyzed from each young (n=15, 3-6 months) or old (n=28, 23-25 months) mouse (combined over 5 experiments, Supplementary Table 12). Data are mean +/− s.e.m. ***P=1.10 × 10⁻⁵, two-sided Wilcoxon rank sum test; b) Hallmark gene set enrichment analysis of bulk RNA-seq from freshly isolated BST2-positive versus BST2-negative aNSCs/NPCs from old mice (24 months, n=4). For all pathways shown FDR<0.01, GSEA statistics; c) FACS quantification of the percentage of cells that are EdU positive (4 hours after EdU injection) of the ~100 BST2-positive and BST2-negative aNSCs/NPCs isolated from old male mice (n=15, 23-25 months) (combined over 3 experiments, Supplementary Table 12). Data are mean +/− s.e.m. Each dot represents cells from one mouse. ***P=3.23 × 10⁻⁴, two-sided Wilcoxon rank sum test; d) Immunofluorescence staining of SVZ sections from an old (29 months) male mouse. White: CD3 (T cells); Magenta: SOX2 (NSCs): Green: BST2/Tetherin; Blue: DAPI (nuclei). Scale bar: 20 μm; e) Quantification of BST2 fluorescence in NSCs in proximity (or not) to CD3+ T cells in SVZ sections from 3 old (29-30 months) mice. Data represent mean +/− s.e.m. Each dot represents normalized BST2 fluorescence in SOX2+ NSCs in one section. **P=0.007, two-sided Wilcoxon rank sum test. f) Scheme for co-culture of T cells and NSCs; g) Immunofluorescence staining of cultured NSCs from young mice (3 months) co-cultured with T cells and cytokines with or without the addition of a neutralizing antibody to IFNγ. Green: BST2 (high IFN response); Red: EdU (proliferating cells); Blue DAPI (nuclei). Scale bar: 20 µm; h, i) FACS quantification of the percentage of NSCs that are BST2-positive (h) or EdU-positive after a 4-hour pulse (i) of the ~1,000 cells analyzed from each NSC culture co-cultured with spleenic CD8+ T cells with or without addition of a neutralizing antibody to IFNγ. n=4 for each condition. Representative of 2 independent experiments (see Supplementary Table 12). Data are mean +/− s.e.m. Each dot represents the mean fluorescence of an NSC culture derived from one mouse. *P=0.029, two-sided Wilcoxon rank sum test. n.s.=not significant.

Comment in

References

    1. Mirzadeh Z, Merkle FT, Soriano-Navarro M, Garcia-Verdugo JM & Alvarez-Buylla A Neural stem cells confer unique pinwheel architecture to the ventricular surface in neurogenic regions of the adult brain. Cell Stem Cell 3, 265–78 (2008). - PMC - PubMed
    1. Shen Q et al. Adult SVZ stem cells lie in a vascular niche: a quantitative analysis of niche cell-cell interactions. Cell Stem Cell 3, 289–300 (2008). - PMC - PubMed
    1. Tavazoie M et al. A specialized vascular niche for adult neural stem cells. Cell Stem Cell 3, 279–88 (2008). - PMC - PubMed
    1. Codega P et al. Prospective identification and purification of quiescent adult neural stem cells from their in vivo niche. Neuron 82, 545–59 (2014). - PMC - PubMed
    1. Bond AM, Ming GL & Song H Adult Mammalian Neural Stem Cells and Neurogenesis: Five Decades Later. Cell Stem Cell 17, 385–95 (2015). - PMC - PubMed

MeSH terms

Substances