. 2019 Jul;26(7):637-648.
doi: 10.1038/s41594-019-0250-x. Epub 2019 Jul 1.

Molecular interactions underlying liquid-liquid phase separation of the FUS low-complexity domain

Affiliations

Molecular interactions underlying liquid-liquid phase separation of the FUS low-complexity domain

Anastasia C Murthy et al. Nat Struct Mol Biol. 2019 Jul.

Abstract

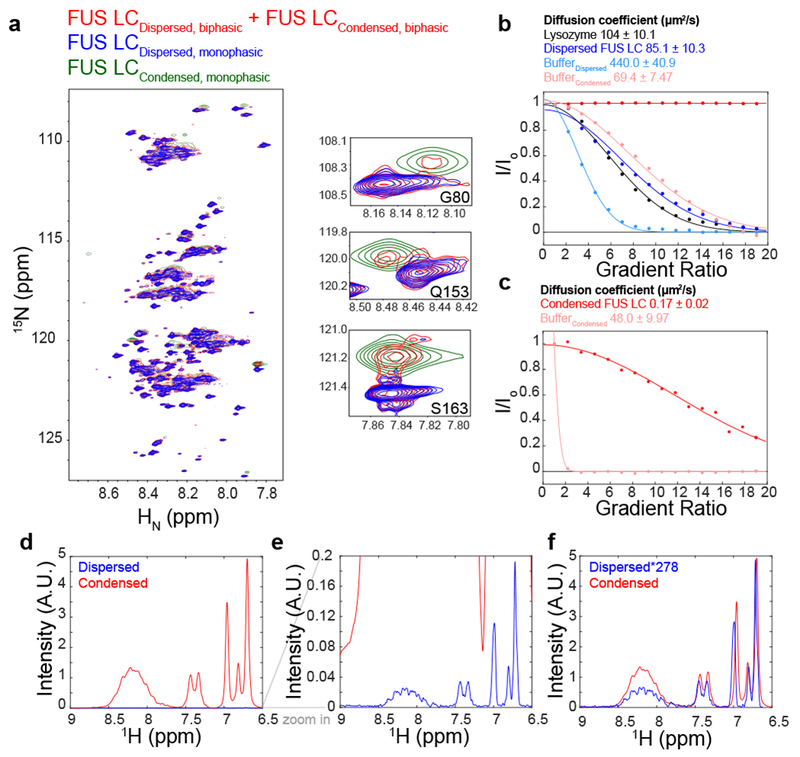
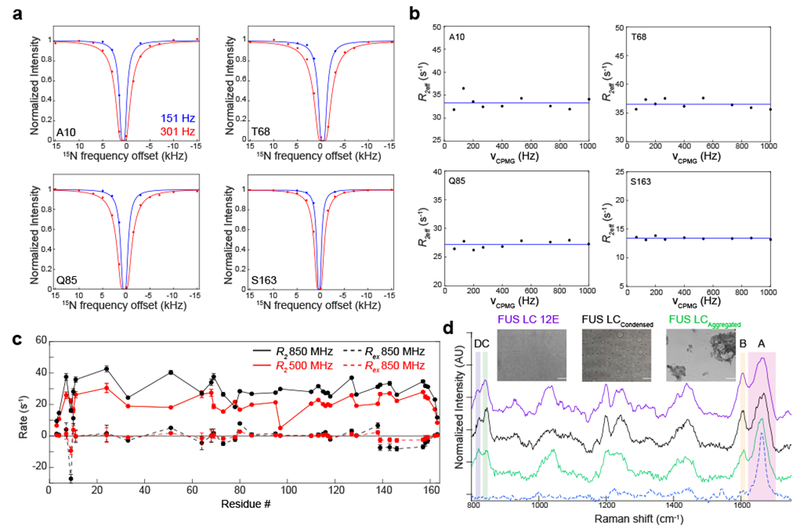
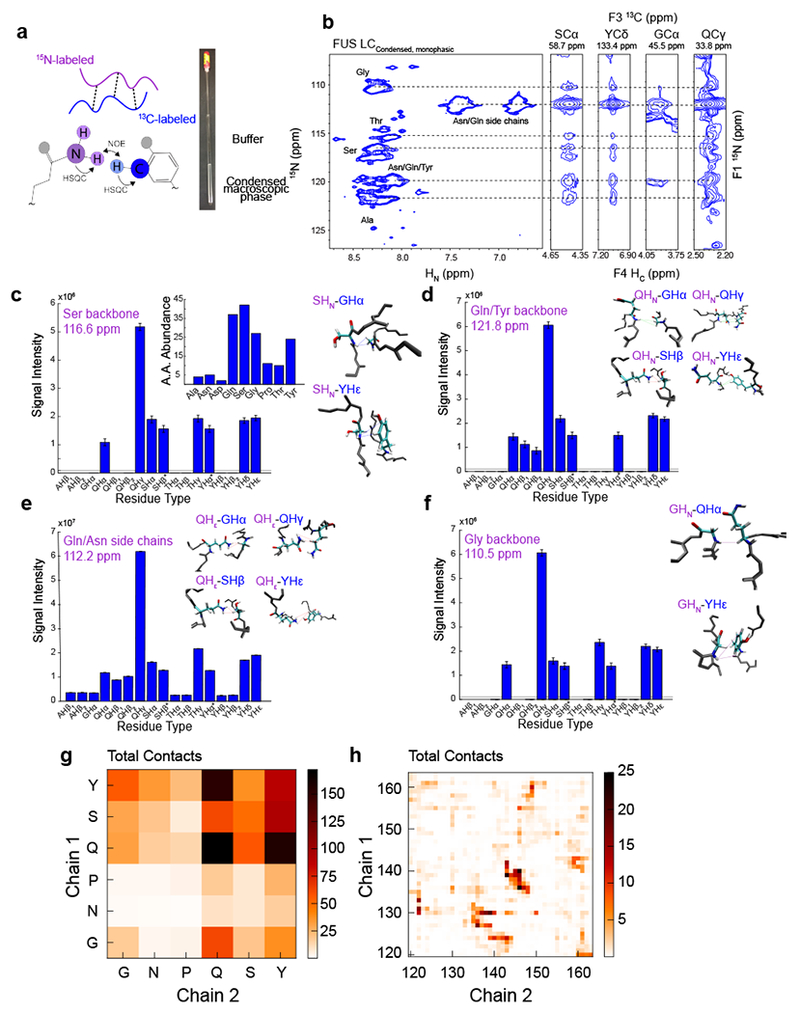
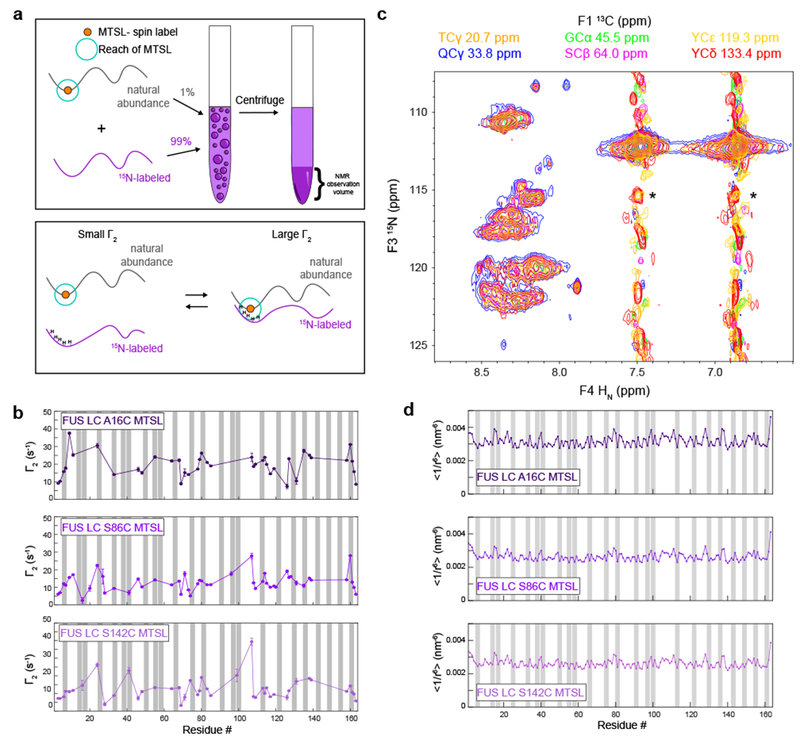
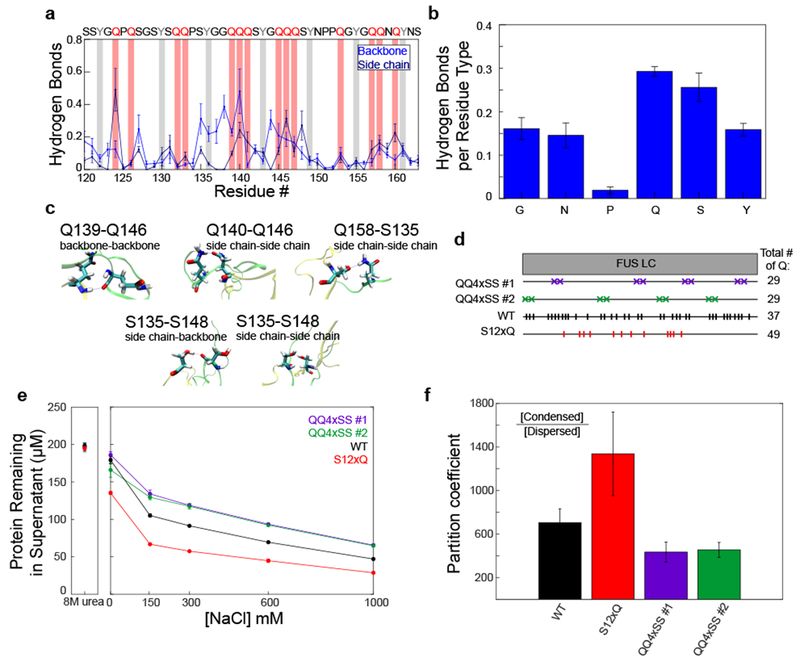
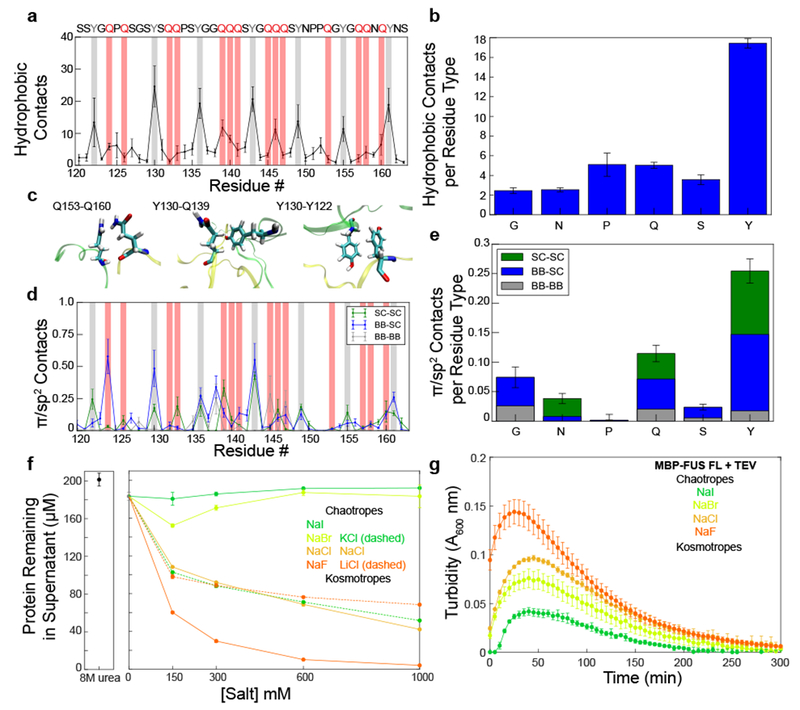
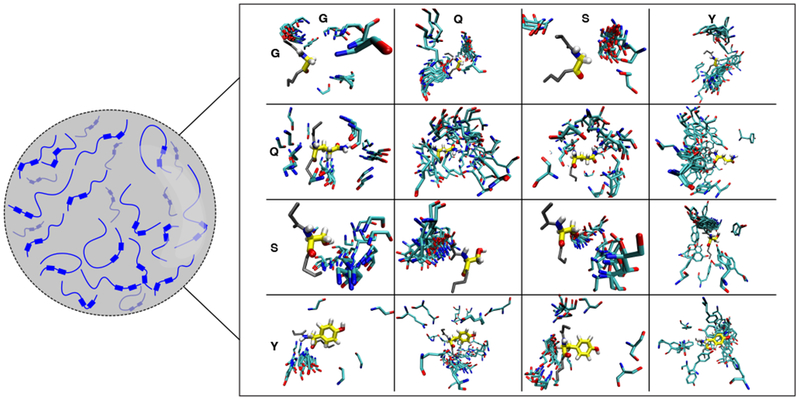
The low-complexity domain of the RNA-binding protein FUS (FUS LC) mediates liquid-liquid phase separation (LLPS), but the interactions between the repetitive SYGQ-rich sequence of FUS LC that stabilize the liquid phase are not known in detail. By combining NMR and Raman spectroscopy, mutagenesis, and molecular simulation, we demonstrate that heterogeneous interactions involving all residue types underlie LLPS of human FUS LC. We find no evidence that FUS LC adopts conformations with traditional secondary structure elements in the condensed phase; rather, it maintains conformational heterogeneity. We show that hydrogen bonding, π/sp2, and hydrophobic interactions all contribute to stabilizing LLPS of FUS LC. In addition to contributions from tyrosine residues, we find that glutamine residues also participate in contacts leading to LLPS of FUS LC. These results support a model in which FUS LC forms dynamic, multivalent interactions via multiple residue types and remains disordered in the densely packed liquid phase.


Conflict of interest statement

Competing Interests Statement

The authors declare no competing interests.

Figures

Figure 1.
Figure 1.. NMR characterization of condensed FUS LC.
A) 1H-15N heteronuclear quantum coherence spectrum of FUS LC in the phase separated state. A 1 mM biphasic sample (red), containing both dilute and condensed phases, generates two sets of peaks corresponding to the dilute phase (blue) and to a condensed macroscopic phase (green). B,C) PFG diffusion of the dispersed and condensed phase relative to lysozyme. B) was recorded with a diffusion time of 300 ms and gradient length of 1.2 ms, while C) was recorded with a diffusion time of 1.5 s and gradient length of 7 ms. Solid lines are best-fit solution to I/I0 = Aedx2 , where d is proportional to the diffusion coefficient, and the x axis is the gradient ratio. Mean and uncertainty in diffusion coefficient represents confidence interval equal to 1 s.d. in the one dataset shown. (D, E, F) Estimation of the concentration inside of the condensed phase using 1D 1H NMR spectroscopy. Unscaled intensities of condensed FUS LC were compared with 100 μM FUS LC (D,E). The relative intensity of the glutamine side chain residue NMR resonances in the condensed phase compared to a standard concentration (100 μM) dispersed phase FUS LC suggests a concentration of 27.8 mM = 477 mg/mL in the condensed phase (F).
Figure 2.
Figure 2.. Lack of evidence for structured conformations in condensed phase FUS LC.
A) Experimental dark-state exchange saturation transfer profiles (points) for condensed FUS LC as a function of the offset from the 15N carrier frequency and applied saturation field show no deviations from the profiles calculated for a single state (lines) with R2 values measured directly on the major, disordered state. Data are plotted as mean ± s.d. (approximately the size of the circles) propagated from best-fit parameter confidence interval equal to 1 s.d. in one representative data set out of two independent experiments. B) 15N CPMG profiles of condensed FUS LC are flat, providing no evidence for significant minor populations of structured states in μs-ms timescale conformational exchange with the primary, disordered state. The blue line is the average R2eff at each residue position. C) The fitted Rex component, derived from reduced spectral density mapping at two fields. Data are plotted as mean ± propagated best-fit parameter confidence interval equal to 1 s.d. in one representative data set of two independent experiments. D) The Raman spectral features of FUS LC 12E (dispersed control) and condensed droplets of FUS LC. Hen egg white lysozyme fibrils (dashed blue line) serve as a fibril control. The spectra are stacked for clarity. The amide I region and tyrosine side chain region are indicated by boxes A and B, respectively, while the tyrosine doublet modes are indicated by boxes C and D. Insets are brightfield micrographs of the samples used for vibrational spectroscopy. FUS LC 12E does not assemble into condensates as previously characterized and was used as a high concentration solution control . Scale bars are 10 μm.
Figure 3.
Figure 3.. Non-specific intermolecular contacts between all residue types underlie FUS LC LLPS.
A) Equimolar amounts of 15N-labeled and 13C-label FUS LC were used to create a condensed macroscopic phase in order to conduct HSQC-NOESY-HSQC experiments. B) NOE strips (left) from SCα, YCδ, GCα, and QCγ show NOEs from 15N regions (right) corresponding to the dashed lines. C, D, E, F) Quantification of NOEs from 15N labeled residues to 13C labeled residues from the serine and threonine backbone regions (C), glutamine/tyrosine backbone regions (D), glutamine/asparagine side-chain regions (E), and glycine backbone regions (F) with corresponding NOE snapshots from a two-chain simulation of FUS LC. The simulated structures were not calculated from the experimental data but are provided to show examples of the types of contacts that would generate the observed NOE profiles. Small contributions from intramolecular interactions were eliminated by subtracting the peak intensity from a control experiment on an equimolar 15N-labeled and natural abundance sample. Gray lines indicate the noise level of the two-dimensional plane. Data are plotted as peak height mean ± uncertainty equal to r.m.s.d. of baseline noise in one representative data set out of two experiments. G) Intermolecular interaction profiles calculated from a two-chain simulation of FUS120-163 binned by residue type. H) Intermolecular interaction profiles calculated from a two-chain simulation of FUS120-163 binned by residue position.
Figure 4.
Figure 4.. Interactions in the condensed phase are dispersed throughout the entire sequence.
A) Schematic of the experimental design for the paramagnetic relaxation enhancement experiments. B) Intermolecular paramagnetic relaxation enhancements of condensed 15N FUS LC in the presence of minor amounts of FUS LC labeled at positions A16C, S86C, and S142C. Gray bars correspond to all tyrosines residues. Data are plotted as mean ± best-fit parameter confidence interval equal to 1 s.d. in one data set. C) Observation of NOEs to all observable backbone positions (15N) from all sidechain 13C positions TCγ, QCγ, SCβ, GCα, YCε, and YCδ in 13C-HSQC-NOESY-15N-HSQC planes. Spectral intensity in all planes contoured to the same level. Asterisks indicate incomplete filtering of unlabeled (14N) positions in 13C14N component of sample. D) Predicted intermolecular PRE profiles calculated from FUS LC slab simulations at 300K.
Figure 5.
Figure 5.. Hydrogen bonding interactions and glutamines contribute to stabilizing FUS LC LLPS.
A) Average number of hydrogen bonds from the backbone and side chain for each residue calculated from a two-chain simulation of FUS120-163. Hydrogen bonds between backbone/side chain and all atoms of the other molecules are considered. Data are plotted as mean ± s.e.m of n=5 equal divisions of the total data set. Tyrosine and glutamine residues are highlighted with gray and red bars, respectively. B) Average number of intermolecular hydrogen bonds formed by each residue type. Data are plotted as mean ± s.e.m of n=5 equal divisions of the total data set. C) Example of hydrogen-bonding interactions from the two-chain simulation of FUS120-163. D) Schematic of different FUS LC variants used. QQ4SS #1 and QQ4SS #2 are variants in which eight glutamine residues have been mutated to serine. S12xQ is a variant in which twelve serines have been mutated to glutamine. E) Phase separation assay and F) quantification of the partition coefficient of the glutamine and serine variants in 1M NaCl at 4°C. Data are plotted as mean ± s.d. of n=3 technical replicates.
Figure 6.
Figure 6.. Hydrophobic and π/sp2 contacts contribute to FUS LC LLPS.
A) Average number of hydrophobic contacts for any two heavy hydrophobic atoms within 6 Å of each other from a two-chain simulation of FUS120-163. Data are plotted as mean ± s.e.m of n=5 equal divisions of the total data set. B) Average number of intermolecular hydrophobic contacts formed by each residue type. Data are plotted as mean ± s.e.m of n=5 equal divisions of the total data set. C) Example of hydrophobic interactions from the two-chain simulation of FUS120-163. D) Average number of π/sp2 contacts from the backbone and side chain for each residue calculated from a two-chain simulation of FUS120-163 Data are plotted as mean ± s.e.m of n=5 equal divisions of the total data set. Tyrosine and glutamine residues are highlighted with gray and red bars, respectively. E) Average number of π/sp2 contacts formed by each residue type. Data are plotted as mean ± s.e.m of n=5 equal divisions of the total data set. F,G) The Hofmeister salt series changes the amount of protein left in the dispersed phase according to their chaotropic or kosmotropic qualities for both FUS LC (F) and full-length FUS (G). Data are plotted as mean ± s.d. of n=3 technical replicates.
Figure 7.
Figure 7.. Interactions between FUS LC molecules that stabilize LLPS are structurally heterogeneous.
FUS LC is predominately disordered in the condensed phase. The interactions that stabilize the condensed phase involve all of the residue types that are represented in the sequence. Due to the disordered nature of FUS LC, there is not one structural ensemble that fully represents the interactions that stabilize the condensed phase. Here we provide a model for the dynamic and structurally heterogeneous intermolecular contacts that may stabilize FUS LC phase separation, based on snapshots of intermolecular contacts from two-chain simulations. Example configurations derived from the structural ensemble are aligned to the residue named along the vertical axis (yellow) and the diversity of contact poses with the residue named along the horizontal axis (cyan) are displayed.

References

    1. Brangwynne CP, Mitchison TJ & Hyman AA Active liquid-like behavior of nucleoli determines their size and shape in Xenopus laevis oocytes. Proc. Natl. Acad. Sci 108, 4334–4339 (2011). - PMC - PubMed
    1. Brangwynne CP et al. Germline P granules are liquid droplets that localize by controlled dissolution/condensation. Science (80-. ). 324, 1729–1732 (2009). - PubMed
    1. Mitrea DM & Kriwacki RW Phase separation in biology; functional organization of a higher order. Cell Commun. Signal. 14, 1 (2016). - PMC - PubMed
    1. King OD, Gitler AD & Shorter J The tip of the iceberg: RNA-binding proteins with prion-like domains in neurodegenerative disease. Brain Research 1462, 61–80 (2012). - PMC - PubMed
    1. Burke KA, Janke AM, Rhine CL & Fawzi NL Residue-by-Residue View of In Vitro FUS Granules that Bind the C-Terminal Domain of RNA Polymerase II. Mol. Cell 60, 231–241 (2015). - PMC - PubMed

Methods-only References

    1. Delaglio F et al. NMRPipe: A multidimensional spectral processing system based on UNIX pipes. J. Biomol. NMR 6, 277–293 (1995). - PubMed
    1. Lee W, Tonelli M & Markley JL NMRFAM-SPARKY: Enhanced software for biomolecular NMR spectroscopy. Bioinformatics 31, 1325–1327 (2015). - PMC - PubMed
    1. Wang C, Grey MJ & Palmer AG CPMG sequences with enhanced sensitivity to chemical exchange. J. Biomol. NMR 21, 361–366 (2001). - PubMed
    1. Fawzi NL, Ying J, Torchia DA & Clore GM Kinetics of amyloid β monomer-to-oligomer exchange by NMR relaxation. J. Am. Chem. Soc 132, 9948–9951 (2010). - PMC - PubMed
    1. Liu Y, Lee YJ & Cicerone MT Broadband CARS spectral phase retrieval using a time-domain Kramers – Kronig transform. Opt. Lett 34, 1363–1365 (2009). - PMC - PubMed

Publication types

Substances