

Magnetic Resonance Imaging Assessment of Blood Flow Distribution in Fenestrated and Completed Fontan Circulation with Special Emphasis on Abdominal Blood Flow
- PMID: 31270982
- PMCID: PMC6609425
- DOI: 10.3348/kjr.2018.0921
Magnetic Resonance Imaging Assessment of Blood Flow Distribution in Fenestrated and Completed Fontan Circulation with Special Emphasis on Abdominal Blood Flow
Abstract
Objective: To investigate the regional flow distribution in patients with Fontan circulation by using magnetic resonance imaging (MRI).
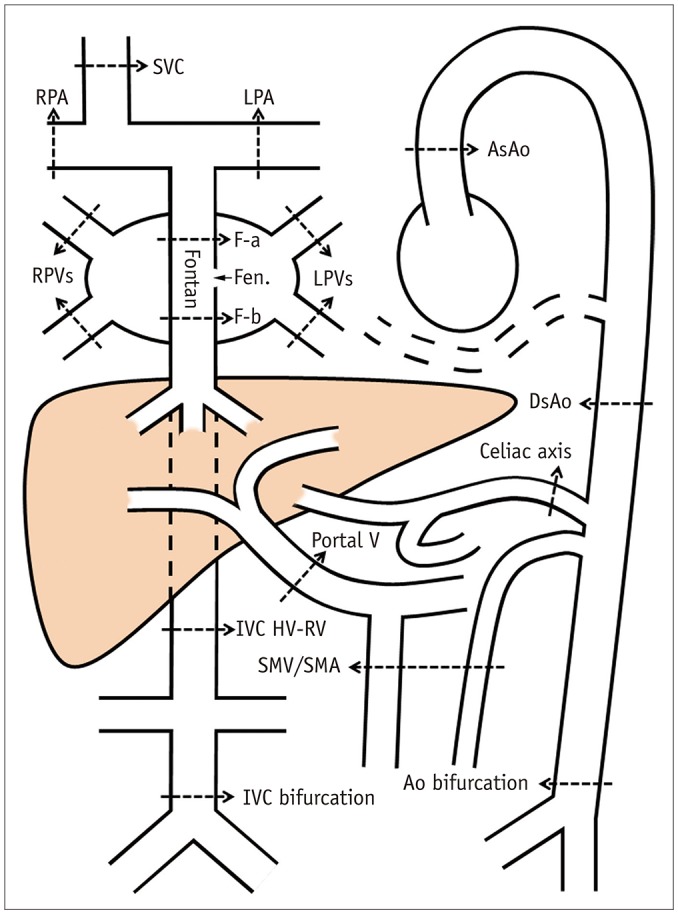
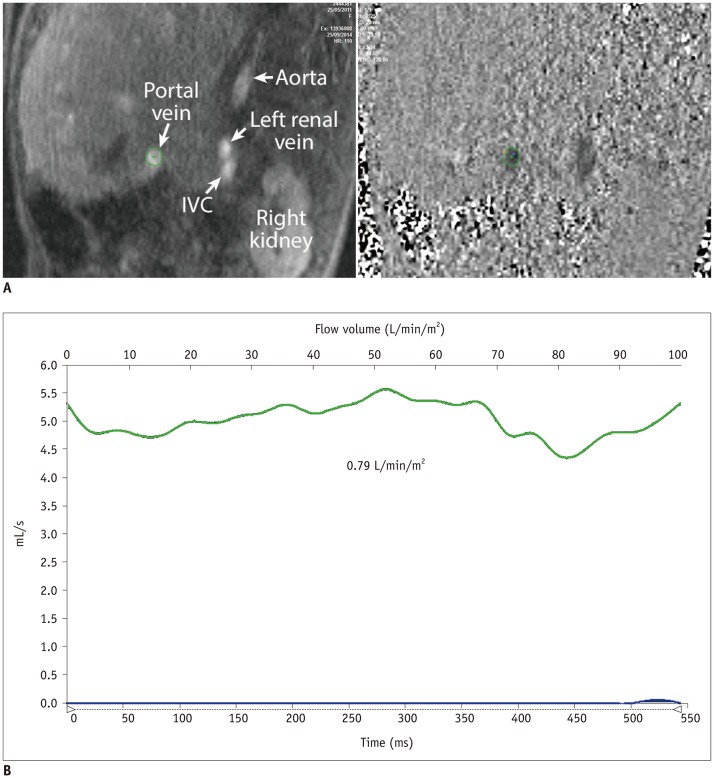
Materials and methods: We identified 39 children (18 females and 21 males; mean age, 9.3 years; age range, 3.3-17.0 years) with Fontan circulation in whom flow volumes across the thoracic and abdominal arteries and veins were measured by using MRI. The patients were divided into three groups: fenestrated Fontan circulation group with MRI performed under general anesthesia (GA) (Group 1, 15 patients; average age, 5.9 years), completed Fontan circulation group with MRI performed under GA (Group 2, 6 patients; average age, 8.7 years), and completed Fontan circulation group with MRI performed without GA (Group 3, 18 patients; average age, 12.5 years). The patient data were compared with the reference ranges in healthy controls.
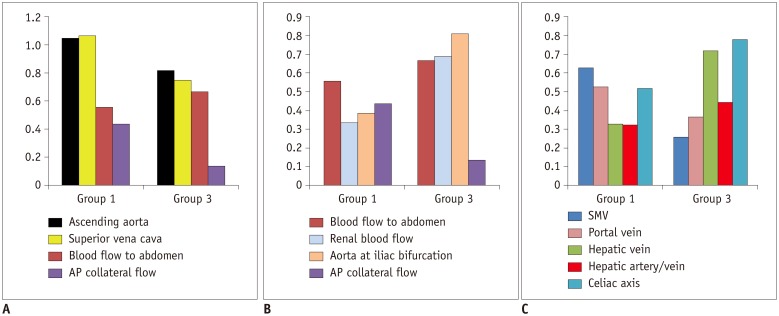
Results: In comparison with the controls, Group 1 showed normal cardiac output (3.92 ± 0.40 vs. 3.72 ± 0.69 L/min/m², p = 0.30), while Group 3 showed decreased cardiac output (3.24 ± 0.71 vs. 3.96 ± 0.64 L/min/m², p = 0.003). Groups 1 and 3 showed reduced abdominal flow (1.21 ± 0.28 vs. 2.37 ± 0.45 L/min/m², p < 0.001 and 1.89 ± 0.39 vs. 2.64 ± 0.38 L/min/m², p < 0.001, respectively), which was mainly due to the diversion of the cardiac output to the aortopulmonary collaterals in Group 1 and the reduced cardiac output in Group 3. Superior mesenteric and portal venous flows were more severely reduced in Group 3 than in Group 1 (ratios between the flow volumes of the patients and healthy controls was 0.26 and 0.37 in Group 3 and 0.63 and 0.53 in Group 1, respectively). Hepatic arterial flow was decreased in Group 1 (0.11 ± 0.22 vs. 0.34 ± 0.38 L/min/m², p = 0.04) and markedly increased in Group 3 (0.38 ± 0.22 vs. -0.08 ± 0.29 L/min/m², p < 0.0001). Group 2 showed a mixture of the patterns seen in Groups 1 and 3.
Conclusion: Fontan circulation is associated with reduced abdominal flow, which can be attributed to reduced cardiac output and portal venous return in completed Fontan circulation, and diversion of the cardiac output to the aortopulmonary collaterals in fenestrated Fontan circulation.
Keywords: Abdominal flow; Fenestrated Fontan; Fontan associated liver disease; Fontan operation; Protein-losing enteropathy.
Copyright © 2019 The Korean Society of Radiology.
Conflict of interest statement
The authors have no potential conflicts of interest to disclose.
Figures
References
-
- Rychik J. The relentless effects of the Fontan paradox. Semin Thorac Cardiovasc Surg Pediatr Card Surg Annu. 2016;19:37–43. - PubMed
-
- Gewillig M, Goldberg DJ. Failure of the fontan circulation. Heart Fail Clin. 2014;10:105–116. - PubMed
-
- Bridges ND, Jonas RA, Mayer JE, Flanagan MF, Keane JF, Castaneda AR. Bidirectional cavopulmonary anastomosis as interim palliation for high-risk Fontan candidates. Early results. Circulation. 1990;82(5 Suppl):IV170–IV176. - PubMed
-
- Bridges ND, Lock JE, Castaneda AR. Baffle fenestration with subsequent transcatheter closure. Modification of the Fontan operation for patients at increased risk. Circulation. 1990;82:1681–1689. - PubMed
-
- de Leval MR. Evolution of the Fontan-Kreutzer procedure. Semin Thorac Cardiovasc Surg Pediatr Card Surg Annu. 2010;13:91–95. - PubMed
MeSH terms
LinkOut - more resources
Full Text Sources
