. 2019 Jul 18;40(4):293-304.
doi: 10.24272/j.issn.2095-8137.2019.042. Epub 2019 Jun 3.

Allele-specific expression and alternative splicing in horse×donkey and cattle×yak hybrids

Affiliations

Allele-specific expression and alternative splicing in horse×donkey and cattle×yak hybrids

Yu Wang et al. Zool Res. .

Abstract

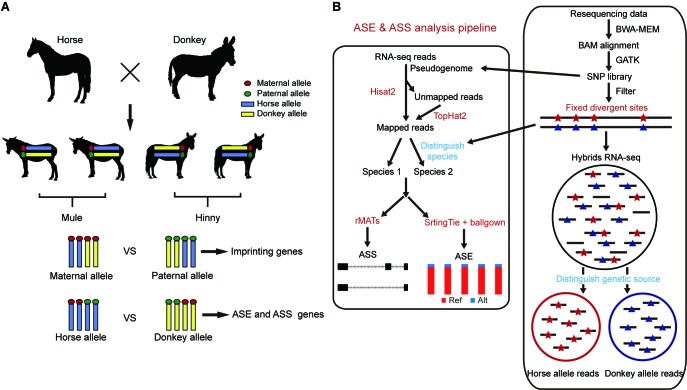
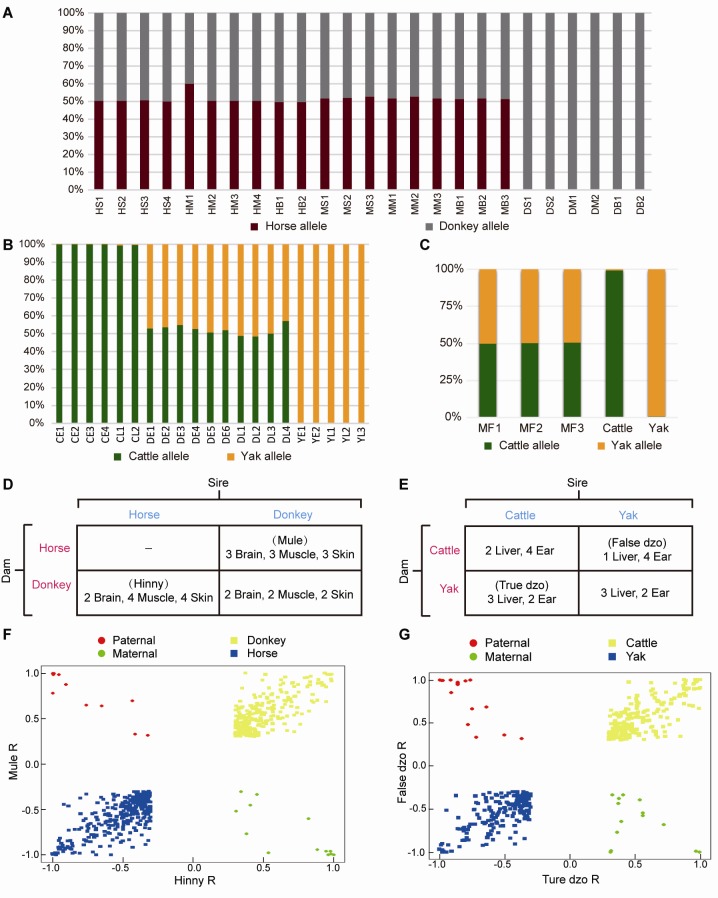
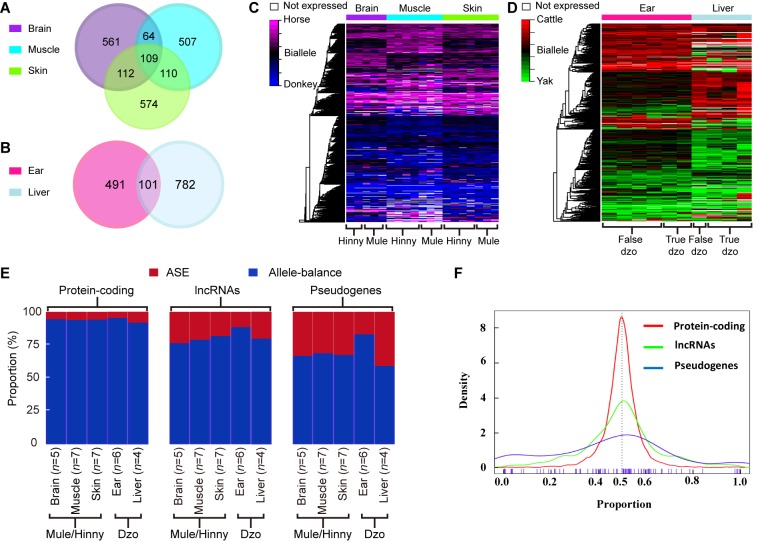
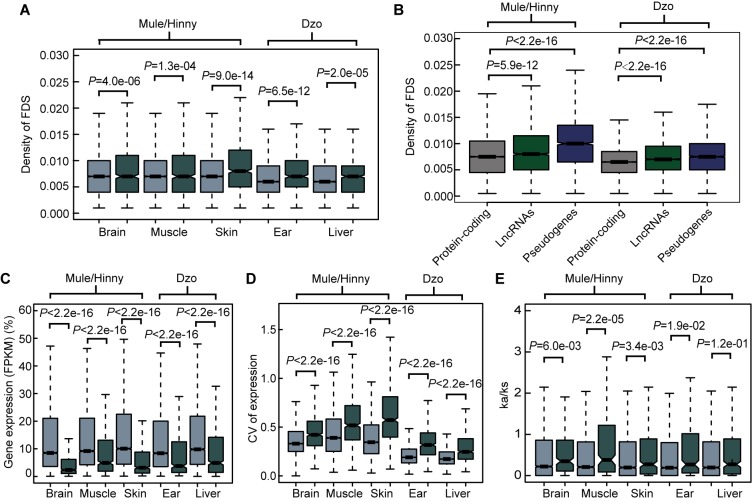
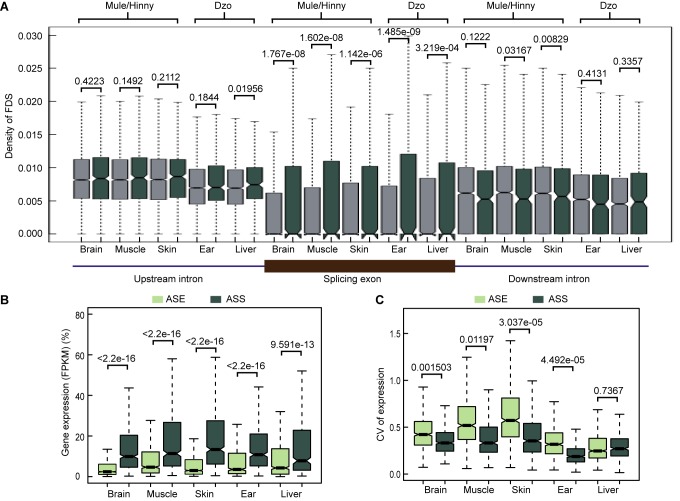
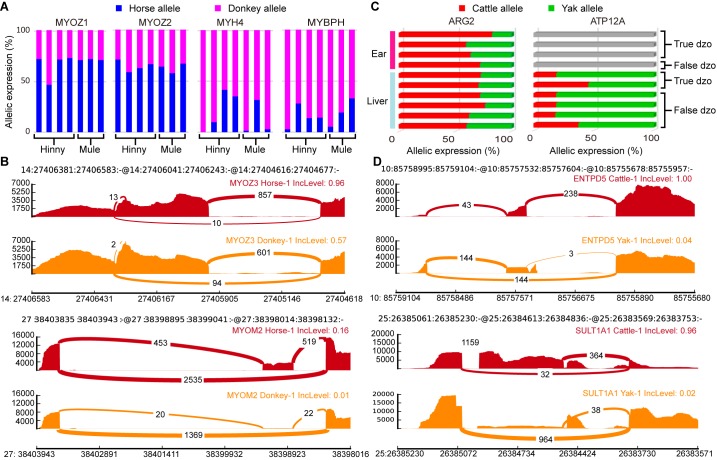
Divergence of gene expression and alternative splicing is a crucial driving force in the evolution of species; to date, however the molecular mechanism remains unclear. Hybrids of closely related species provide a suitable model to analyze allele-specific expression (ASE) and allele-specific alternative splicing (ASS). Analysis of ASE and ASS can uncover the differences in cis-regulatory elements between closely related species, while eliminating interference of trans-regulatory elements. Here, we provide a detailed characterization of ASE and ASS from 19 and 10 transcriptome datasets across five tissues from reciprocal-cross hybrids of horse×donkey (mule/hinny) and cattle×yak (dzo), respectively. Results showed that 4.8%-8.7% and 10.8%-16.7% of genes exhibited ASE and ASS, respectively. Notably, lncRNAs and pseudogenes were more likely to show ASE than protein-coding genes. In addition, genes showing ASE and ASS in mule/hinny were found to be involved in the regulation of muscle strength, whereas those of dzo were involved in high-altitude adaptation. In conclusion, our study demonstrated that exploration of genes showing ASE and ASS in hybrids of closely related species is feasible for species evolution research.

Keywords: Allele-specific alternative splicing; Allele-specific expression; Cis-regulatory elements; Hybrid species.


Conflict of interest statement

The authors declare that they have no competing interests.

Figures

Figure 1
Figure 1. Pipeline for ASE and ASS analysis
Resequencing data were mapped to the genome using BWA. Divergent site calling was then performed by GATK. The pseudogenome was constructed. Divergent sites were filtered by RNA-seq data and used to calculate ASE. Hybrid transcriptomes were divided into two genetic allelic samples using fixed divergent sites. Separated genetic allelic samples were used to calculate ASS. rMATS: Replicate multivariate analysis of transcript splicing. Ref: Reference allele; Alt: Alternative allele.
Figure 2
Figure 2. Reciprocal-cross hybrid samples to identify ASE
A: RNA-seq paired-end reads of mule/hinny and donkey were assigned a genetic allele origin. Proportions of the horse and donkey allele origins are shown. HS: Hinny skin tissue; HM: Hinny muscle tissue; HB: Hinny brain tissue; MS: Mule skin tissue; MM: Mule muscle tissue; MB: Mule brain tissue; DS: Donkey skin tissue; DM: Donkey muscle tissue; DB: Donkey brain tissue. B: RNA-seq reads of cattle, yak, and dzo were assigned a genetic allele origin. Proportions of cattle and yak allele origin are shown. CE: Cattle ear tissue; CL: Cattle liver tissue; DE: Dzo ear tissue; DL: Dzo liver tissue; YE: Yak ear tissue; YL: Yak liver tissue. C: Mock hybrid transcriptomes were assigned a genetic allele origin. MF: Mock hybrids. D: Sample and diallel crossing scheme of horse and donkey, mule (female horse×male donkey), and hinny (male horse×female donkey). E: Sample and diallel crossing scheme of cattle and yak, true dzo (male cattle×female yak), and false dzo (female cattle×male yak). F: Distribution of skew (R) values (where read ratio R=(horse-donkey)/(horse+donkey)) from -1 to 1 for genes showing ASE (yellow, blue) and imprinting genes (red, green) in mule and hinny brain tissues. G: Distribution of skew (R) values in true and false dzo ear tissues (R= (cattle-yak)/(cattle+yak)).
Figure 3
Figure 3. Genes showing ASE in mule/hinny and dzo
Number of shared and unique genes showing ASE in brain, muscle, and skin tissues of mule/hinny (A), and ear and liver tissues of dzo (B). Heatmap of genes showing ASE (n=2 037) in brain, muscle, and skin samples of mule/hinny (C), and ear and liver samples of dzo (D). Genes are colored based on ASE score (red-green scale from 100%–0% horse and cattle allele expression). Side color bar shows tissues. E: Proportion of protein-coding genes, lncRNAs, and pseudogenes showing ASE and allele-balanced expression in all tested tissues of mule/hinny and dzo. Numbers of samples from each tissue are provided. F: Distribution of allelic expression ratios of protein-coding genes, lncRNAs, and pseudogenes.
Figure 4
Figure 4. Features of genes showing ASE
A: Densities of FDSs in promoter (2 kb upstream of TSS) of genes showing ASE and genes showing allele-balanced expression. B: Densities of FDSs in promoter of protein-coding genes, lncRNAs, and pseudogenes. C: Distribution of expression levels of genes showing ASE and genes showing allele-balanced expression in all tested tissues. D: Distribution of expression diversities (CV) of genes showing ASE and genes showing allele-balanced expression in all tested tissues. CV: Coefficient of variation of gene expression level in biological replicates. E: Distribution of Ka/Ks values of genes showing ASE and genes showing allele-balanced expression. Genes showing ASE are in dark-gray and genes showing allele-balanced expression are in light-gray. P-value was from Wilcoxon test.
Figure 5
Figure 5. Features of genes showing ASS
A: Densities of FDSs in exons, upstream introns, and downstream introns of ASS and non-ASS events (Wilcoxon test). B: Comparison of expression levels of genes showing ASE and genes showing ASS. C: Comparison of expression diversities (comparison of genes) of genes showing ASE and genes showing ASS.
Figure 6
Figure 6. Functional analysis of genes showing ASE and ASS
A: Allelic expression ratios of four muscle function-related ASE genes, MYOZ1, MYOZ2, MYH4, and MYBPH, in mule/hinny muscle samples. Horse allele (blue); donkey allele (purple). B: Sashimi plot of muscle-related genes showing ASS, MYOZ3, and MYOM2, in mule/hinny muscle samples. Read densities supporting inclusion and exclusion of exons are shown. C: Proportion of ARG2 and ATP12A expression levels from cattle allele (red) or yak allele (green) in four liver and six ears samples of dzo. Gray bar indicates no expression. D: Sashimi plot of two genes showing ASS (ENTPD5 and SULT1A1) in dzo. Read densities supporting inclusion and exclusion of exons are shown.

References

    1. Babbitt CC, Fedrigo O, Pfefferle AD, Boyle AP, Horvath JE, Furey TS, Wray GA. 2010. Both noncoding and protein-coding RNAs contribute to gene expression evolution in the Primate Brain. Genome Biology and Evolution, 2: 67–79. - PMC - PubMed
    1. Bellucci E, Bitocchi E, Ferrarini A, Benazzo A, Biagetti E, Klie S, Minio A, Rau D, Rodriguez M, Panziera A, Venturini L, Attene G, Albertini E, Jackson SA, Nanni L, Fernie AR, Nikoloski Z, Bertorelle G, Delledonne M, Papa R. 2014. Decreased nucleotide and expression diversity and modified coexpression patterns characterize domestication in the Common Bean. The Plant Cell, 26(5): 1901–1912. - PMC - PubMed
    1. Bolger AM, Lohse M, Usadel B. 2014. Trimmomatic: a flexible trimmer for Illumina sequence data. Bioinformatics, 30(15): 2114–2120. - PMC - PubMed
    1. Brown JB, Boley N, Eisman R, May GE, Stoiber MH, Duff MO, Booth BW, Wen J, Park S, Suzuki AM, Wan KH, Yu C, Zhang D, Carlson JW, Cherbas L, Eads BD, Miller D, Mockaitis K, Roberts J, Davis CA, Frise E, Hammonds AS, Olson S, Shenker S, Sturgill D, Samsonova AA, Weiszmann R, Robinson G, Hernandez J, Andrews J, Bickel PJ, Carninci P, Cherbas P, Gingeras TR, Hoskins RA, Kaufman TC, Lai EC, Oliver B, Perrimon N, Graveley BR, Celniker SE. 2014. Diversity and dynamics of the Drosophila transcriptome. Nature, 512(7515): 393–399. - PMC - PubMed
    1. Crowley JJ, Zhabotynsky V, Sun W, Huang S, Pakatci IK, Kim Y, Wang JR, Morgan AP, Calaway JD, Aylor DL, Yun Z, Bell TA, Buus RJ, Calaway ME, Didion JP, Gooch TJ, Hansen SD, Robinson NN, Shaw GD, Spence JS, Quackenbush CR, Barrick CJ, Nonneman RJ, Kim K, Xenakis J, Xie Y, Valdar W, Lenarcic AB, Wang W, Welsh CE, Fu C, Zhang Z, Holt J, Guo Z, Threadgill DW, Tarantino LM, Miller DR, Zou F, Mcmillan L, Sullivan PF, De Villena FP. 2015. Analyses of allele-specific gene expression in highly divergent mouse crosses identifies pervasive allelic imbalance. Nature Genetics, 47: 353–360. - PMC - PubMed

Associated data