. 2019 Sep 4;103(5):802-819.e11.
doi: 10.1016/j.neuron.2019.05.048. Epub 2019 Jul 1.

Small-Molecule Modulation of TDP-43 Recruitment to Stress Granules Prevents Persistent TDP-43 Accumulation in ALS/FTD

Affiliations

Small-Molecule Modulation of TDP-43 Recruitment to Stress Granules Prevents Persistent TDP-43 Accumulation in ALS/FTD

Mark Y Fang et al. Neuron. .

Abstract

Stress granules (SGs) form during cellular stress and are implicated in neurodegenerative diseases such as amyotrophic lateral sclerosis and frontotemporal dementia (ALS/FTD). To yield insights into the role of SGs in pathophysiology, we performed a high-content screen to identify small molecules that alter SG properties in proliferative cells and human iPSC-derived motor neurons (iPS-MNs). One major class of active molecules contained extended planar aromatic moieties, suggesting a potential to intercalate in nucleic acids. Accordingly, we show that several hit compounds can prevent the RNA-dependent recruitment of the ALS-associated RNA-binding proteins (RBPs) TDP-43, FUS, and HNRNPA2B1 into SGs. We further demonstrate that transient SG formation contributes to persistent accumulation of TDP-43 into cytoplasmic puncta and that our hit compounds can reduce this accumulation in iPS-MNs from ALS patients. We propose that compounds with planar moieties represent a promising starting point to develop small-molecule therapeutics for treating ALS/FTD.

Keywords: ALS-FTD; TDP-43; high-content screening; motor neurons; planar molecule; stress granule.


Conflict of interest statement

DECLARATION OF INTERESTS

GWY is co-founder, member of the Board of Directors, equity holder, on SAB and paid consultant for Locana and Eclipse BioInnovations. GWY is also a visiting faculty at the National University of Singapore, Singapore. The terms of this arrangement have been reviewed and approved by the University of California, San Diego in accordance with its conflict of interest policies. The authors declare no other competing financial interests.

Figures

Figure 1.
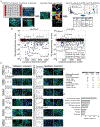
Figure 1.. SG Reporter Lines Enable Robust Image-based Screening
(A) GFP construct inserted in endogenous G3BP1 locus. AoH: arm of homology. (B) NPC differentiation from hiPSCs. EB: embryoid bodies, PMA: Purmorphamine, CH: CHIR99021, AA: L-Ascorbic acid, SB: SB431542, DM: Dorsomorphin. (C) Representative images of G3BP1-GFP SG reporter lines under no stress, NaAsO2 stress (HEK293xT cells/NPCs/iPS-MNs: 500/250/100 μM, 60 min) and NaAsO2 stress plus CHX pre-treatment (10 μM, 60 min). n=4 biological replicates. Scale bar is 50 μm. NaAsO2: sodium arsenite, CHX: cycloheximide. (D) Screening paradigm: cells were pre-treated with compounds (10 μM, 60 min) followed by NaAsO2 stress (293/NPC: 500/250 μM, 60 min). (E) Quantification of SG area/nuclei area for varying concentrations of CHX pre-treatment (60 min) and NaAsO2 stress (60 min). Z’ for the screen assay: Z=13(σ^p+σ^n)μ^pμ^n where σ^p and σ^n are sample standard deviations (SD) and μ^p and μ^n are sample means for positive and negative controls. Bars are mean + SD. n=4 biological replicates. See also Figure S1.
Figure 2.
Figure 2.. High-content Screening Identifies Diverse Classes of SG-modulating Compounds
(A) Experimental/computational pipeline for screen. Scale bars are 50 μm. (B) Scatterplots of amount of SG formation (SG area/nuclei area) for screen. Means of two to four biological duplicate b-scores are represented. Red points: negative controls (no compound). Green points: positive controls (CHX or EME). Blue points: compounds which significantly reduced amount of SG formation (p<0.001, modified one sample t-tests). EME: emetine. (C) Left: screen hit compounds, skeletal formulae and compound classifications by the reported cellular targets in the National Center for Biotechnology Information (NCBI) PubChem database. Right: Representative images from screen. n≥2 biological replicates. Scale bar is 50 μm. (D) Numbers of SG-modulating compounds. Amount of SG formation = SG area/nuclei area. Number of SG = SG count/nuclei area. Average SG size = SG area/SG count. (E) Classification of hit compounds by their reported cellular targets in the NCBI PubChem database. See also Figure S2 and Tables S1-4.
Figure 3.
Figure 3.. Hit Compounds Robustly Inhibit SGs Across Multiple Stress Contexts
(A) Left: assay for dose-dependent inhibition of NaAsO2-induced SG formation (293/NPC: 500/250 μM, 60 min). Right: scatterplots and logistic regressions of dose-dependent reduction of SG area/nuclei area by pre-treatment with mitoxantrone (0.12-30 μM, 60 min) or DMSO. Points are mean ± SD. n=4 biological replicates. (B) IC50s for SG inhibiting compounds, estimated from midpoints of logistic curves fitted by least squares regression. (C-E) Left: assay for inhibiting SG formation under heat shock stress (C; 43°C, 60 min) or thapsigargin stress (D; 293/NPC: 50/1 μM, 60 min), or reversing NaAsO2-induced SG formation (E; 293/NPC: 250/100 μM, 60 min). Center: representative images of cells treated with DMSO, mitoxantrone or digitoxin (10 μM, 60 min) followed by heat shock stress (C) or thapsigargin stress (D), or after cells had been pre-stressed with NaAsO2 (E). Scale bars are 50 μm. Right: quantification of SG area/nuclei area in cells treated with hit compounds (10 μM, 60 min) followed by heat shock stress (C) or thapsigargin stress (D), or after cells had been pre-stressed with NaAsO2 (E). *p < 0.05, **p < 0.01, ***p < 0.001, two sample t-tests to DMSO. Bars are mean + SD. n=4 biological replicates. (F) Numbers of compounds which reduced SG area/nuclei area in counterscreens. (G) Venn diagrams showing numbers of compounds which reduced SG area/nuclei area in one or more counterscreens. (H) Top: Representative blots of phosphorylated versus total eIF2α in cells pre-treated with hit compounds (10 μM, 60 min) and stressed with NaAsO2 (293/NPC: 500 μM, 40 min/250 μM, 60 min). Bottom: quantification of blots of phosphorylated eIF2α, as in (H, top panel). *p < 0.05, **p < 0.01, ***p < 0.001, one sample t-tests. Bars are mean + SD. n=3 experimental replicates. See also Figures S3-4 and Table S5.
Figure 4.
Figure 4.. Hit Compounds Inhibit SG Formation in iPS-MNs
(A-C) Left: Representative immunofluorescence (IF) images of iPS-MNs pre-treated with mitoxantrone (10 μM, 80 min) or DMSO and stressed with NaAsO2 (A; 100 μM, 120 min) or thapsigargin (B; 250 nM, 120 min), or treated with mitoxantrone + puromycin (C; 5 μM + 5 μg/mL, 12h). Scale bars are 20 μm. Right: quantification of SG area/nuclei area of iPS-MNs pre-treated with screen compounds (10 μM, 80 min) and stressed with NaAsO2 (A) or thapsigargin (B), or treated with screen compounds + puromycin (C; 5 μM + 5 μg/mL, 12h). *p < 0.05, **p < 0.01, ***p < 0.001, two sample t-tests to DMSO. Bars are mean + SD. n≥5 biological replicates of each of four control, four TARDBP mutant and two FUS mutant lines. See also Figure S5 and Tables S6-7.
Figure 5.
Figure 5.. Recruitment of ALS-associated RBPs into SGs is RNA-dependent
(A-C) Representative images (A), silver stains (B) and Western blots (C) of SG-enriched fractions from unstressed versus NaAsO2 stressed (293/NPC: 500/250 μM, 60 min) cells. Arrows: bands stronger in fractions from stressed cells. Arrowheads: bands fainter in fractions from stressed cells. Stars: cell-type specific differences in band intensity changes. n=3 experimental replicates. Scale bar is 20 μm. (D) Quantification of blots as in (C). SG band intensities are divided by input band intensities, normalized to G3BP1, and log2-transformed. *p < 0.05, **p < 0.01, one sample t-tests. Bars are mean ± SD. n=3 experimental replicates.
Figure 6.
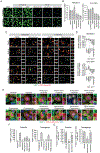
Figure 6.. Molecules with Planar Moieties Reduce ALS-associated RBPs from SGs
(A-B) Representative images (A) and quantification of total SG area (B) of NaAsO2-induced, G3BP1-GFP-positive SG-enriched fractions incubated with SG inhibiting compounds (100 μM, overnight) versus DMSO. **p < 0.01, ***p < 0.001, two sample t-tests to DMSO. Bars are mean + sem. n=45 images from 3 experimental replicates. Scale bar is 10 μm. (C-D) Representative IF images (C) and quantifying change in Manders’ correlation coefficient of co-localization between G3BP1-GFP and IF stained RBPs (D) of NaAsO2-induced (293/NPC: 500/250 μM, 60 min) SG-enriched fractions incubated with mitoxantrone (100 μM, overnight) versus DMSO. Arrowheads: G3BP1-GFP-positive SGs with reduced IF staining of RBPs. G3BP1 staining serves as IF staining control. *p < 0.05, **p < 0.01, one sample t-tests. Bars are mean ± standard error of the mean (sem). n=45 images from 3 experimental replicates. Scale bar is 10 μm (5 μm for inset). RBP: RNA binding protein. (E) Representative images of H4 cells expressing exogenous G3BP1-mCherry (false-colored green for consistency) and doxycycline-inducible GFP-TDP-43ΔNLS (residues 86-414; false-colored red). Cells were pre-treated with hit compounds (5 μM, 30 min) and stressed with NaAsO2 or thapsigargin (500 or 5 μM, 60 min). Arrows: co-localized G3BP1-mCherry and GFP-TDP-43ΔNLS puncta. Arrowheads: G3BP1-mCherry-only puncta. Stars: GFP-TDP-43ΔNLS-only puncta. n≥14 cells. Scale bar is 50 μm (20 μm for inset). NLS: nuclear localization signal. (F) Quantification of total G3BP1-mCherry puncta area, as in images in (E). *p < 0.05, ***p < 0.001, two sample t-tests to DMSO. Bars are mean + sem. n≥35 cells. (G) Quantification of the fraction of G3BP1-mCherry puncta area that has co-localized GFP-TDP-43ΔNLS, as in images in (E). **p < 0.01, ***p < 0.001, two sample t-tests to DMSO. Bars are mean + sem. n≥14 cells. See also Figure S7.
Figure 7.
Figure 7.. Puromycin-stressed Mutant iPS-MNs Exhibit Persistent Cytoplasmic TDP-43 Puncta
(A-B) Representative IF images (A) and quantification of cytoplasmic TDP-43 puncta area/nuclei area (B) of iPS-MNs during puromycin stress (5 μg/mL, 24h) and recovery following puromycin washout (24h). Arrows: cytoplasmic TDP-43 and G3BP1 puncta. Arrowheads: G3BP1-only puncta. *p < 0.05, ***p < 0.001, two sample t-tests to control iPS-MNs. Points are mean ± sem. n≥5 biological replicates of each of four control and four TARDBP mutant lines. Scale bar is 20 μm (10 μm for inset). (C-E) Left: Representative blots of TDP-43 (C), FUS (D) or HNRNPA2B1 (E) in SG-enriched fractions from iPS-MNs under no stress, puromycin stress (5 μg/mL, 24h) or puromycin stress plus 24h recovery following puromycin washout. Right: quantification of blots as in (C-E, left panel). ***p < 0.05, two sample t-tests to control iPS-MNs. Bars are mean + SD. n=3 biological replicates of each of four control and four TARDBP mutant lines. (F-G) Representative IF images (F) and quantification of cytoplasmic TDP-43 puncta area/nuclei area (G) of iPS-MNs during puromycin stress (5 μg/mL, 24h) and recovery following puromycin washout (24h). Arrows: cytoplasmic TDP-43 and G3BP1 puncta. Brackets: broad regions of cytoplasmic TDP-43. Stars: TDP-43-only puncta. ***p < 0.001, two sample t-tests to control iPS-MNs. Points are mean ± sem. n≥5 biological replicates of each of four control and two FUS mutant lines. Scale bar is 20 μm (10 μm for inset). See also Figure S8.
Figure 8.
Figure 8.. Planar Compounds Reduce Persistent Cytoplasmic TDP-43 Puncta in iPS-MNs
(A-B) Representative IF images (A) and quantification of cytoplasmic TDP-43 puncta area/nuclei area (B) of iPS-MNs treated with SG inhibiting compounds (5 μM, 12h) and stressed with puromycin (5 μg/mL, 12h). Arrows: cytoplasmic TDP-43 and G3BP1 puncta. Arrowheads: G3BP1-only puncta. *p < 0.05, two sample t-tests to DMSO. Bars are mean + sem. n≥5 biological replicates of each of four control, four TARDBP mutant, and two FUS mutant lines. Scale bar is 20 μm (5 μm for inset). (C-D) Representative IF images (C) and quantification of cytoplasmic TDP-43 puncta area/nuclei area (D) of iPS-MNs pre-treated with SG inhibiting compounds (2 μM, 60 min), stressed with puromycin (5 μg/mL, 6h), and allowed to recover following puromycin washout (7h). Arrows: cytoplasmic TDP-43 puncta. **p < 0.01, two sample t-tests to puromycin-stressed, DMSO-treated cells. Bars are mean + sem. n=12 biological replicates of each of four TARDBP mutant lines. Scale bar is 20 μm (10 μm for inset). (E) Model of SG formation and progression to persistent cytoplasmic TDP-43 puncta. See discussion for full description. RBP: RNA-binding protein, IDR: intrinsically disordered region. See also Figure S8.

References

    1. Aittokallio T (2010). Dealing with missing values in large-scale studies: microarray data imputation and beyond. Brief Bioinform 11, 253–264. - PubMed
    1. Alami NH, Smith RB, Carrasco MA, Williams LA, Winborn CS, Han SSW, Kiskinis E, Winborn B, Freibaum BD, Kanagaraj A, et al. (2014). Axonal transport of TDP-43 mRNA granules is impaired by ALS-causing mutations. Neuron 81, 536–543. - PMC - PubMed
    1. Alberti S, Halfmann R, King O, Kapila A, and Lindquist S (2009). A systematic survey identifies prions and illuminates sequence features of prionogenic proteins. Cell 137, 146–158. - PMC - PubMed
    1. Arimoto K, Fukuda H, Imajoh-Ohmi S, Saito H, and Takekawa M (2008). Formation of stress granules inhibits apoptosis by suppressing stress-responsive MAPK pathways. Nature cell biology 10, 1324–1332 - PubMed
    1. Arrasate M, Mitra S, Schweitzer ES, Segal MR, and Finkbeiner S (2004). Inclusion body formation reduces levels of mutant huntingtin and the risk of neuronal death. Nature 431, 805–810. - PubMed

Publication types

MeSH terms

Supplementary concepts