. 2019 Jul 4;10(1):2960.
doi: 10.1038/s41467-019-10816-7.

Pooled clone collections by multiplexed CRISPR-Cas12a-assisted gene tagging in yeast

Affiliations

Pooled clone collections by multiplexed CRISPR-Cas12a-assisted gene tagging in yeast

Benjamin C Buchmuller et al. Nat Commun. .

Abstract

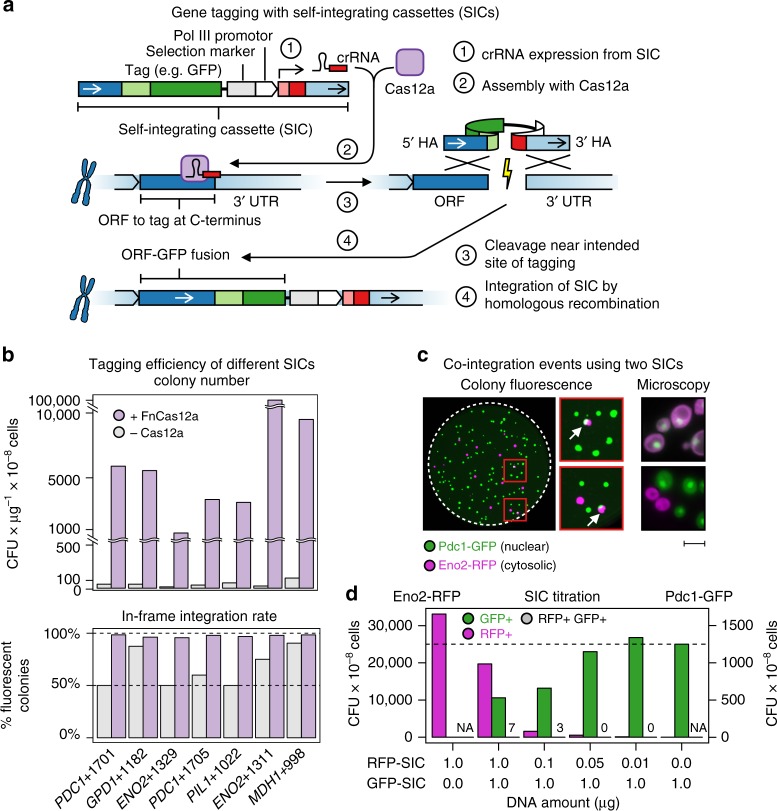
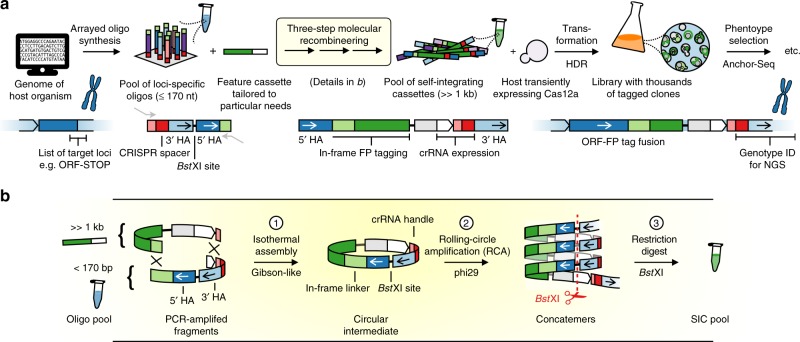
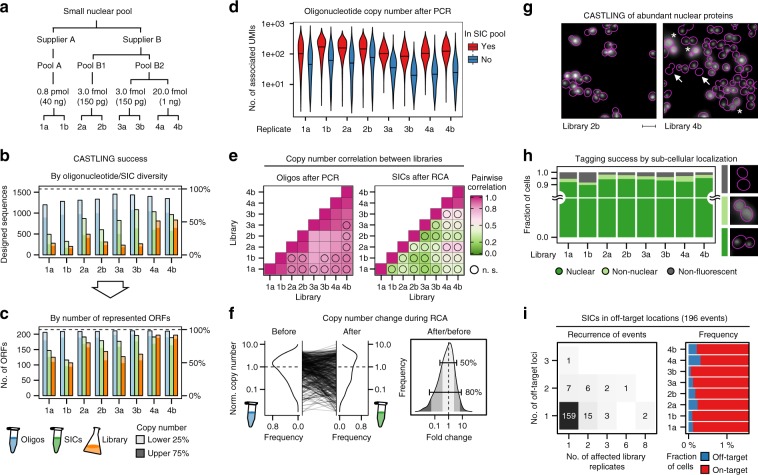
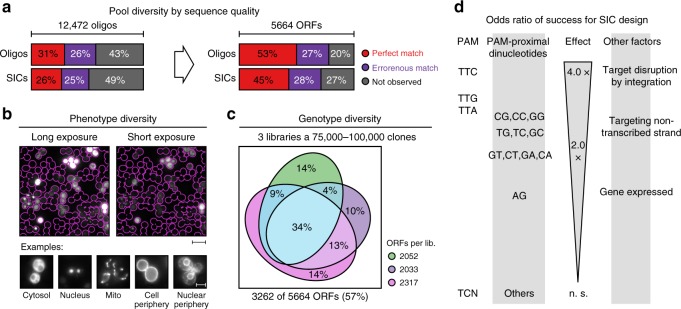
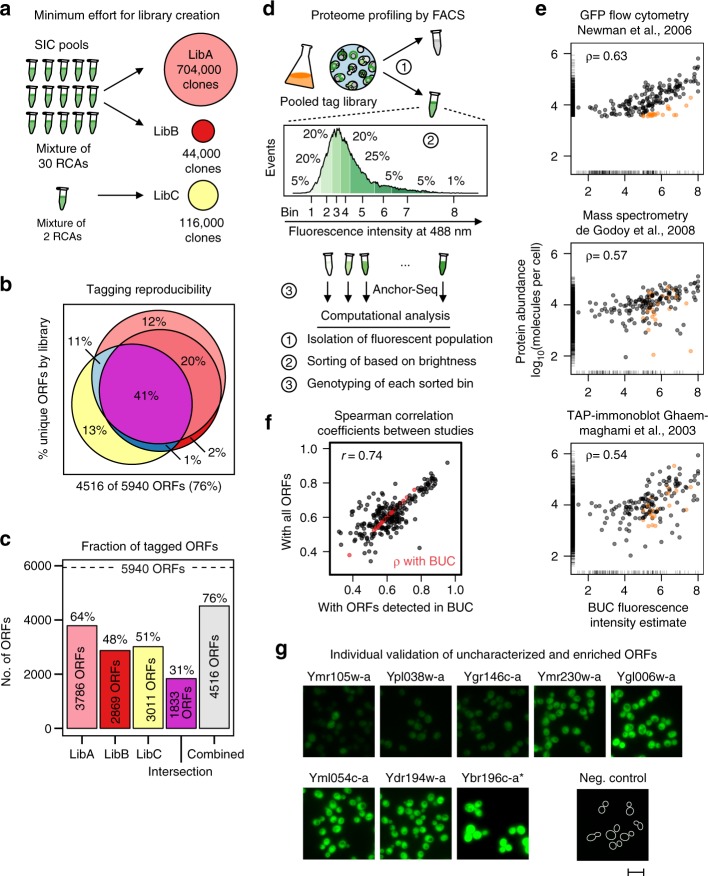
Clone collections of modified strains ("libraries") are a major resource for systematic studies with the yeast Saccharomyces cerevisiae. Construction of such libraries is time-consuming, costly and confined to the genetic background of a specific yeast strain. To overcome these limitations, we present CRISPR-Cas12a (Cpf1)-assisted tag library engineering (CASTLING) for multiplexed strain construction. CASTLING uses microarray-synthesized oligonucleotide pools and in vitro recombineering to program the genomic insertion of long DNA constructs via homologous recombination. One simple transformation yields pooled libraries with >90% of correctly tagged clones. Up to several hundred genes can be tagged in a single step and, on a genomic scale, approximately half of all genes are tagged with only ~10-fold oversampling. We report several parameters that affect tagging success and provide a quantitative targeted next-generation sequencing method to analyze such pooled collections. Thus, CASTLING unlocks avenues for increasing throughput in functional genomics and cell biology research.


Conflict of interest statement

The authors declare no competing interests.

Figures

Fig. 1
Fig. 1
CRISPR-Cas12a-assisted single gene-tagging in yeast. a After transformation of the self-integrating cassette (SIC) into a cell, the CRISPR RNAs (crRNA) expressed from the SIC directs a CRISPR-Cas12a endonuclease to the genomic target locus where the DNA double strand is cleaved. The lesion is repaired by homologous recombination using the SIC as repair template so that an in-frame gene fusion is observed. b Efficiency of seven SICs of C-terminal tagging of highly expressed open-reading frames (ORFs) with a fluorescent protein reporter, in the absence (gray) or presence (purple) of Francisella novicida U112 (FnCas12a). Colony-forming units (CFUs) per microgram of DNA and cells used for transformation, and integration fidelity by colony fluorescence are shown. c Co-integration events upon simultaneous transformation of two SICs directed against either ENO2 or PDC1. Both SICs confer resistance to Geneticin (G-418), but contain different fluorescent protein tags. Colonies exhibiting green and red fluorescence (arrows) were streaked to identify true co-integrands. False-color fluorescence microscopy images show nuclear Pdc1-GFP (green fluorescent protein) in green and the cytosolic Eno2-RFP in magenta; scale bar 5 µm. d Titration of both SICs against each other (lower panel) with evaluation of GFP-tagged (GFP+), red fluorescent protein (RFP)-tagged (RFP+) or co-transformed (GFP+ RFP+) colonies. bd Source data are provided as a Source Data file
Fig. 2
Fig. 2
CRISPR-Cas12a (Cpf1)-assisted tag library engineering (CASTLING) in a nutshell. a For each target locus, a DNA oligonucleotide with site-specific homology arms (HAs) and a CRISPR spacer encoding a target-specific CRISPR RNAs (crRNA) is designed and synthesized as part of an oligonucleotide array. The resulting oligonucleotide pool is recombineered with a custom-tailored feature cassette into a pool of self-integrating cassettes (SICs). This results in a clone collection (library) that can be subjected to phenotypic screening and genotyping, for example, using Anchor-Seq. b The three-step recombineering procedure for SIC pool generation; details are given in the main text and Methods
Fig. 3
Fig. 3
CRISPR-Cas12a (Cpf1)-assisted tag library engineering (CASTLING) for tagging 215 nuclear proteins with a green fluorescent protein. a Three oligonucleotide pools of the same design (1577 sequences, Supplementary Table 1) were used to create four tag libraries by CASTLING in duplicate sampling the indicated amount of starting material for PCR. b Detected oligonucleotide sequences of the design after PCR amplification (blue), self-integrating cassette (SIC) assembly (green), and in the final library (orange); oligonucleotides with copy number estimates (unique molecular identifier (UMI) counts) in the lowest quartile (lower 25%) are shown in light shade. c Same as b, but evaluated in terms of open-reading frames (ORFs) represented by the oligonucleotides or SICs. d Copy number of PCR amplicons recovered (red) or lost (blue) after recombineering; black horizontal lines indicate median UMI counts. e Pearson’s pairwise correlation of oligonucleotide or SIC copy number between replicates after PCR or rolling circle amplification (RCA), respectively; n.s., not significant (p > 0.05). f Kernel density estimates of copy number in replicate 1a as normalized to the median copy number observed in the oligonucleotide pool (before recombineering) and after recombineering into the SIC pool (left panel); the distribution of fold changes (right panel) highlights two frequency ranges: [0.1–0.9], that is, 80% of SICs, and [0.25–0.75], that is, 50% of SICs. g Representative fluorescence microscopy images of cells displaying nuclear, diffuse non-nuclear (asterisks), or no mNeonGreen fluorescence (arrows); scale bar 5 µm. h Quantification of fluorescence localization in >1000 cells in each replicate. i Recurrence of off-target events as revealed by Anchor-Seq across all library replicates and all genomic loci (left panel); the fraction of cells with SICs integrated at off-target sites (blue) within each clone population (red) is shown (right panel, axis trimmed). bi Source data are provided as a Source Data file
Fig. 4
Fig. 4
Identification of factors influencing clone representation in CRISPR-Cas12a (Cpf1)-assisted tag library engineering (CASTLING). a Sequence quality of an oligonucleotide pool (oligonucleotide pool C, Supplementary Table 2) after PCR amplification and self-integrating cassette (SIC) assembly. Following de-noising of next-generation sequencing (NGS) artifacts, molecules that aligned with any of the 12,472 designed oligonucleotides were classified error-free, erroneous, or absent at the respective stage (left panel). The genotype space (designed: 5664 open-reading frames (ORFs)) was covered by each class (right panel). b Representative fluorescence microscopy images of a pooled tag library (derived from oligonucleotide pool C); scale bar: 20 µm (overview), 5 µm (details). c Genotype diversity within three independent library preparations (libraries #1.1, #1.2, and #1.3, Supplementary Table 2) generated from the same oligonucleotide pool; all libraries combined tagged 3262 different ORFs. d Summary of parameters significantly (Fisher’s exact test, p < 0.05) increasing the likeliness of tagging success beyond SIC abundance (details in Supplementary Fig. 7a–b). ac Source data are provided as a Source Data file
Fig. 5
Fig. 5
Creating and screening large CRISPR-Cas12a (Cpf1)-assisted tag library engineering (CASTLING) libraries. a Three libraries with different numbers of collected clones were generated from self-integrating cassette (SIC) pools combining either 2 or 30 recombineering reactions to investigate the minimum effort for a proteome-wide (design: 5940 open-reading frames (ORFs), oligonucleotide pool D, Supplementary Table 2) CASTLING library (details in Methods). b Venn diagram of genotypes recovered in each of the three libraries; all libraries combined tagged 4516 different ORFs. c Genotype diversity in each of the three libraries, shared between them, or after their combination. d Proteome profiling by fluorescence intensity of a non-exhaustive mNeonGreen tag library (library #1.1, Fig. 4c, Supplementary Table 2) using fluorescence-activated cell sorting (FACS). After enriching the fluorescent sub-population of the library and determining the fold enrichment of each genotype by next-generation sequencing (NGS), this sub-population was sorted into eight bins according to fluorescent intensity. Analysis of each bin by Anchor-Seq and on-site nanopore sequencing allowed the assignment of an expected protein abundance for each genotype. e Pairwise comparisons between fluorescence intensity estimates calculated from genotype distribution across all bins (Methods, Eq. 2; this study denoted as BUC) and protein abundances reported by selected genome-scale experiments,, normalized to molecules per cell. Outliers (orange) were determined based on the comparison to a green fluorescent protein (GFP) tag flow cytometry study. Spearman’s correlation coefficients (ρ) are given. Marginal lines indicate abundance estimates only present in the respective study but missing in the other. f Comparison of Spearman’s correlation coefficients between studies either considering their overlap in detected ORFs or only the overlap with the 435 ORFs we could detect in this experiment. A Pearson’s correlation coefficient (r) is given. g Eight genes that had not been characterized in other genome-scale experiments were tagged individually to verify whether fluorescence intensity corresponded with their predicted characterization by FACS. Same exposure time for all fluorescent microscopy images except for Ybr196c-a, which was imaged at 10% excitation; scale bar 10 µm. b, c, e Source data are provided as a Source Data file

Similar articles

Cited by

References

    1. Sopko R, et al. Mapping pathways and phenotypes by systematic gene overexpression. Mol. Cell. 2006;21:319–330. doi: 10.1016/j.molcel.2005.12.011. - DOI - PubMed
    1. Douglas AC, et al. Functional analysis with a barcoder yeast gene overexpression system. G3. 2012;2:1279–1289. doi: 10.1534/g3.112.003400. - DOI - PMC - PubMed
    1. Kuzmin E, et al. Systematic analysis of complex genetic interactions. Science. 2018;360:eaao1729. doi: 10.1126/science.aao1729. - DOI - PMC - PubMed
    1. Ghaemmaghami S, et al. Global analysis of protein expression in yeast. Nature. 2003;425:737–741. doi: 10.1038/nature02046. - DOI - PubMed
    1. Hu C-D, Chinenov Y, Kerppola TK. Visualization of interactions among bZIP and Rel family proteins in living cells using bimolecular fluorescence complementation. Mol. Cell. 2002;9:789–798. doi: 10.1016/S1097-2765(02)00496-3. - DOI - PubMed

Publication types

Substances

LinkOut - more resources