. 2019 Jul 4;9(1):9697.
doi: 10.1038/s41598-019-46113-y.

Discovery of food identity markers by metabolomics and machine learning technology

Affiliations

Discovery of food identity markers by metabolomics and machine learning technology

Alexander Erban et al. Sci Rep. .

Abstract

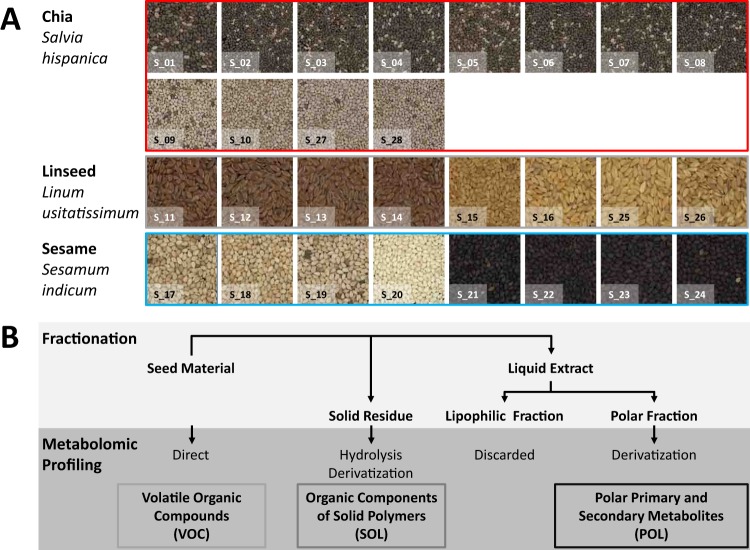
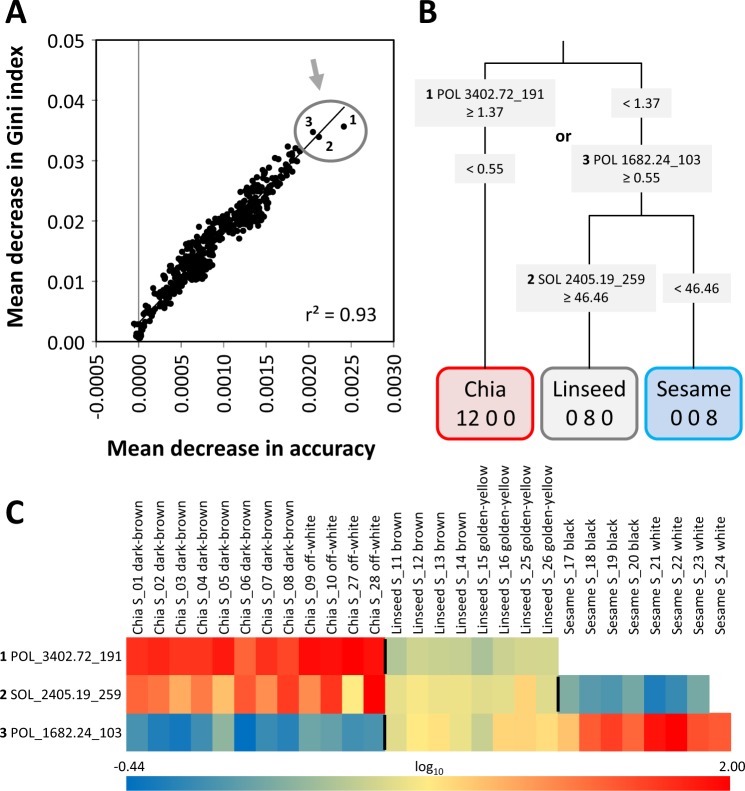
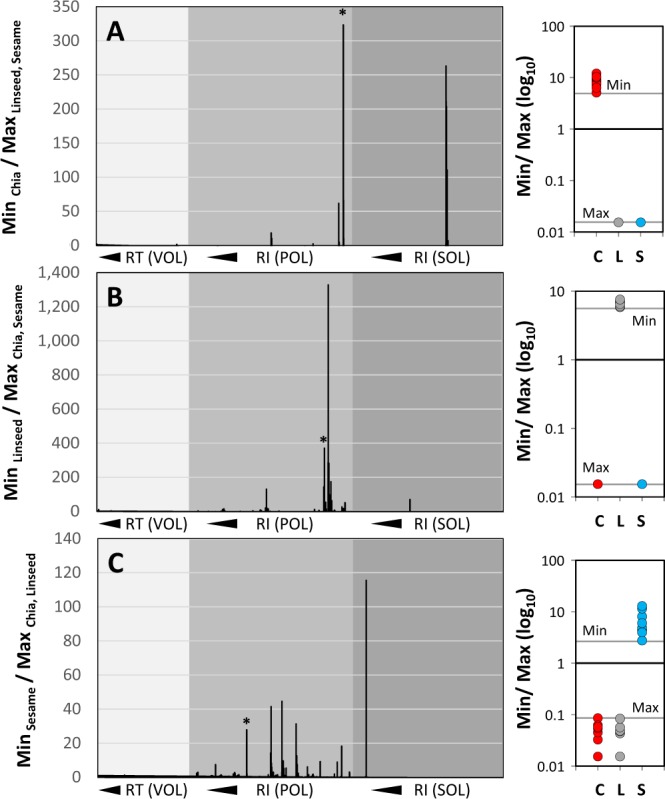
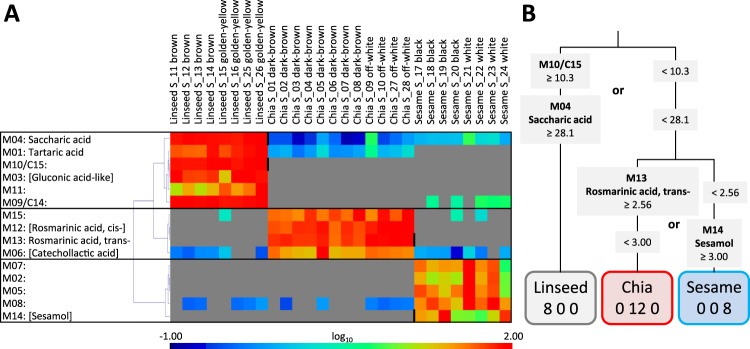
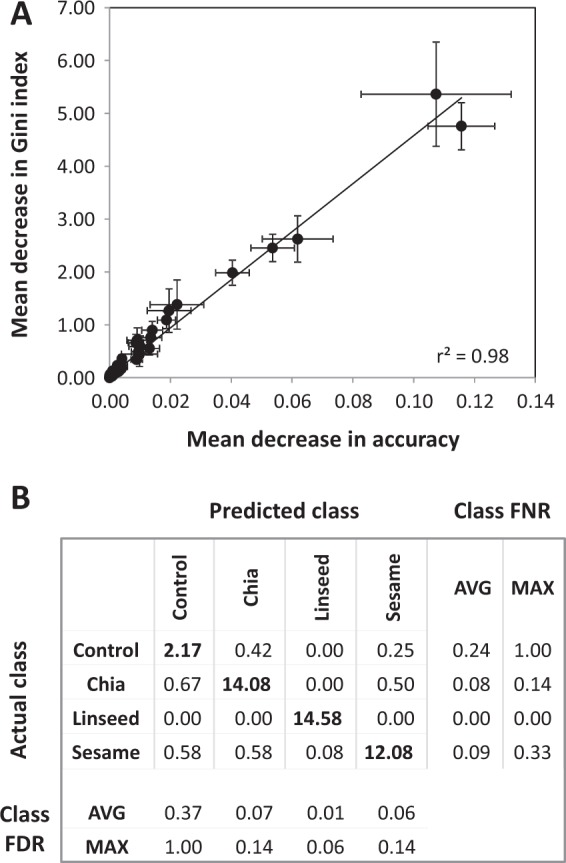
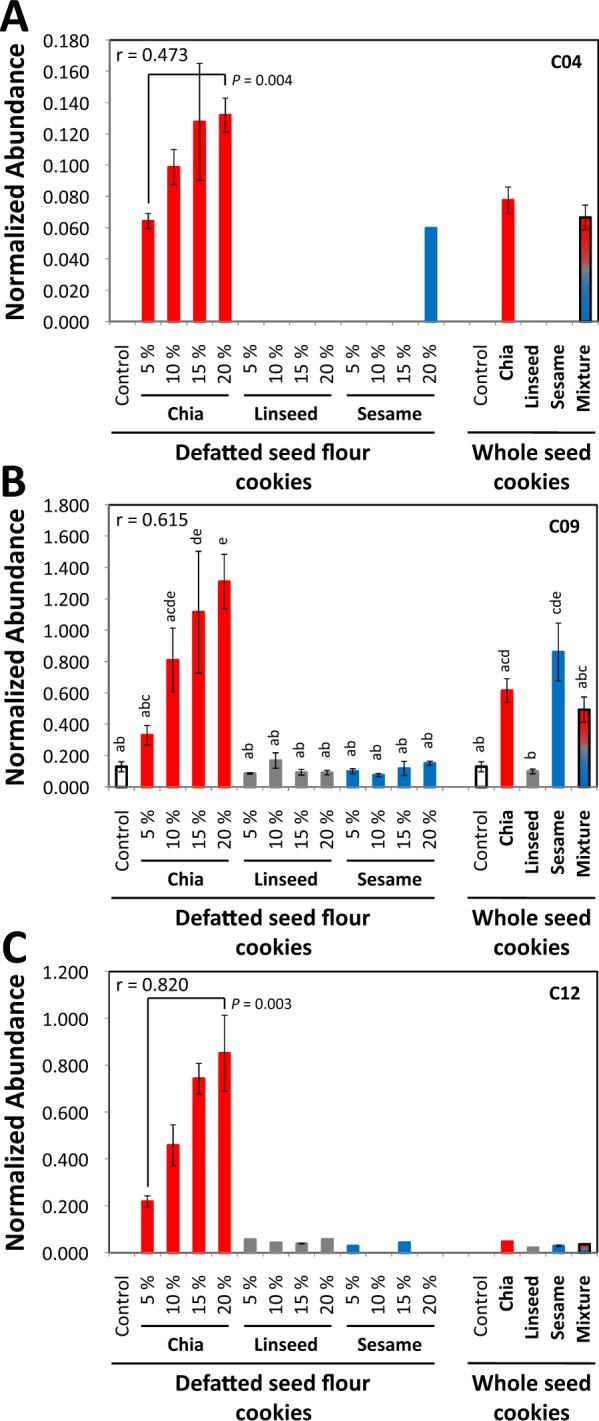
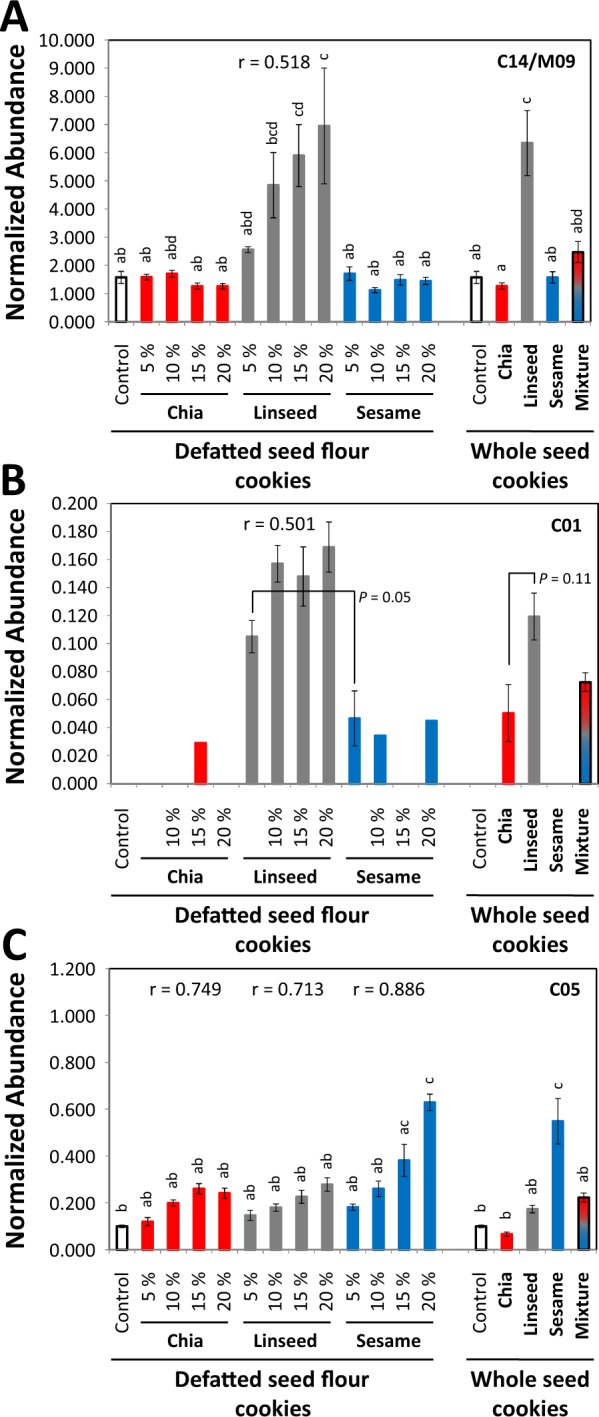
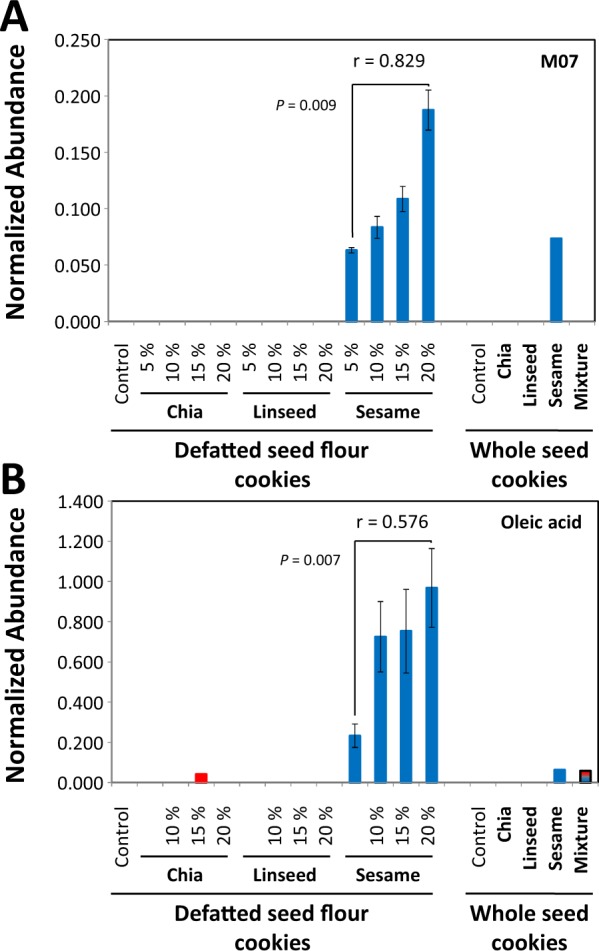
Verification of food authenticity establishes consumer trust in food ingredients and components of processed food. Next to genetic or protein markers, chemicals are unique identifiers of food components. Non-targeted metabolomics is ideally suited to screen food markers when coupled to efficient data analysis. This study explored feasibility of random forest (RF) machine learning, specifically its inherent feature extraction for non-targeted metabolic marker discovery. The distinction of chia, linseed, and sesame that have gained attention as "superfoods" served as test case. Chemical fractions of non-processed seeds and of wheat cookies with seed ingredients were profiled. RF technology classified original seeds unambiguously but appeared overdesigned for material with unique secondary metabolites, like sesamol or rosmarinic acid in the Lamiaceae, chia. Most unique metabolites were diluted or lost during cookie production but RF technology classified the presence of the seed ingredients in cookies with 6.7% overall error and revealed food processing markers, like 4-hydroxybenzaldehyde for chia and succinic acid monomethylester for linseed additions. RF based feature extraction was adequate for difficult classifications but marker selection should not be without human supervision. Combination with alternative data analysis technologies is advised and further testing of a wide range of seeds and food processing methods.


Conflict of interest statement

The authors declare no competing interests.

Figures

Figure 1
Figure 1
Reference samples and chemical profiling scheme for the discovery of differential metabolic markers of chia, linseed and sesame seeds. (A) Reference seed batches (S_01 - S_28) that were marketed for human consumption were collected from local grocery stores (Berlin, Germany) with anonymized vendor information (Table S1). Note that two colour variants of each seed type were included. All seed batches except S_20 contained the seed coat. The colour code, chia (red), linseed (grey) and sesame (blue) is used throughout the study. (B) Chemical fractionation and chemical profiling scheme of reference seed material. Rapid direct profiling of volatile organic compounds (VOC) was performed by headspace solid phase micro-extraction gas chromatography – mass spectrometry (SPME-GC-MS). A solid fraction (SOL) was obtained after exhaustive extraction of soluble metabolites. Solids were hydrolyzed and components analyzed by chemical derivatization and GC-MS. A polar liquid extract (POL) that was enriched for primary and small specialized metabolites was analyzed by chemical derivatization and routine GC-MS profiling. Note that the lipophilic liquid extract was omitted, because seed processing for human consumption frequently involves seed defatting and/or addition of fats from other sources.
Figure 2
Figure 2
Principal component analyses (PCA) of non-targeted metabolite profiles of three chemical fractions from chia (n = 12), linseed (n = 8) and sesame seeds (n = 8). Matrices of averaged mass features across technical replicates (t) from the VOC (t = 6), POL (t = 5) and SOL (t = 2–5) profiles of the 28 seed batches (S_01 - S_28) were submitted to PCA analysis (Table S2). The first two components of each separate PCA, VOC (A), POL (B), SOL (C), and a PCA of the combined data sets (D) are plotted. Log10-transformed mean-centred ratios of each mass feature were calculated prior to PCA. Missing value (NA) replacement was an estimate of the detection limit (Fig. 4) before calculation of log10-transformed ratios.
Figure 3
Figure 3
RF based analysis of seed identity markers from mass features of non-targeted metabolite profiles of three chemical fractions from chia, linseed and sesame seeds. Analysis of variable importance using the mean decrease of Gini index and mean decrease of accuracy measures of random forest (RF) analyses. The three most important variables, i.e. mass features, are indicated by circle and arrow. Ten random forest analyses were performed by repeated random selection of 14 training profiles from 28 seed batches. The mean decrease in Gini index and mean decrease in accuracy measures of mass features were averaged across the random forest analyses. None of the classification models had errors. Linear correlation, r² of a Pearson’s correlation coefficient, of the averaged variable importance measures is inserted. Averaged normalized abundances of the mass features across technical replicates of the VOC, POL and SOL analyses were used (Table S2). Mass features were pre-selected according to 1-way ANOVA (P < 10−5) significance for the distinction of seed types. Redundancy of mass features was reduced by selecting the most significant feature with least missing values among multiple mass features of the same compound. (A) Decision tree representation of two rule sets that distinguish seed material without false classifications. The rules were based on the three most important mass features. Mass features are reported by analysed fraction, chromatographic retention time RT (VOC) or retention index RI (POL, SOL) and nominal mass. The numerical values in the tree are the thresholds of normalized abundances for partitioning of the seed samples. (B) Heat map representation of the normalized abundances of the three most important mass features. The normalized abundances were maximum scaled and log10-transformed for visualization, maximum (red), mean (yellow), minimum (blue), and non-detected (white). Vertical bars within the heat map indicate the partitioning depicted in panel (B).
Figure 4
Figure 4
Minimum over Maximum ratios of mass feature abundance distributions from non-targeted metabolite profiles of three chemical fractions from chia, linseed and sesame seeds. Ratios of minimum (Min) abundances of mass features observed in one seed type over the maximum (Max) abundance in the other seed types are plotted left to right according to retention time (RT) of the VOC analysis (light grey underlay) or according to retention index (RI) of POL (middle grey) and SOL (dark grey) profiles, (A) MinChia/MaxLinseed, Sesame, (B) MinLinseed/MaxChia, Sesame, and (C) MinSesame/MaxChia, Linseed. Inserts to the right illustrate exemplary abundance distributions using the mass features that are indicated by a star (*) to the left. Note that the plotted Min/Max ratios represent a measure of the gap between non-overlapping abundance distributions. Missing values were substituted before ratio-calculations by an estimate of the detection limit.
Figure 5
Figure 5
Min/Max - based selection of seed identity markers among mass features of non-targeted metabolite profiles of three chemical fractions from chia, linseed and sesame seeds. (A) Heat map representation of the normalized abundances of 15 Metabolites, M01-M15, that are markers of seed identity and grouped by seed type. The compounds were selected according to top 15 Min/Max ratios of mass features. Compound annotations by mass spectral match alone are reported in square brackets. Compounds without clear match were given an M identifier, e.g. M10 (also found as C15 in the subsequent analyses), and documented by mass spectrum and retention index (Supplemental Data File S5). The normalized abundances were maximum scaled and log10-transformed after mean centring for heat map visualization, maximum (red), mean (green), minimum (dark blue), and non-detected (gray). Note that this approach yields only “positive” markers of seed identity. Vertical black bars within the heat map indicate the sample partitioning rules of panel (B). Hierarchical clustering was by r² distance metric (Pearson’s correlation) and complete linkage. (B) Decision tree representation of two rule sets that distinguish three classes of seed material without misclassification. The rules were based on four metabolites, M04 (saccharic acid), M10/C15 (non-identified), M13 (trans-rosmarinic acid), and M14 (sesamol). The numerical values are the partitioning thresholds.
Figure 6
Figure 6
RF based selection of seed identity markers from mass features of non-targeted metabolite profiles of experimental bakery products that were prepared with or without additions of chia, linseed, or sesame seeds. (A) Analysis of variable importance by mean decrease of Gini index and mean decrease of accuracy measures (means ± standard deviations) of 12 random forest analyses using 84 pre-selected processing-dependent mass features and eight manually added mass features containing previously identified markers of non-processed seeds. These mass features were selected from 19761 mass features of a non-targeted metabolite profiling analysis of polar extracts from experimental cookies that were prepared with 5, 10, 15, or 20% (w/w) defatted seed flour or 10 or 20% (w/w) whole seeds (Supplemental Table S4). The classification models predicted four classes, cookies without added seeds and cookies with chia, linseeds or sesame seeds irrespective of amount of added seed material or seed pre-processing. The importance of top mass features was ranked according to mean decreases in accuracy (Supplemental Table S4). (B) Characterization of the trained classification models by a confusion matrix, class false negative rates (FNR) and class false discovery rates (FDR). Averages (AVG) and maxima (MAX) of class FNR and FDR were calculated from the individual confusion matrices of 12 classification models that were trained from 46 random samplings of a total set of 93 profiles of cookies without added seeds (n = 5) and cookies with chia (n = 28), linseeds (n = 30) or sesame seeds (n = 30). The overall classification error was 6.70 ± 3.27% (mean ± standard deviation).
Figure 7
Figure 7
Characterization of chia seed identity markers in experimental bakery products. Non-targeted metabolite profiling analyses of polar extracts were generated from experimental cookies that were prepared, left to right, with 5, 10, 15, or 20% (w/w) defatted seed flour of single seed types, 15 ± 5% (w/w) whole seeds of single seed types, or an equal (w/w/w) mixture of whole seeds. Inserts show the Pearson’s correlation coefficients of weight percentage of the seed types and normalized abundance of marker compounds. Normalized abundances are means ± standard error (n = 4–5), bars without whiskers are single observations. (A) Compound C04: 4-hydroxybenzaldehyde. (B) Compound C09: a tri-saccharide with best match to melezitose. (C) Compound C12: a monomethylinositol with best mass spectral match to pinitol. Tukey’s test (lowercase letters) was performed, if applicable. If the compound was not detectable in control samples, exemplary t-tests are included (P).
Figure 8
Figure 8
Characterization of linseed markers and a general seed identity marker in experimental bakery products. Non-targeted metabolite profiling analyses of polar extracts are depicted as described (Fig. 7). (A) Compound C14 also identified as non-processed seed marker M09: a non-identified marker compound. (B) Compound C01: monomethylsuccinate. (C) Compound C05: a pentitol with best mass spectral match to xylitol. Tukey´s test (lowercase letters) was performed, if applicable. If the compound was not detectable in control samples, exemplary t-tests are included (P).
Figure 9
Figure 9
Characterization of a sesame marker and properties of oleic acid in experimental bakery products. Non-targeted metabolite profiling analyses of polar extracts are depicted as described by (Fig. 7). (A) Compound M07 was selected as a sesame marker by analyses of non-processed seeds (Fig. 5). M07 was detectable in experimental cookies. M07 is a non-identified compound. (B) Oleic acid was eliminated as a potential seed marker by manual curation because a ubiquitous fatty acid obviously has no specificity as a sesame marker. Note that non-targeted analyses may yield potential but non-specific markers, such as in this case oleic acid. Without careful curation, such a marker would lead to misclassifications of food material. Exemplary t-tests are included (P).

Similar articles

Cited by

References

    1. Kelly S, Heaton K, Hoogewerff J. Tracing the geographical origin of food: The application of multi-element and multi-isotope analysis. Trends in Food Science and Technology. 2005;16:555–567. doi: 10.1016/j.tifs.2005.08.008. - DOI
    1. Kendall H, et al. Food fraud and the perceived integrity of European food imports into China. PloS One. 2018;13(5):e0195817. doi: 10.1371/journal.pone.0195817. - DOI - PMC - PubMed
    1. Sforza, S. Food authentication using bioorganic molecules. DEStech Publications, Lancaster, PA, USA. ISBN: 978-1-60595-045-7 (2013).
    1. De la Guardia, M. & Gonzalvez, A. Food protected designation of origin: Methodologies and applications. Comprehensive Analytical Chemistry Vol. 60. Elsevier Publications, Oxford, UK. ISBN: 978-0-444-59562-1 (2013).
    1. Ulaszewska MM, et al. Nutrimetabolomics: an integrative action for metabolomic analyses in human nutritional studies. Molecular Nutrition and Food Research. 2018;63:1800384. doi: 10.1002/mnfr.201800384. - DOI - PubMed

Publication types