. 2019 Jul 4;9(1):9696.
doi: 10.1038/s41598-019-46100-3.

Pleiotropic effects of rfa-gene mutations on Escherichia coli envelope properties

Affiliations

Pleiotropic effects of rfa-gene mutations on Escherichia coli envelope properties

Christophe Pagnout et al. Sci Rep. .

Abstract

Mutations in the rfa operon leading to severely truncated lipopolysaccharide (LPS) structures are associated with pleiotropic effects on bacterial cells, which in turn generates a complex phenotype termed deep-rough. Literature reports distinct behavior of these mutants in terms of susceptibility to bacteriophages and to several antibacterial substances. There is so far a critical lack of understanding of such peculiar structure-reactivity relationships mainly due to a paucity of thorough biophysical and biochemical characterizations of the surfaces of these mutants. In the current study, the biophysicochemical features of the envelopes of Escherichia coli deep-rough mutants are identified from the molecular to the single cell and population levels using a suite of complementary techniques, namely microelectrophoresis, Atomic Force Microscopy (AFM) and Isobaric Tag for Relative and Absolute Quantitation (iTRAQ) for quantitative proteomics. Electrokinetic, nanomechanical and proteomic analyses evidence enhanced mutant membrane destabilization/permeability, and differentiated abundances of outer membrane proteins involved in the susceptibility phenotypes of LPS-truncated mutants towards bacteriophages, antimicrobial peptides and hydrophobic antibiotics. In particular, inner-core LPS altered mutants exhibit the most pronounced heterogeneity in the spatial distribution of their Young modulus and stiffness, which is symptomatic of deep damages on cell envelope likely to mediate phage infection process and antibiotic action.


Conflict of interest statement

The authors declare no competing interests.

Figures

Figure 1
Figure 1
Schematic representation of the rfa operons in E. coli BW25113 (Wild Type) (A) and of the expected LPS structures of the strains used in this study (B). Positions of mutated genes in the rfa operon are indicated by (*). The brackets in the scheme of JW3606 indicate the 80% reduction in heptose phosphorylation. This figure is adapted from Yethon et al..
Figure 2
Figure 2
Dependence of the electrophoretic mobility on electrolyte concentration for the WT (black), JW3601 (red), JW3606 (green) and JW3596 (blue) cells. Points: experimental data. Dotted lines: theory (eqs 1–4). In inset, electrokinetic data are represented according to linear axis in electrolyte concentration.
Figure 3
Figure 3
Representative peak force error images of WT, JW3601 (ΔrfaJ), JW3606 (ΔrfaG) and JW3596 (ΔrfaC) cells (A) and RMS cell surface roughness (Rsurface) for the four strains of interest in this work (B). In order to evaluate the statistical dispersion of Rsurface, we use a classical whisker representation for which the bottom and the top of the box are the 25th and the 75th percentiles noted, respectively, 25Q and 75Q. The bold red band in the box corresponds to the median. The ends of the whiskers represent (i) the largest measured cell surface roughness that is less than or equal to the third quartile plus 1.5 times the interquartile range (75Q-25Q), and (ii) the lowest measured cell surface roughness that is larger than or equal to the first quartile minus 1.5 times the interquartile range (75Q-25Q). Data in panel B stem from measurements conducted on 3 to 12 different bacteria (probed cell surface area 500 × 500 nm2) per cell culture and 7 to 11 different cell cultures. Overall, ca. 50 cell images per strain were considered for evaluation of RMS cell surface roughness.
Figure 4
Figure 4
(Top panel). Schematic representation of nanomechanical/indentation force measurements between an AFM tip and the bacterial cell surfaces investigated in this study. (Bottom panel). Illustration of the procedure according to which internal Turgor pressure (or, equivalently, cell spring constant also termed cell stiffness, kcell) and Young modulus (E) of the cell envelope are retrieved from analysis of force (in N)-indentation (in nm) curves. The equation refers to the nanomechanical model adopted, with a non-linear Hertz-Dimitriadis contribution (red) and a linear compliance component (green). ν is the Poisson ratio (=1/2), fcorrection is the factor elaborated by Dimitriadis et al. that corrects the Hertz model for finite sample thickness (here the height of a bacterium, ca. 800 nm), and R (=20 nm) corresponds to the radius of the hemispherical tip apex. Under the conditions examined in this work, the non-linear indentation domain extends over ca. 20 to 70 nm inside the peripheral cell envelope.
Figure 5
Figure 5
(A) Illustrative Young modulus (E in kPa) distribution over a 500 × 500 nm2 (256 × 256 force curves) scanned cell surface area (left column) of WT, JW3601, JW3606 and JW3596 cells (indicated) and corresponding spatial frequency distributions of E (right column). (B) As in panel A for the cell spring constant (kcell in Nm−1). Young moduli and cell spring constants were evaluated from theoretical fitting of the force vs. indentation curves collected at various locations of the cell surface, as illustrated in Fig. 4.
Figure 6
Figure 6
Dependence of the Young modulus (A) and cell spring constant (B) on the cell strain considered. The meaning of the box plot is identical to that detailed in Fig. 3B for the RMS cell surface roughness. Data stem from measurements conducted on 2 to 3 different bacteria per cell culture and 5 to 6 different cell cultures. Overall, ca. 15 cell images per strain were considered for evaluation of E and kcell.
Figure 7
Figure 7
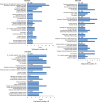
GO term (Cellular Component) enrichment analysis for proteins isolated from E. coli strains (WT and knock-out mutants). E.S. means ‘Enrichment Score’.
Figure 8
Figure 8
Heat map view generated from the 645 proteins identified from the iTRAQ analysis showing their relative abundance in rfa mutants compared to the WT reference strain. The increased and decreased abundance in proteins are indicated by the range of green and red color intensities, respectively. Only proteins deregulated in at least one of the three mutants are listed. The Venn diagram indicates the number of differentially abundant proteins shared by the three mutants.
Figure 9
Figure 9
GO term (Biological Process) enrichment analysis for differentially abundant proteins identified by iTRAQ analysis. E.S.: Enrichment Score of different clusters.

Similar articles

Cited by

References

    1. Schnaitman CA, Klena JD. Genetics of lipopolysaccharide biosynthesis in enteric bacteria. Microbiol Rev. 1993;57:655–682. - PMC - PubMed
    1. Wang X, Quinn PJ. Lipopolysaccharide: biosynthetic pathway and structure modification. Prog Lipid Res. 2010;49:97–107. doi: 10.1016/j.plipres.2009.06.002. - DOI - PubMed
    1. Wang Z, Wang J, Ren G, Li Y, Wang X. Influence of core oligosaccharide of lipopolysaccharide to outer membrane behavior of Escherichia coli. Mar Drugs. 2015;13:3325–3339. doi: 10.3390/md13063325. - DOI - PMC - PubMed
    1. Nikaido H, Vaara M. Molecular basis of bacterial outer membrane permeability. Microbiol. Rev. 1985;49:1–32. - PMC - PubMed
    1. Yethon JA, Vinogradov E, Perry MB, Whitfield C. Mutation of the lipopolysaccharide core glycosyltransferase encoded by waaG destabilizes the outer membrane of Escherichia coli by interfering with core phosphorylation. J Bacteriol. 2000;182:5620–5623. doi: 10.1128/JB.182.19.5620-5623.2000. - DOI - PMC - PubMed

Publication types

MeSH terms