. 2019 Jul 4;9(1):9679.
doi: 10.1038/s41598-019-46115-w.

Photodynamic therapy of melanoma by blue-light photoactivation of flavin mononucleotide

Affiliations

Photodynamic therapy of melanoma by blue-light photoactivation of flavin mononucleotide

R A Akasov et al. Sci Rep. .

Abstract

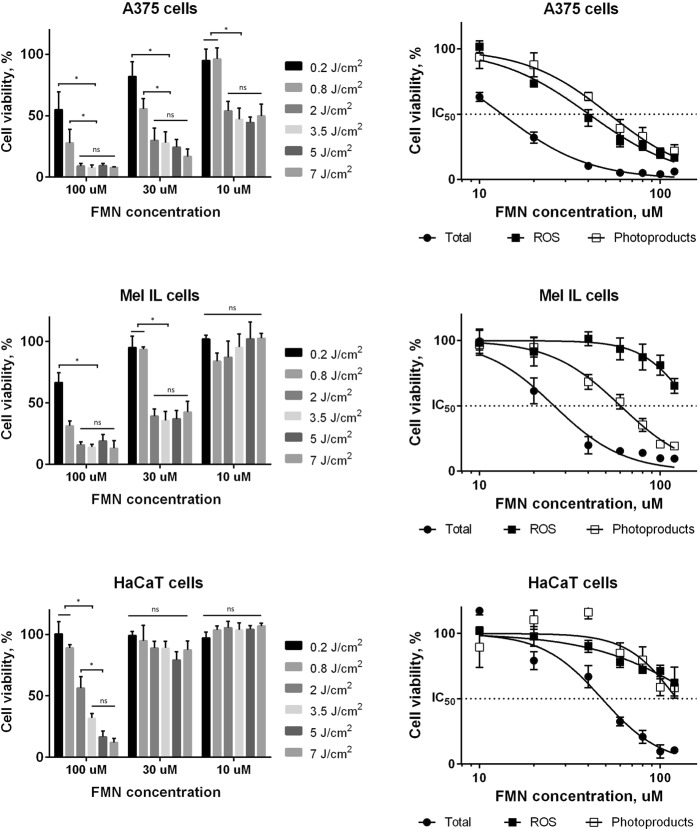
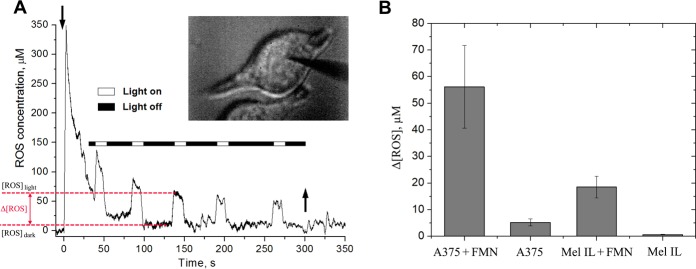
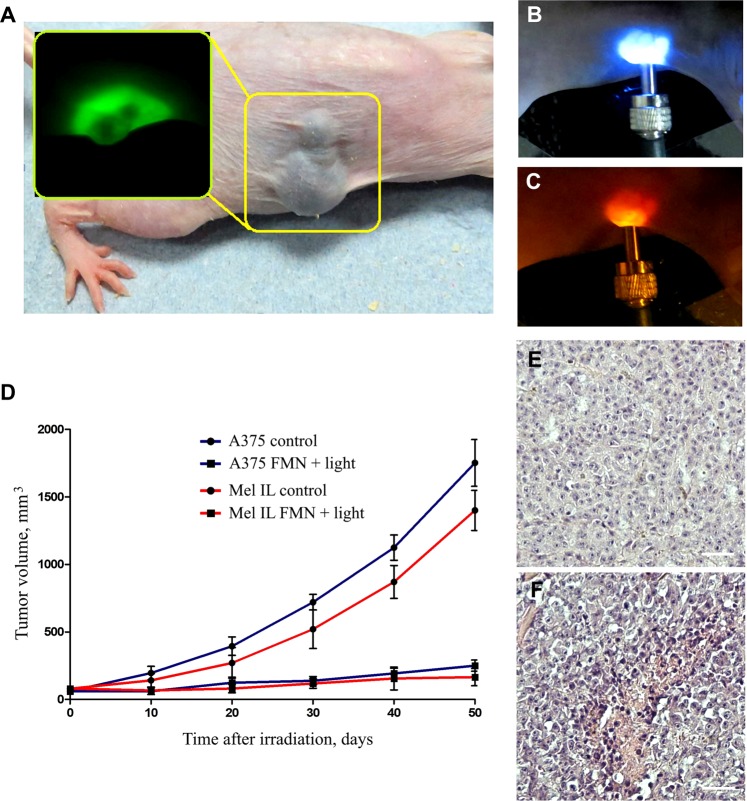
Melanoma is one of the most aggressive and lethal form of cancer. Photodynamic therapy (PDT) is a clinically approved technique for cancer treatment, including non-melanoma skin cancer. However, the most of conventional photosensitizers are of low efficacy against melanoma due to the possible dark toxicity at high drug concentrations, melanin pigmentation, and induction of anti-oxidant defense mechanisms. In the current research we propose non-toxic flavin mononucleotide (FMN), which is a water-soluble form of riboflavin (vitamin B2) as a promising agent for photodynamic therapy of melanoma. We demonstrated selective accumulation of FMN in melanoma cells in vivo and in vitro in comparison with keratinocytes and fibroblasts. Blue light irradiation with dose 5 J/cm2 of melanoma cells pre-incubated with FMN led to cell death through apoptosis. Thus, the IC50 values of human melanoma A375, Mel IL, and Mel Z cells were in a range of FMN concentration 10-30 µM that can be achieved in tumor tissue under systemic administration. The efficiency of reactive oxygen species (ROS) generation under FMN blue light irradiation was measured in single melanoma cells by a label-free technique using an electrochemical nanoprobe in a real-time control manner. Melanoma xenograft regression in mice was observed as a result of intravenous injection of FMN followed by blue-light irradiation of tumor site. The inhibition of tumor growth was 85-90% within 50 days after PDT treatment.


Conflict of interest statement

The authors declare no competing interests.

Figures

Figure 1
Figure 1
The formula (A) and the excitation and emission spectra of FMN in PBS (pH 7.4) (B); photoluminescence of FMN under 450 nm excitation are shown in insert. The accumulation of FMN in tumor and normal cells: flow cytometry data (C) and confocal microscopy (D). Flow cytometry measurements were performed at least in three independent experiments, and the data were expressed as mean ± SD. For confocal imaging, cells were incubated with 100 µM FMN solution for 30 min. Cell nucleuses are in blue (Hoechst 33258), FMN is in green. White arrows show the FMN accumulation on the cell membrane. Scale bar is 50 µm.
Figure 2
Figure 2
Viability of Mel IL, A375, and HaCaT cells after FMN photoactivation in exposure-dependent (left column) and FMN concentration-dependent at 5 J/cm2 (right column) manners, 48 h incubation after irradiation with 450 nm. ROS and FMN photoproducts toxicities were measured both separately (black and blank squares, respectively) and in total (black circles). Cells without any treatment were used as controls and taken as 100%. MTT assay, the data are the mean ± SD from at least three replicates. Statistical analysis was performed using non-parametric Mann-Whitney test, *p < 0.05.
Figure 3
Figure 3
Electrochemical probe of ROS in melanoma cells: the measurement of ROS generated within A375 melanoma cells after pre-incubation with 100 µM FMN (A). Dark scale is for light off, white scale is for light on. The moments of electrode insertion into the cell and withdrawal from the cell are depicted with downward and upward arrows, respectively; the image of nanoelectrode inserted into the cell is in the upper right corner. The changes in ROS level under light irradiation were calculated according to the following formula: Δ[ROS] = [ROS]light − [ROS]dark. The comparison of Δ[ROS] measured inside blue-light irradiated A375 and Mel IL melanoma cells, both FMN pre-incubated and control ones (B). Data are the mean ± SE, N = 5 for FMN-incubated cells and N = 3 for control cells.
Figure 4
Figure 4
Photodynamic therapy of melanoma in vivo. The photo of mouse with high pigmented Mel IL melanoma xenograft (A), fluorescent image of the xenograft demonstrating FMN photoluminescence is in insert. The irradiation of low pigmented A375 xenograft site by blue-light (450 nm) coupled to the optical fiber (B). The photo of the same site taken through the red optical filter demonstrates FMN accumulation and photoactivation (red luminescence, 620–670 nm) in A375 xenograft (C). Tumor growth curves for Mel IL (red color) and A375 (blue color) xenografts during 50 days after PDT treatment (D), blank circles are for control group, black circles are for experimental group). Histology image analysis of Mel IL xenografts after PDT: control (E) and experimental (F) groups. Scale bar is 100 µm.

References

    1. Soengas MS, Lowe SW. Apoptosis and melanoma chemoresistance. Oncogene. 2003;22:3138–3151. doi: 10.1038/sj.onc.1206454. - DOI - PubMed
    1. Kuphal S, Bosserhoff A. Recent progress in understanding the pathology of malignant melanoma. J. Pathol. 2009;219:400–409. doi: 10.1002/path.2617. - DOI - PubMed
    1. Shain AH, Bastian BC. From melanocytes to melanomas. Nat. Rev. Cancer. 2016;16:345–358. doi: 10.1038/nrc.2016.37. - DOI - PubMed
    1. Jhappan C, Noonan FP, Merlino G. Ultraviolet radiation and cutaneous malignant melanoma. Oncogene. 2003;22:3099–3112. doi: 10.1038/sj.onc.1206450. - DOI - PubMed
    1. Bastian BC. The Molecular Pathology of Melanoma: An Integrated Taxonomy of Melanocytic Neoplasia. Annu. Rev. Pathol. Mech. Dis. 2014;9:239–271. doi: 10.1146/annurev-pathol-012513-104658. - DOI - PMC - PubMed

Publication types

Substances