. 2019 Sep;29(9):725-738.
doi: 10.1038/s41422-019-0195-y. Epub 2019 Jul 4.

Single-cell RNA-seq highlights intra-tumoral heterogeneity and malignant progression in pancreatic ductal adenocarcinoma

Affiliations

Single-cell RNA-seq highlights intra-tumoral heterogeneity and malignant progression in pancreatic ductal adenocarcinoma

Junya Peng et al. Cell Res. 2019 Sep.

Erratum in

Abstract

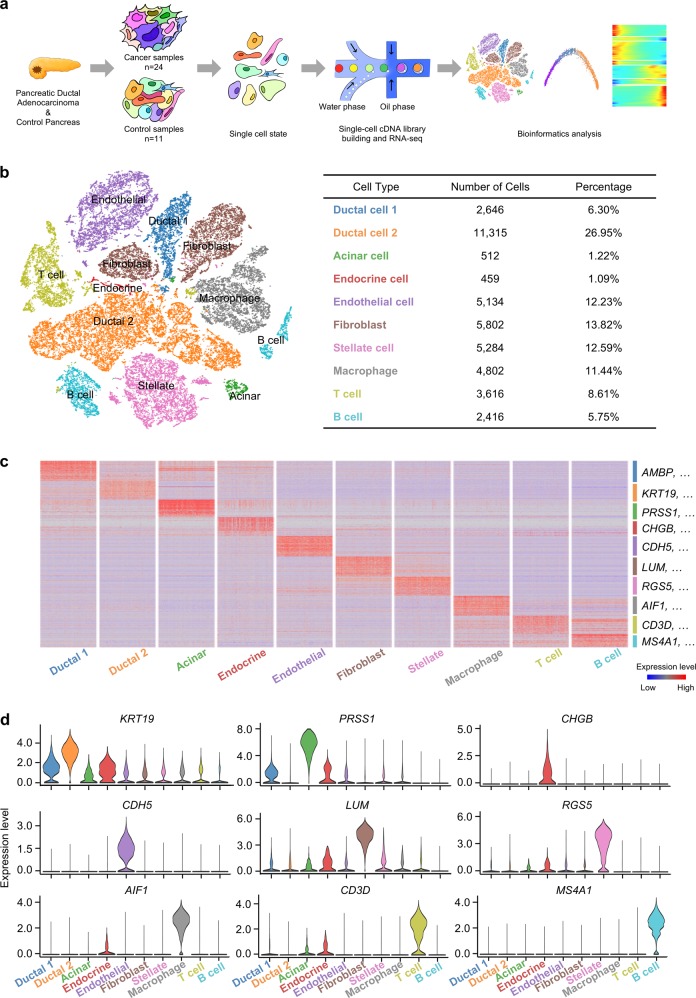
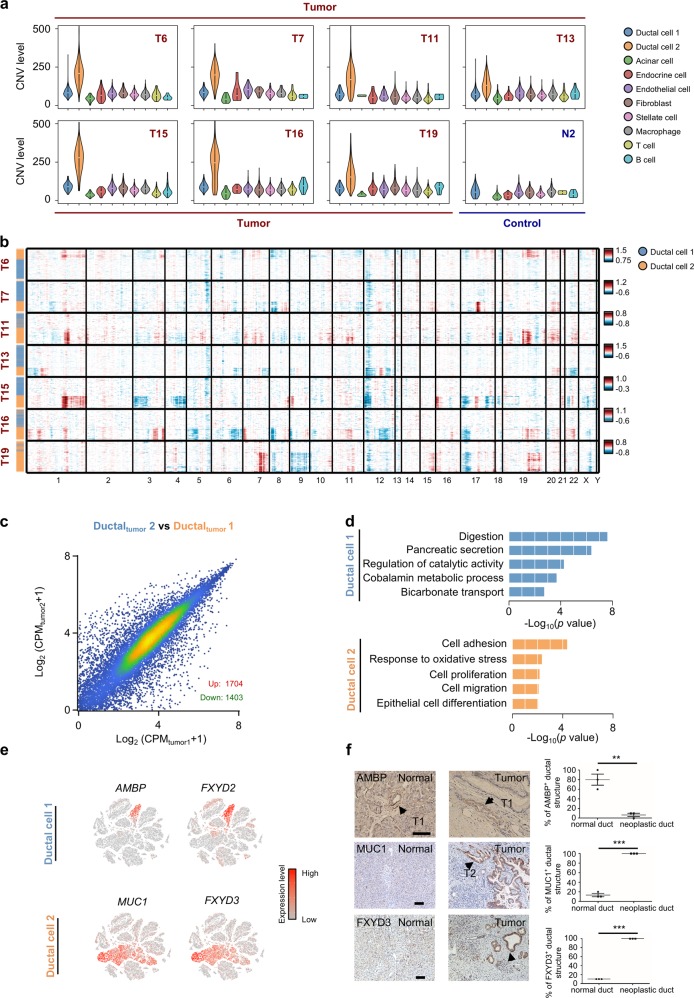
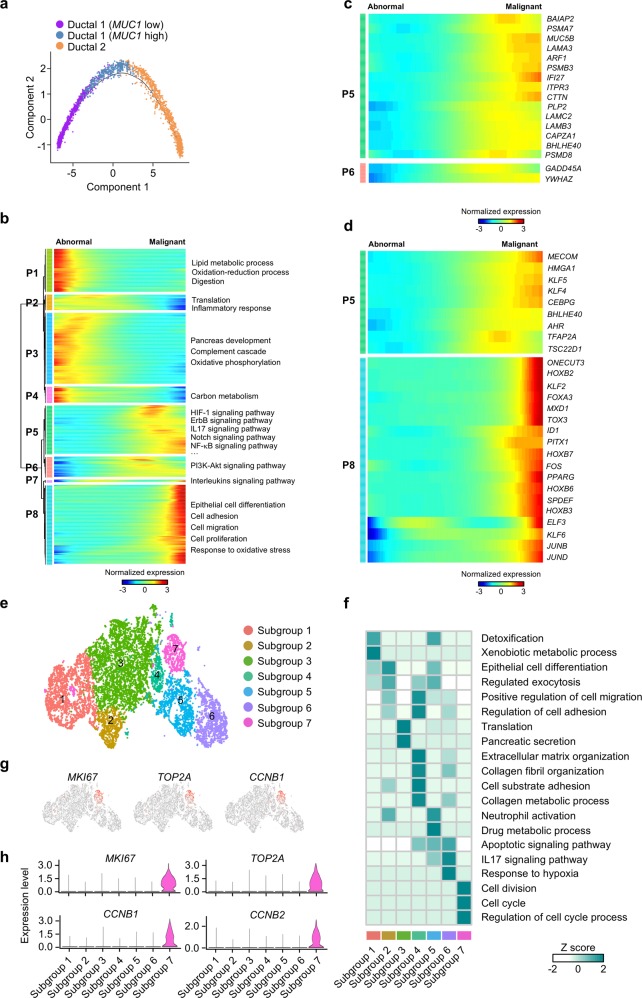
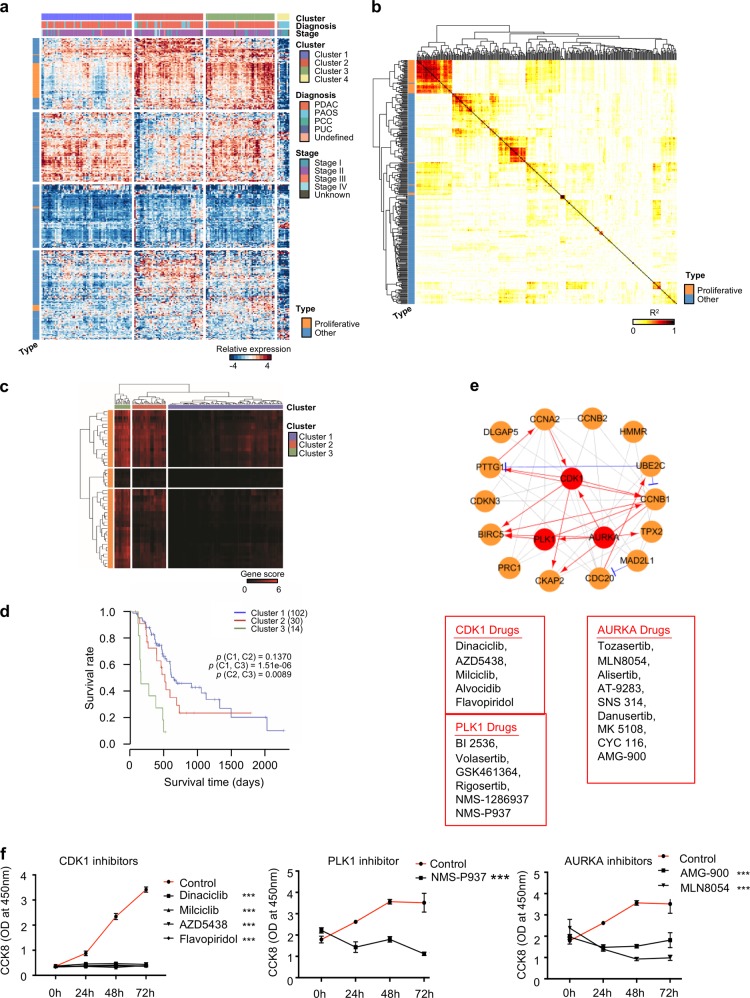
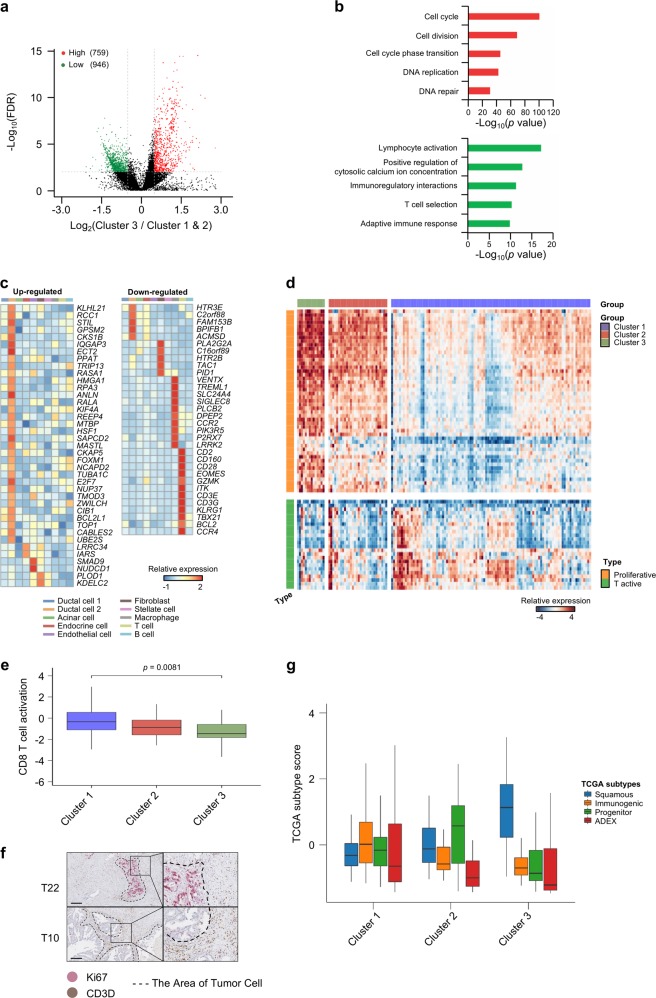
Pancreatic ductal adenocarcinoma (PDAC) is the most common type of pancreatic cancer featured with high intra-tumoral heterogeneity and poor prognosis. To comprehensively delineate the PDAC intra-tumoral heterogeneity and the underlying mechanism for PDAC progression, we employed single-cell RNA-seq (scRNA-seq) to acquire the transcriptomic atlas of 57,530 individual pancreatic cells from primary PDAC tumors and control pancreases, and identified diverse malignant and stromal cell types, including two ductal subtypes with abnormal and malignant gene expression profiles respectively, in PDAC. We found that the heterogenous malignant subtype was composed of several subpopulations with differential proliferative and migratory potentials. Cell trajectory analysis revealed that components of multiple tumor-related pathways and transcription factors (TFs) were differentially expressed along PDAC progression. Furthermore, we found a subset of ductal cells with unique proliferative features were associated with an inactivation state in tumor-infiltrating T cells, providing novel markers for the prediction of antitumor immune response. Together, our findings provide a valuable resource for deciphering the intra-tumoral heterogeneity in PDAC and uncover a connection between tumor intrinsic transcriptional state and T cell activation, suggesting potential biomarkers for anticancer treatment such as targeted therapy and immunotherapy.


Conflict of interest statement

The authors declare no competing interests.

Figures

Fig. 1
Fig. 1
Diverse cell types in PDAC delineated by single cell transcriptomic analysis. a Workflow depicting collection and processing of specimens of PDAC tumors and control pancreases for scRNA-seq. b The t-distributed stochastic neighbor embedding (t-SNE) plot demonstrates main cell types in PDAC. Cell number and percentage of assigned cell types are summarized in the right panel. c Heatmap showing expression levels of specific markers in each cell type. d Violin plots displaying the expression of representative well-known markers across the cell types identified in PDAC. The y axis shows the normalized read count
Fig. 2
Fig. 2
CNV and transcriptome landscape of ductal cells in PDAC and control pancreases. a Violin plots showing distributions of CNV scores among different cell types from 7 representative PDAC and 1 control samples. b Heatmap showing large-scale CNVs of type 1 (blue) and type 2 (orange) ductal cells from 7 representative PDAC samples. The normalized CNV levels were shown, the red color represents high CNV level and blue represents low CNV level. c Scatter plots showing gene expression level of type 1 and type 2 ductal cells in PDACs. CPM (Counts per million) values were used to represent the normalized read count for each gene. d The enriched gene ontology terms for genes with specific expression in type 1 and 2 ductal cells. e Expression levels of representative markers for type 1 and 2 ductal cells are plotted onto the t-SNE map. Color key from gray to red indicates relative expression levels from low to high. The “expression level” was normalized by logNormalize method in Seurat. f IHC images of representative control pancreas and PDAC neoplastic tissues stained for type 1 (AMBP) and type 2 ductal cell (MUC1, FXYD3) markers. Scale bar, 100 μm. Ductal structures of fields were assessed and quantified for the presence of AMBP-, MUC1-, FXYD3-positive cells. “Normal duct” indicates ductal structures with normal nuclei, while “neoplastic duct” indicates ductal cells with enlarged nuclei. The P value was calculated using Student’s t-test. Error bars indicate the standard deviation. Three independent experiments were performed. ***P< 0.001, **P< 0.05
Fig. 3
Fig. 3
Differential gene expression profiles along malignant progression. a Pseudo-time of ductal cells with abnormal gene expression profiles and malignant ductal cells inferred by Monocle2. Each point corresponds to a single cell. Clusters information was shown. b The differentially expressed genes (rows) along the pseudo-time (columns) is clustered hierarchically into eight profiles. The representative gene functions and pathways of each profile were shown. c Heatmap showing expression of representative identified genes potentially associated with PDAC across single cells. Color key from blue to red indicates relative expression levels from low to high. d Heatmap showing expression of representative identified TFs across single cells. Color key from blue to red indicates relative expression levels from low to high. e t-SNE representation of 7 subgroups generated from sub-clustering malignant ductal cells. f Heatmap showing the representative gene ontology and pathway terms enriched in each subgroup. Color key from white to blue indicates z-score of -Log10(P value). g Expression levels of representative proliferation marker genes in each subgroup are plotted onto the t-SNE map. Color key from gray to red indicates relative expression levels from low to high. h Violin plots showing the expression level of representative proliferation marker genes across the subgroups. The y axis shows the normalized read count
Fig. 4
Fig. 4
TCGA PAAD data analyses based on malignant ductal markers detected in the scRNA-seq data. a Heatmap showing the expression patterns of representative malignant ductal markers across the 178 PAAD samples (146 PDAC samples; 4 PCC samples: Pancreas-Colloid Carcinoma; 1 PUC sample: Pancreas Undifferentiated Carcinoma; 26 PAOS samples: Pancreatic Adenorcarconoma Other Subtype; 1 sample was the undefined subtype). Clustering identifies 4 coherent expression patterns across TCGA samples. Rows in the heatmap correspond malignant ductal markers and columns in the heatmap that correspond to TCGA samples. The clinical information including the diagnosis type and stage was also shown. b Heatmap depicting pairwise correlations (R2) on the expression level of the type 2 ductal markers in TCGA PAAD samples. Most proliferative ductal markers were correlated with each other. Correlation coefficients are colored yellow to red to indicate low to high, respectively. c Heatmap showing the clustering result for the value of NNMF based on the proliferative ductal markers. PDAC samples were assigned into three groups according to the value of NNMF. The value of NNMF are colored black to red to indicate low to high, respectively. d Kaplan–Meier survival analysis of tumor samples grouped in c. The sample numbers for each group were shown in brackets. Statistical significance was determined using log-rank test. e A simplified scheme showing the functional interaction network of the representative proliferation marker genes and available drugs for the hub genes of CDK1, PLK1 and AURKA. The interactions were generated using Ingenuity Pathway Analysis (IPA, Ingenuity Systems). The gray, red and blue lines indicate protein-protein interactions, activated or inhibited regulation, respectively. Circle with red colors indicates genes with available drugs. f MIA PaCa-2 cells were treated with CDK1 inhibitors Dinaciclib (10 nM), Milciclib (10 μM), AZD5438 (5 μM), Flavopiridol (500 nM); NMS-P937 (10 μM); AMG-900 (1 μM), MLN-8054 (1 μM) for indicated time. OD at 450 nm were recorded. Three independent experiments were performed. The P value was calculated using Student’s t-test. Error bars indicate the standard deviation. ***P< 0.001
Fig. 5
Fig. 5
Tumor T cell activation states in PDAC patients. a Differential expressed genes detected between group 3 and group 1–2 as in Fig. 4d. The x axis indicates log2FC of gene expression in group 3 compared to group 1 & 2. b Representative enriched GO terms in up- and down-regulated genes (|log2FC| ≥ 0.5 and FDR ≤ 0.01), respectively. c Heatmap showing the expression levels of representative up- and down- regulated genes in each cell type of the PDAC scRNA-seq data. d Heatmap showing the expression of markers for proliferative ductal cell and T cell activation. Patients were grouped as in Fig. 4c. e Boxplot showing distribution of T cell activation score in three PDAC groups as in Fig. 4c. The P value was calculated using Wilcoxon rank sum and signed rank test. f IHC images of PDAC neoplastic tissues stained for proliferative subgroup cell marker (Ki67) and T cell marker (CD3D). Representative Ki67-high (T22) and Ki67-low (T10) specimens were shown. Dashed line showed region of tumor cells. Scale bars, 200 μm. g Boxplot showing the signature scores of 4 known PDAC subtypes (squamous, immunogenic, progenitor and ADEX) in three PDAC groups as in Fig. 4c

References

    1. Rahib L, et al. Projecting cancer incidence and deaths to 2030: the unexpected burden of thyroid, liver, and pancreas cancers in the United States. Cancer Res. 2014;74:2913–2921. - PubMed
    1. Siegel RL, Miller KD, Jemal A. Cancer statistics, 2018. CA Cancer J. Clin. 2018;68:7–30. - PubMed
    1. Winter JM, et al. Survival after resection of pancreatic adenocarcinoma: results from a single institution over three decades. Ann. Surg. Oncol. 2012;19:169–175. - PubMed
    1. Makohon-Moore A, Iacobuzio-Donahue CA. Pancreatic cancer biology and genetics from an evolutionary perspective. Nat. Rev. Cancer. 2016;16:553–565. - PMC - PubMed
    1. Castellanos E, Berlin J, Cardin DB. Current treatment options for pancreatic carcinoma. Curr. Oncol. Rep. 2011;13:195–205. - PubMed

MeSH terms

Substances