

Divergent trends in life expectancy across the rural-urban gradient and association with specific racial proportions in the contiguous USA 2000-2005
- PMID: 31273406
- PMCID: PMC8026113
- DOI: 10.1007/s00038-019-01274-5
Divergent trends in life expectancy across the rural-urban gradient and association with specific racial proportions in the contiguous USA 2000-2005
Abstract
Objectives: To estimate county-level adult life expectancy for Whites, Black/African Americans (Black), American Indian/Alaska Native (AIAN) and Asian/Pacific Islander (Asian) populations and assess the difference across racial groups in the relationship among life expectancy, rurality and specific race proportion.
Methods: We used individual-level death data to estimate county-level life expectancy at age 25 (e25) for Whites, Black, AIAN and Asian in the contiguous USA for 2000-2005. Race-sex-stratified models were used to examine the associations among e25, rurality and specific race proportion, adjusted for socioeconomic variables.
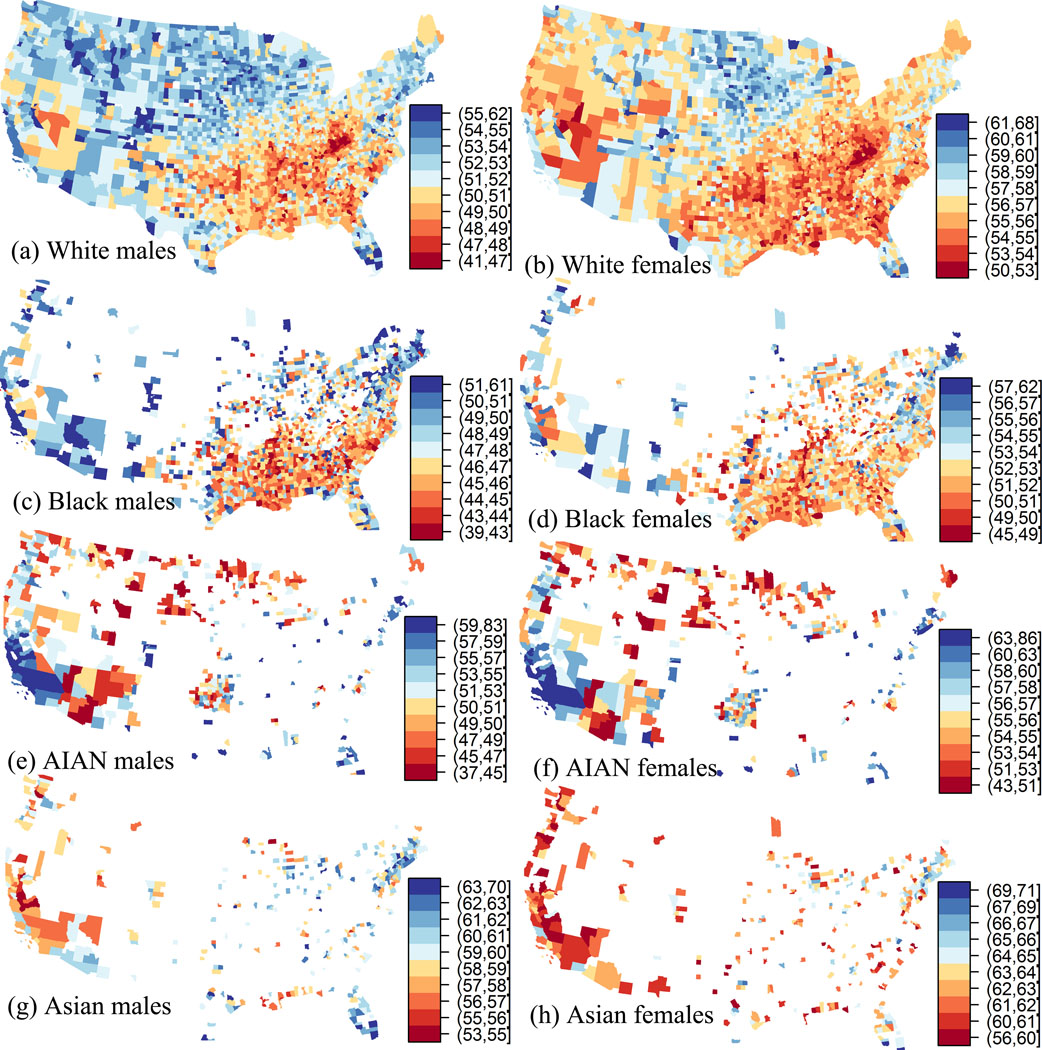
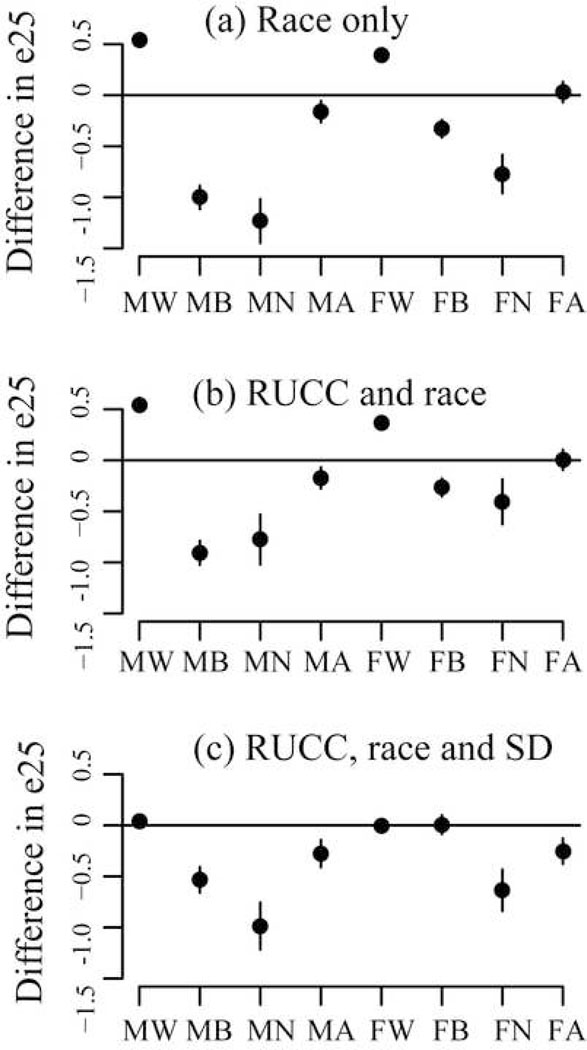
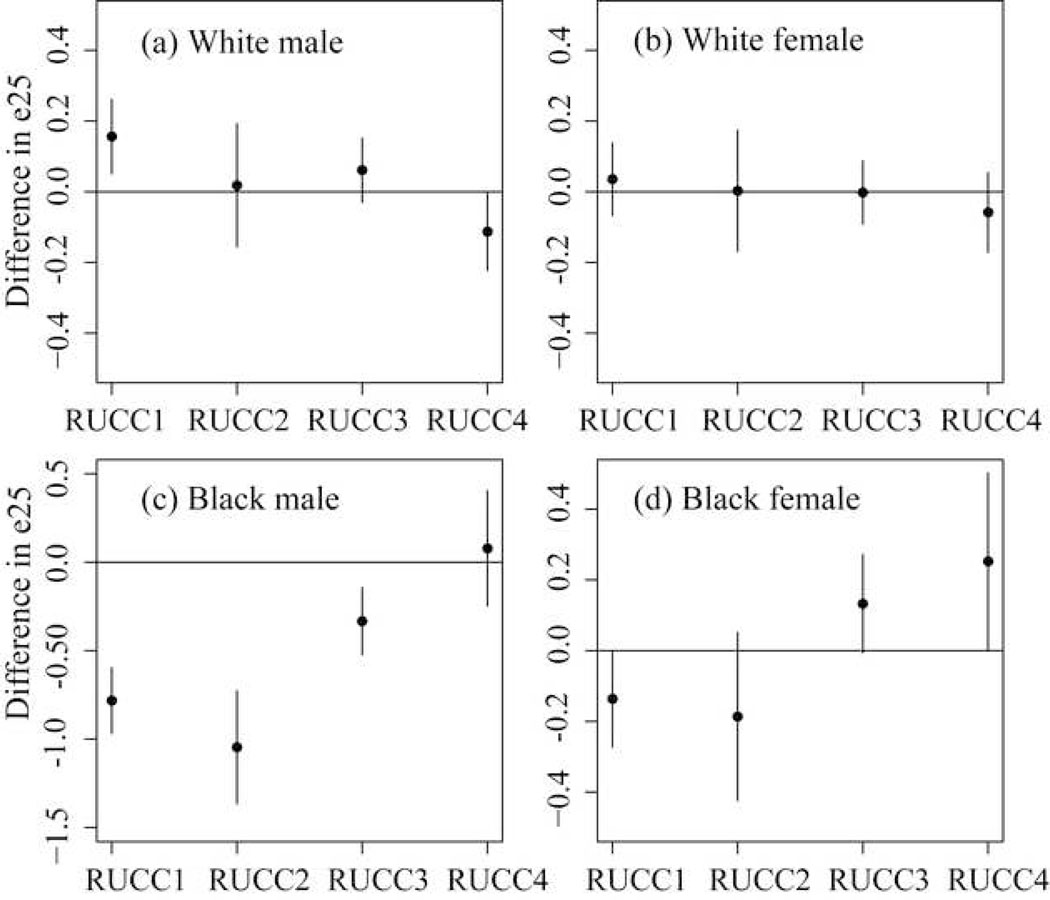
Results: Lower e25 was found in the central USA for AIANs and in the west coast for Asians. We found higher e25 in the most rural areas for Whites but in the most urban areas for AIAN and Asians. The associations between specific race proportion and e25 were positive or null for Whites but were negative for Blacks, AIAN, and Asians. The relationship between specific race proportion and e25 varied across rurality.
Conclusions: Identifying differences in adult life expectancy, both across and within racial groups, provides new insights into the geographic determinants of life expectancy disparities.
Keywords: American Indian/Alaska Native population; Asian/Pacific Islander population; Contiguous USA; Life expectancy at age 25; Rurality; Specific race proportion.
Conflict of interest statement
Conflict of Interest:
The authors declare that they have no conflict of interest.
Figures
Similar articles
-
National racial/ethnic and geographic disparities in experiences with health care among adult Medicaid beneficiaries.Health Serv Res. 2019 Feb;54 Suppl 1(Suppl 1):287-296. doi: 10.1111/1475-6773.13106. Epub 2019 Jan 9. Health Serv Res. 2019. PMID: 30628052 Free PMC article.
-
Life expectancy by county, race, and ethnicity in the USA, 2000-19: a systematic analysis of health disparities.Lancet. 2022 Jul 2;400(10345):25-38. doi: 10.1016/S0140-6736(22)00876-5. Epub 2022 Jun 16. Lancet. 2022. PMID: 35717994 Free PMC article.
-
Ten Americas: a systematic analysis of life expectancy disparities in the USA.Lancet. 2024 Dec 7;404(10469):2299-2313. doi: 10.1016/S0140-6736(24)01495-8. Epub 2024 Nov 21. Lancet. 2024. PMID: 39581204 Free PMC article.
-
Race and Ethnicity Representation in Phase 2/3 Oncology Clinical Trial Publications: A Systematic Review.JAMA Health Forum. 2024 Jun 7;5(6):e241388. doi: 10.1001/jamahealthforum.2024.1388. JAMA Health Forum. 2024. PMID: 38848090 Free PMC article.
-
Assessment of the Inclusion of Racial/Ethnic Minority, Female, and Older Individuals in Vaccine Clinical Trials.JAMA Netw Open. 2021 Feb 1;4(2):e2037640. doi: 10.1001/jamanetworkopen.2020.37640. JAMA Netw Open. 2021. PMID: 33606033 Free PMC article. Review.
Cited by
-
Exploring urban-rural inequities in older adults life expectancy: a case study in Zhejiang, China for health equity.Front Public Health. 2025 Feb 3;13:1439857. doi: 10.3389/fpubh.2025.1439857. eCollection 2025. Front Public Health. 2025. PMID: 39963486 Free PMC article.
-
The Ecology of Economic Distress and Life Expectancy.Int J Public Health. 2024 Jul 26;69:1607295. doi: 10.3389/ijph.2024.1607295. eCollection 2024. Int J Public Health. 2024. PMID: 39132383 Free PMC article.
-
Psychological and social support associations with mortality and cardiovascular disease in middle-aged American Indians: the Strong Heart Study.Soc Psychiatry Psychiatr Epidemiol. 2022 Jul;57(7):1421-1433. doi: 10.1007/s00127-022-02237-7. Epub 2022 Feb 14. Soc Psychiatry Psychiatr Epidemiol. 2022. PMID: 35157091 Free PMC article.
References
-
- Casper ML, Barnett E, Williams GI Jr., Halverson, Braham, KJ G. 2003. Atlas of Stroke Mortality: Racial, Ethnic, and Geographic Disparities in the United States. . Atlanta, GA:Department of Health and Human Services, Centers for Disease Control and Prevention.
MeSH terms
Grants and funding
LinkOut - more resources
Full Text Sources
