

Diagnostic performance of regional cerebral blood flow images derived from dynamic PIB scans in Alzheimer's disease
- PMID: 31273465
- PMCID: PMC6609664
- DOI: 10.1186/s13550-019-0528-3
Diagnostic performance of regional cerebral blood flow images derived from dynamic PIB scans in Alzheimer's disease
Abstract
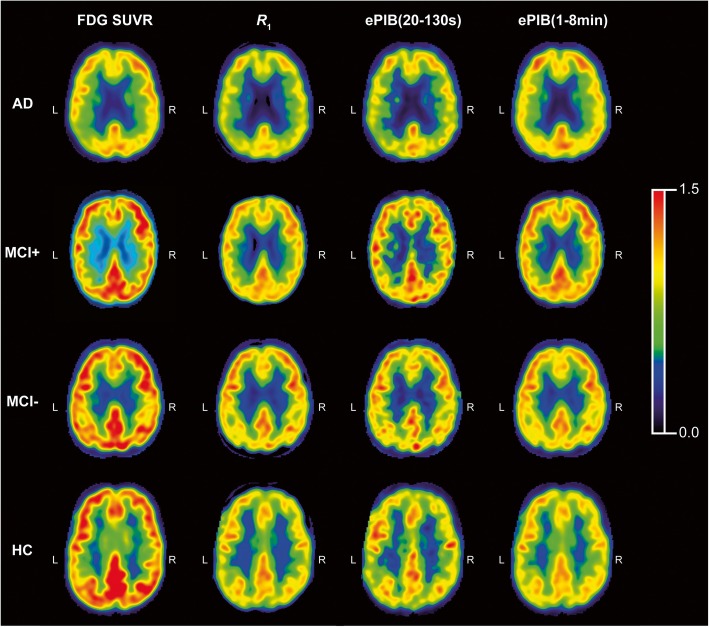
Background: In clinical practice, visual assessment of glucose metabolism images is often used for the diagnosis of Alzheimer's disease (AD) through 2-[18F]-fluoro-2-deoxy-D-glucose (FDG) positron emission tomography (PET) scans. However, visual assessment of the characteristic AD hypometabolic pattern relies on the expertise of the reader. Therefore, user-independent pipelines are preferred to evaluate the images and to classify the subjects. Moreover, glucose consumption is highly correlated with cerebral perfusion. Regional cerebral blood flow (rCBF) images can be derived from dynamic 11C-labelled Pittsburgh Compound B PET scans, which are also used for the assessment of the deposition of amyloid-β plaques on the brain, a fundamental characteristic of AD. The aim of this study was to explore whether these rCBF PIB images could be used for diagnostic purposes through the PMOD Alzheimer's Discrimination Tool.
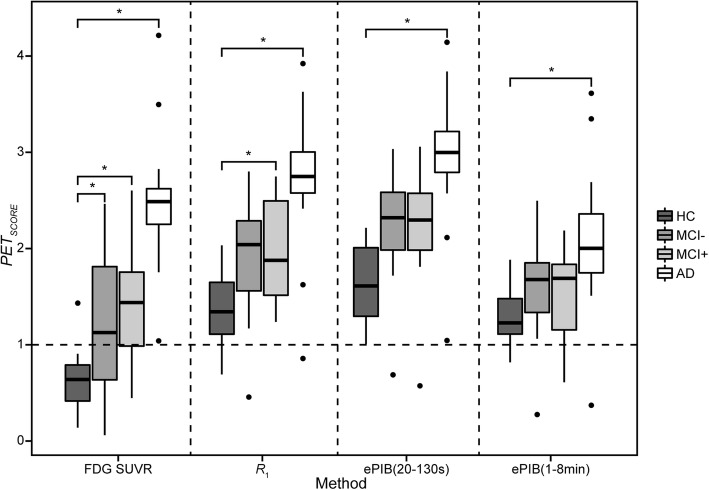
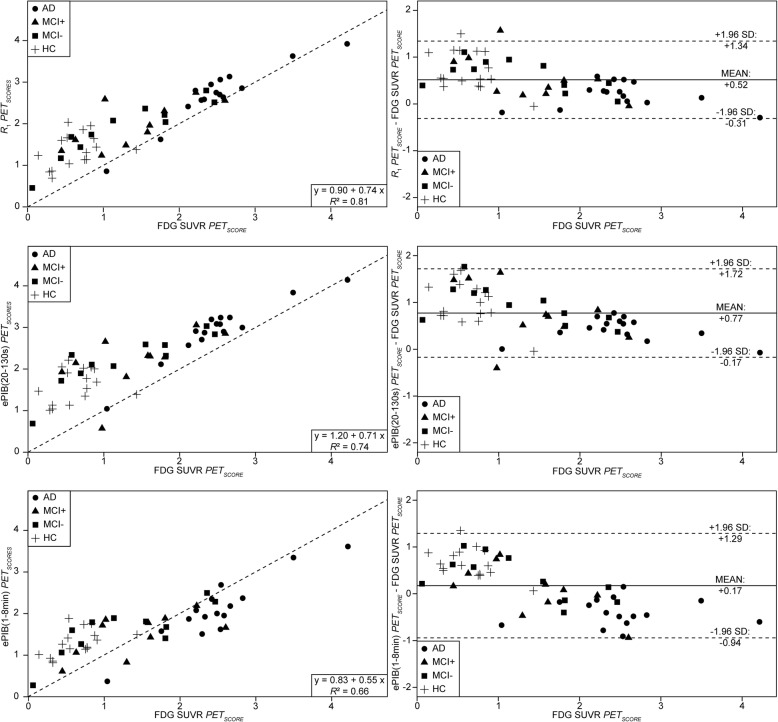
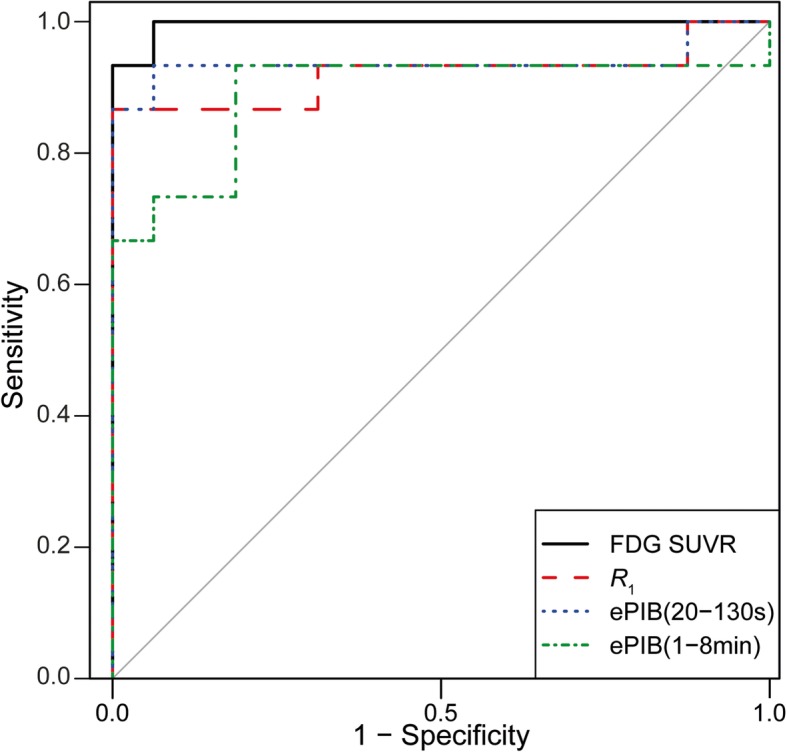
Results: Both tracer relative cerebral flow (R1) and early PIB (ePIB) (20-130 s) uptake presented a good correlation when compared to FDG standardized uptake value ratio (SUVR), while ePIB (1-8 min) showed a worse correlation. All receiver operating characteristic curves exhibited a similar shape, with high area under the curve values, and no statistically significant differences were found between curves. However, R1 and ePIB (1-8 min) had the highest sensitivity, while FDG SUVR had the highest specificity.
Conclusion: rCBF images were suggested to be a good surrogate for FDG scans for diagnostic purposes considering an adjusted threshold value.
Keywords: Alzheimer’s disease; PALZ; PIB; Relative cerebral blood flow.
Conflict of interest statement
The authors declare that they have no competing interests.
Figures
References
-
- Reiman Eric M., Caselli Richard J., Yun Lang S., Chen Kewei, Bandy Daniel, Minoshima Satoshi, Thibodeau Stephen N., Osborne David. Preclinical Evidence of Alzheimer's Disease in Persons Homozygous for the ε4 Allele for Apolipoprotein E. New England Journal of Medicine. 1996;334(12):752–758. doi: 10.1056/NEJM199603213341202. - DOI - PubMed
-
- de Leon M. J., Convit A., Wolf O. T., Tarshish C. Y., DeSanti S., Rusinek H., Tsui W., Kandil E., Scherer A. J., Roche A., Imossi A., Thorn E., Bobinski M., Caraos C., Lesbre P., Schlyer D., Poirier J., Reisberg B., Fowler J. Prediction of cognitive decline in normal elderly subjects with 2-[18F]fluoro-2-deoxy-D-glucose/positron-emission tomography (FDG/PET) Proceedings of the National Academy of Sciences. 2001;98(19):10966–10971. doi: 10.1073/pnas.191044198. - DOI - PMC - PubMed
-
- Small G. W., Ercoli L. M., Silverman D. H. S., Huang S.-C., Komo S., Bookheimer S. Y., Lavretsky H., Miller K., Siddarth P., Rasgon N. L., Mazziotta J. C., Saxena S., Wu H. M., Mega M. S., Cummings J. L., Saunders A. M., Pericak-Vance M. A., Roses A. D., Barrio J. R., Phelps M. E. Cerebral metabolic and cognitive decline in persons at genetic risk for Alzheimer's disease. Proceedings of the National Academy of Sciences. 2000;97(11):6037–6042. doi: 10.1073/pnas.090106797. - DOI - PMC - PubMed
LinkOut - more resources
Full Text Sources
