

Functional systemic CD4 immunity is required for clinical responses to PD-L1/PD-1 blockade therapy
- PMID: 31273938
- PMCID: PMC6609910
- DOI: 10.15252/emmm.201910293
Functional systemic CD4 immunity is required for clinical responses to PD-L1/PD-1 blockade therapy
Abstract
The majority of lung cancer patients progressing from conventional therapies are refractory to PD-L1/PD-1 blockade monotherapy. Here, we show that baseline systemic CD4 immunity is a differential factor for clinical responses. Patients with functional systemic CD4 T cells included all objective responders and could be identified before the start of therapy by having a high proportion of memory CD4 T cells. In these patients, CD4 T cells possessed significant proliferative capacities, low co-expression of PD-1/LAG-3 and were responsive to PD-1 blockade ex vivo and in vivo. In contrast, patients with dysfunctional systemic CD4 immunity did not respond even though they had lung cancer-specific T cells. Although proficient in cytokine production, CD4 T cells in these patients proliferated very poorly, strongly co-upregulated PD-1/LAG-3, and were largely refractory to PD-1 monoblockade. CD8 immunity only recovered in patients with functional CD4 immunity. T-cell proliferative dysfunctionality could be reverted by PD-1/LAG-3 co-blockade. Patients with functional CD4 immunity and PD-L1 tumor positivity exhibited response rates of 70%, highlighting the contribution of CD4 immunity for efficacious PD-L1/PD-1 blockade therapy.
Keywords: B7-H1; PD-1/PD-L1; biomarker; immunotherapy; lung cancer.
© 2019 The Authors. Published under the terms of the CC BY 4.0 license.
Conflict of interest statement
The authors declare that they have no conflict of interest.
Figures
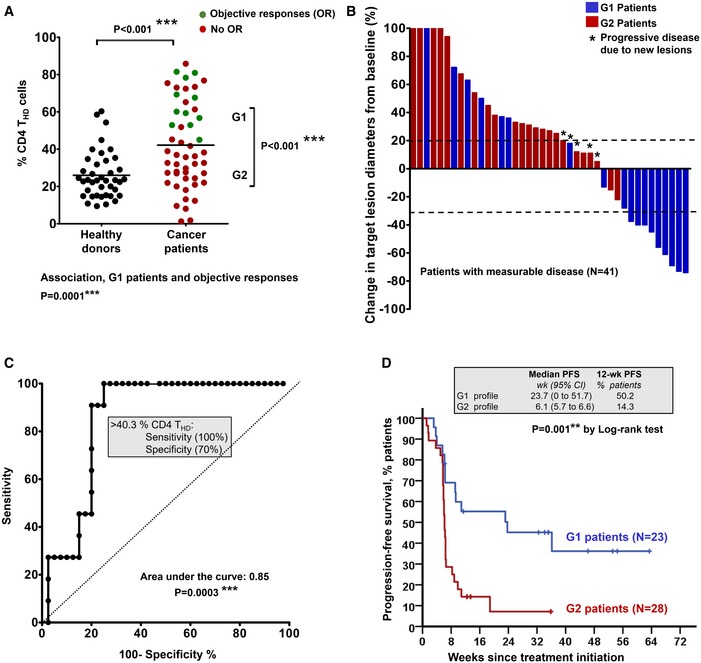
Percentage of circulating highly differentiated CD4 T cells within CD4 cells in age‐matched healthy donors (N = 40) or NSCLC patients (N = 51) or NSCLC patients before undergoing immunotherapies. G1 and G2, groups of patients classified according to high THD cells (G1, > 40% CD4 THD cells) and low THD cells (G2, < 40% CD4 THD cells). Relevant statistical comparisons are shown by the test of Mann–Whitney. In green, objective responders (OR). In red, no OR. Below the graph, correlation of objective responses to G1 and G2 groups by Fisher's exact test.
Waterfall plot of change in lesion size in patients with measurable disease classified as having a G1 (blue) or G2 (red) profile. Dotted lines represent the limit to define significant progression (upper line) or significant regression (lower line).
ROC analysis of baseline CD4 THD quantification as a function of objective clinical responses.
Kaplan–Meier plot for PFS in patients treated with immunotherapies stratified only by G1 (green) and G2 (red) CD4 T‐cell profiles. Patients starting therapy with a G2 profile had an overall response rate (ORR) of 0 and 82% of them experienced progression or death by week 9. ORR was 44.8% for G1 patients, and the 12‐week PFS was 50.2%.
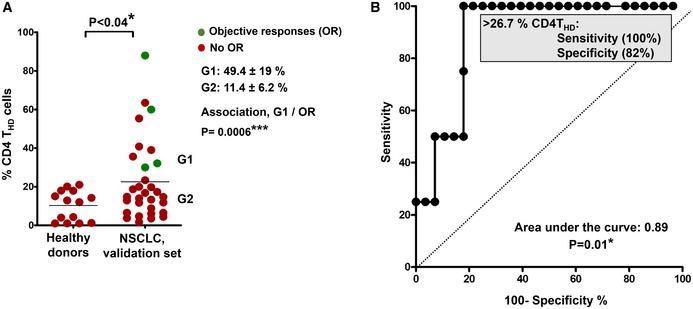
Distribution of circulating CD4 THD cells within CD4+ CD14negative cells in healthy donors (N = 14) and in NSCLC patients constituting the validation set (N = 32). G1 and G2 groups are indicated and separated by the mean (horizontal line). The means ± standard deviations of CD4 THD cells in G1 and G2 groups are shown on the right, as well as the association between G1 profiles and objective responses by Fisher's test. Differences between healthy donors and NSCLC patients were tested with the Mann–Whitney U test.
ROC analysis of CD4 THD quantification in the validation dataset and objective responses. The cut‐off value for identification of responses is shown in the graph.
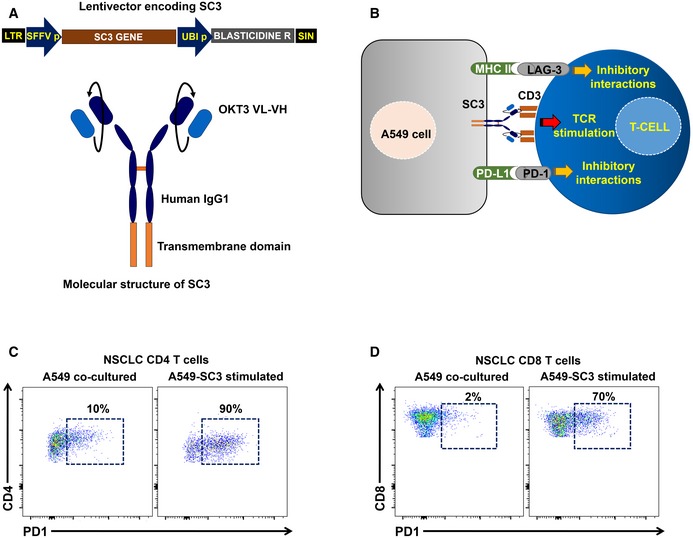
- A
Top, lentivector co‐expressing an anti‐CD3 single‐chain antibody gene (SC3) and blasticidin resistance for selection. SFFVp, spleen focus‐forming virus promoter; UBIp, human ubiquitin promoter; LTR, long terminal repeat; and SIN, U3‐deleted LTR leading to a self‐inactivating lentivector. Bottom, molecular structure of the SC3 molecule, which is anchored to the cell membrane by a transmembrane domain as indicated. OKT3 VL, variable region of the light chain from the anti‐CD3 antibody OKT3; VH, variable region of the heavy chain from the anti‐CD3 antibody OKT3.
- B
Scheme of the cell‐to‐cell interactions mediated by the lentivector‐modified A549 cell and T cells including SC3/CD3, PD‐L1/PD‐1, and MHCII/LAG‐3 interactions as indicated.
- C, D
Representative flow cytometry density plots with the upregulation of PD‐1 expression in CD4 (C) and CD8 T cells (D) from NSCLC patients following co‐incubation with A549‐SC3 cell as indicated (right graph), or with unmodified A549 control (left graph). Percentages of PD‐1+ T cells are shown within the graphs.
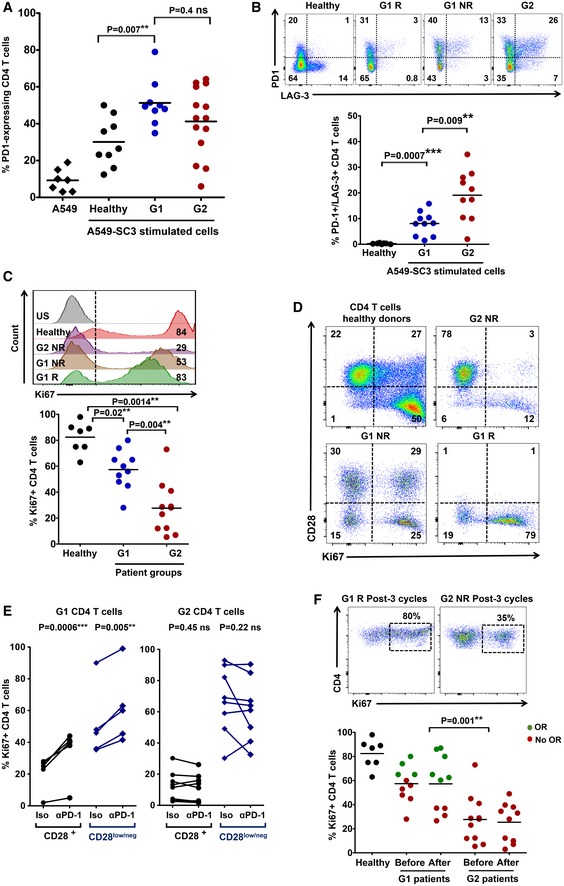
The scatter plot shows PD‐1 expression after co‐culture of CD4 T cells from healthy donors (n = 9) or NSCLC patients (n = 14), as indicated, with A459‐SC3 lung cancer cells. Relevant statistical comparisons with the test of Mann–Whitney are indicated.
Upper graphs, flow cytometry density plots of PD‐1 and LAG‐3 co‐expression in CD4 T cells from healthy donors, a G1 responder (G1 R), a G1 non‐responder (G1 NR), and a G2 non‐responder as indicated, following stimulation with A549‐SC3 cells. Percentage of expressing cells are indicated within each quadrant. Below, same as in the upper graphs but as a scatter plot of the percentage of CD4 T cells that simultaneously co‐express PD‐1 and LAG‐3 that simultaneously co‐express PD‐1 and LAG‐3 in G1 healthy donors (n = 10), G1 (n = 10) and G2 (n = 10) patients. Relevant statistical comparisons are shown with the test of Mann–Whitney.
Upper flow cytometry histograms of Ki67 expression in CD4 T cells from the representative subjects as indicated on the right, after stimulation with A549‐SC3 cells. Vertical dotted line indicates the cut‐off value of positive versus negative Ki67 expression. The percentage of Ki67‐expressing CD4 T cells is shown within the histograms. Below, same data represented as a scatter plot from a sample of G1 and G2 donors as indicated, with relevant statistical comparisons with the test of Mann–Whitney (n = 7–10).
Proliferation of CD4 T cells stimulated by A549‐SC3 cells from the indicated patient groups. CD28 expression is shown together with the proliferation marker Ki67. Percentages of cells within each quadrant are shown.
Same as in (D) but in the presence of an isotype control antibody or an anti‐PD‐1 antibody with the equivalent sequence to pembrolizumab. The effects on CD4 T cells from a G1 and a G2 patient are shown, divided into CD28 high or low/negative subsets as indicated. Relevant statistical comparisons are shown with paired Student's t‐test.
Top, flow cytometry density plots of Ki67 expression in CD4 T cells from representative G1 or G2 patients after three cycles of therapy, activated by incubation with A549‐SC3 cells. Below, same as above but as a dot‐plot graph (n = 7–10). A comparison between proliferating CD4 T cells before and after therapy is shown in unpaired patient samples. G1 R, G1 objective responder patient. G2 NR, G2 patient with no objective responses; green, objective responders (OR) and red, no OR; Iso, treatment with an isotype antibody control; and α‐PD‐1, treatment with anti‐PD‐1 antibody. Statistical comparisons were performed with the test of Mann–Whitney.
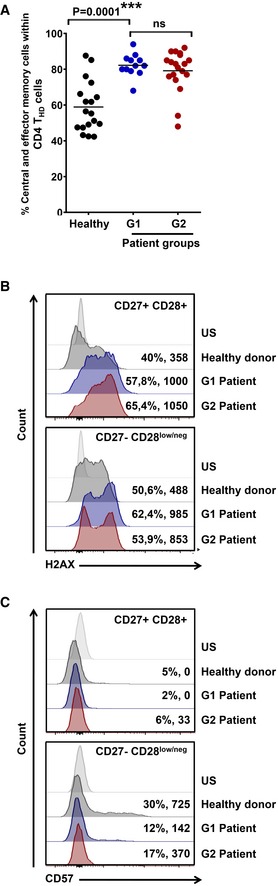
- A
Scatter plot graphs of the percentage of memory phenotypes in baseline CD4 THD cells according to CD62L‐CD45RA expression (% CD45RAnegative CD62Lpositive central‐memory + % CD45RAnegative CD62Lnegative effector‐memory cells) in a sample of healthy donors (n = 18), G1 (n = 12) and G2 (n = 19) patients. Relevant statistical comparisons are shown by one‐way ANOVA followed by Tukey's test.
- B, C
Expression of the genotoxic damage makers H2AX (B) and CD57 (C) by flow cytometry in CD4 T‐cell subsets from an aged‐matched healthy donor, and NSCLC G1 and G2 patients as indicated. Percentage of positivity and mean fluorescent intensities are indicated for each population. Top, histogram analysis within CD27+ CD28+ CD4 T cells, and bottom, CD27negative CD28low/negative counterparts as indicated. US, unstained control.
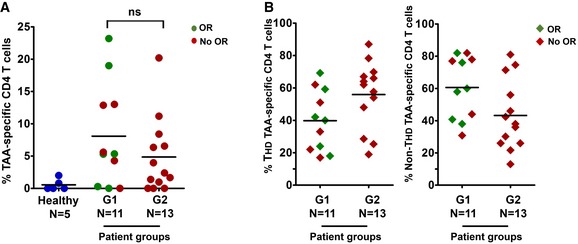
Scatter plot graph with the percentage of lung cancer‐specific systemic CD4 T cells quantified by an autologous DC‐based antigen presentation assay (see Materials and Methods), in a sample of G1 and G2 patients as indicated. Objective responses (OR) are shown in green. In red, patients with no OR.
The scatter plot graph on the left represents the percentage of CD4 THD cells within lung cancer‐specific CD4 T cells in a sample of patients from the indicated G1/G2 groups. On the right, same as left but representing the percentage of CD28+ CD4 T cells within lung cancer‐specific CD4 T cells. Objective responders (OR) are shown in green. In red, patients with no OR.
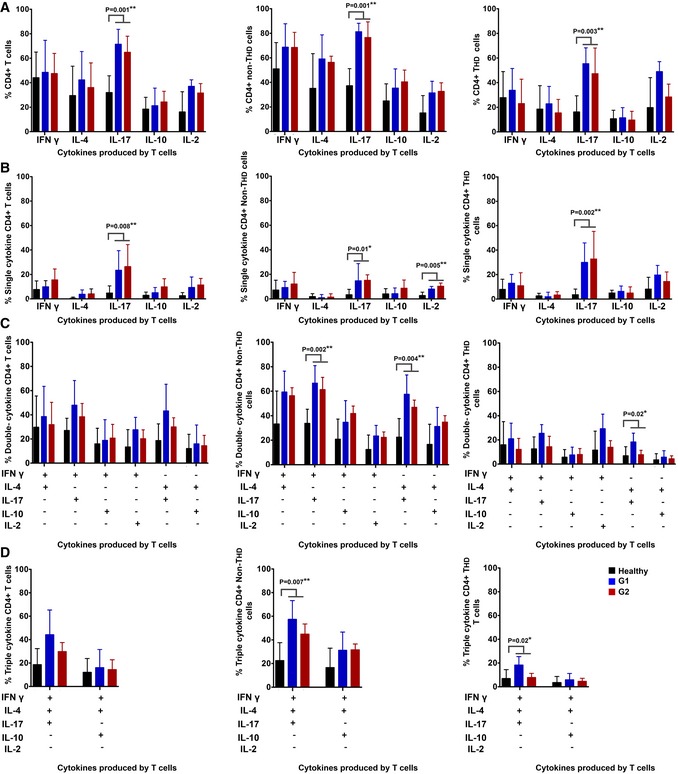
- A
Column graphs representing the percentage of CD4 T cells from NSCLC patients or age‐matched healthy donors as represented in the graph, expressing the indicated cytokines after T‐cell stimulation with anti‐CD3/anti‐CD28 antibodies. Data on total CD4 (left graph), CD28+ subsets (center graph) and CD28negative subsets (right graph) are shown. Error bars correspond to standard deviations, and bars represent means from nine independent biological replicates (healthy donors) and six independent replicates (patients).
- B–D
Same as in (A) but representing CD4 T cells expressing only one cytokine (B), two (C) or three cytokines simultaneously (D). Error bars correspond to standard deviations, and bars represent means from five independent biological replicates (patients).
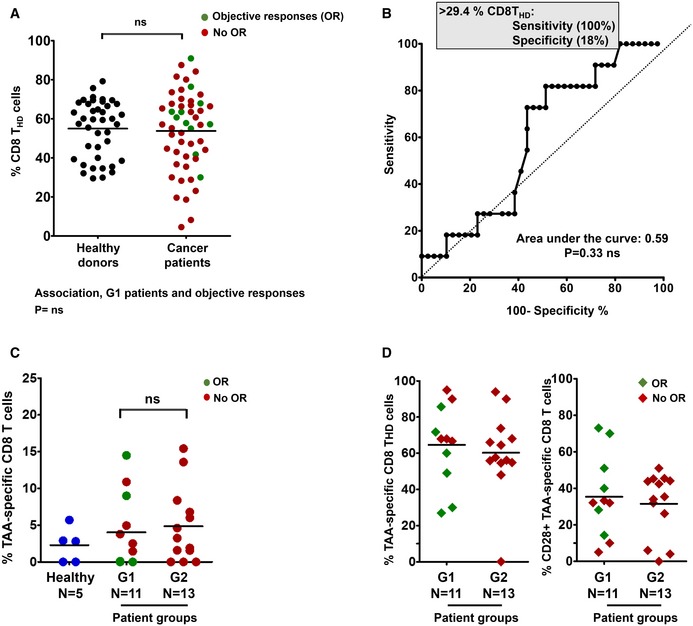
Percentage of circulating highly differentiated CD8 cells in age‐matched healthy donors (n = 40) and NSCLC patients (n = 51) before undergoing immunotherapies. Relevant statistical comparisons are shown by the test of Mann–Whitney. In green, objective responders (OR). In red, no OR.
ROC analysis of baseline CD8 THD quantification as a function of objective clinical responses.
Dot‐plot of lung cancer antigen‐specific CD8 T cells obtained before the start of immunotherapies and stimulated with A549‐loaded autologous DCs autologous DC in healthy donors (n = 5), G1 (n = 11) and G2 (n = 13) patients, as indicated. Relevant statistical comparisons are indicated by the test of Kruskal–Wallis.
Left dot‐plot, percentage of CD28‐negative CD8 T cells within TAA‐specific CD8 subsets in G1 (n = 11) and G2 (n = 13) patients, as indicated. Right dot‐plot, same as left but with CD28‐positive subsets. Green, objective responders (OR) and red, no ORs. N, number of biological replicates (independent patients).
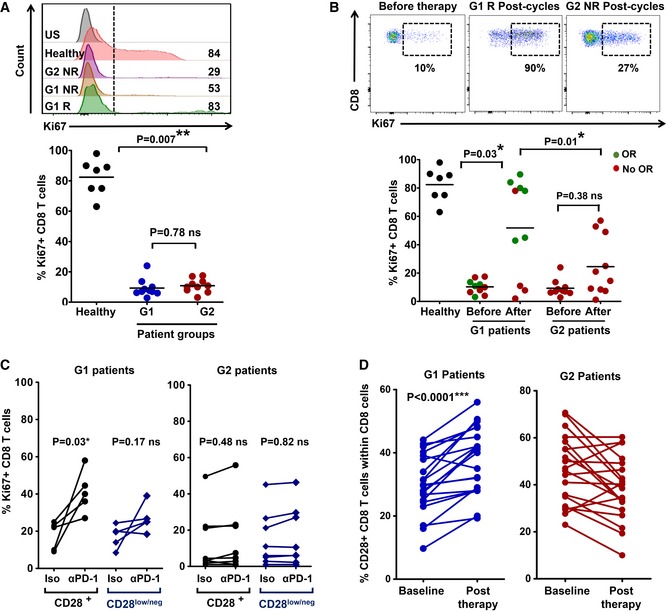
Upper flow cytometry histograms, expression of the proliferation marker Ki67 in CD8 T cells from the indicated patients or healthy donor before the start of immunotherapy, stimulated ex vivo by A549‐SC3 cells. Numbers indicate mean fluorescence intensities. G1 R and G1 NR, responder and non‐responder G1 patient, respectively; G2 NR, non‐responder G2 patient. US, unstained control. Below, same as above but as a dot plot graph with percentage of proliferating Ki67+ CD8 T cells from the indicated groups (n = 7–10). Relevant statistical comparisons are shown with the test of Mann–Whitney.
Upper flow cytometry density plots, expression of Ki67 in ex vivo‐stimulated CD8 T cells from the indicated patients before and after the start of immunotherapies. NR, non‐responder patient; R, responder patient. Below, dot‐plots of the percentage of Ki67+ proliferating CD8 T cells after ex vivo activation by A549‐SC3 cells. CD8 T cells were obtained from samples of G1 or G2 patients before immunotherapy and after three cycles of anti‐PD‐1 therapy (n = 7–10). Relevant statistical comparisons are shown with the test of Mann–Whitney. Green, objective responders (OR) and red, no ORs.
Same as in (A) but in the presence of an isotype control antibody or an anti‐PD‐1 antibody molecularly equivalent to pembrolizumab. Relevant statistical comparisons are shown with comparisons carried out with paired Student's t‐test.
Change in CD8 CD28+ T cells from baseline to post‐therapy in G1 patients (left) or in G2 patients (right). Statistical comparisons were carried out with paired Student's t‐test.
- A
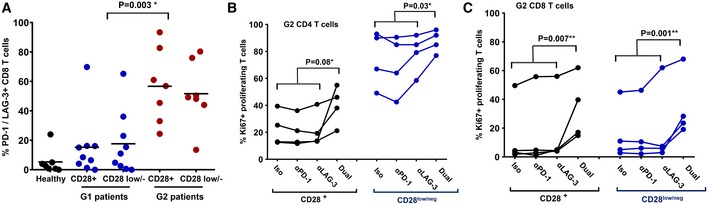
Scatter plots of PD‐1/LAG‐3‐expressing CD8 T cells after activation by A459‐SC3 cells in a sample of G1 (n = 9) and G2 (n = 7) patients within CD28+ and CD28negative populations as indicated in the figure. Relevant statistical comparisons are shown with the test of Kruskal‐Wallis.
- B, C
Dot‐plot representing the percentage of proliferating CD4 T cells (B) and CD8 T cells (C) from a sample of G2 patients before starting immunotherapy, activated ex vivo by A549‐SC3 cells in the presence of the indicated antibodies. “Dual” represents the addition of both anti‐PD‐1 and anti‐LAG‐3 antibodies. Appropriate statistical comparisons are shown within the graph with two‐way paired ANOVA. Data from CD28+ and CD28negative subsets are represented as indicated.
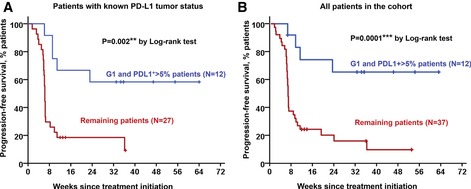
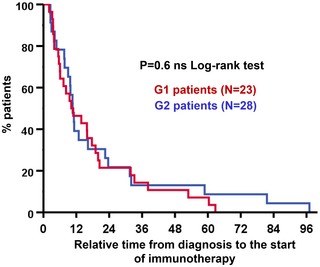
Kaplan–Meier plot for PFS in patients undergoing immune checkpoint inhibitor therapies stratified by G1/PD‐L1+ tumors (blue) and remaining patients for whom their PD‐L1 tumor status is known (red).
Same as in (A) but including all patients in the study cohort. Remaining patients (red) also included G1 patients with PD‐L1 low/negative tumors, G1 patients with unknown PD‐L1 tumor status, and G2 patients with either PD‐L1+ or PD‐L1‐negative tumors.
References
-
- Arakawa F, Kuroki M, Kuwahara M, Senba T, Ozaki H, Matsuoka Y, Misumi Y, Kanda H, Watanabe T (1996) Cloning and sequencing of the VH and V kappa genes of an anti‐CD3 monoclonal antibody, and construction of a mouse/human chimeric antibody. J Biochem 120: 657–662 - PubMed
-
- Bigot F, Castanon E, Baldini C, Hollebecque A, Carmona A, Postel‐Vinay S, Angevin E, Armand JP, Ribrag V, Aspeslagh S et al (2017) Prospective validation of a prognostic score for patients in immunotherapy phase I trials: the Gustave Roussy Immune Score (GRIm‐Score). Eur J Cancer 84: 212–218 - PubMed
Publication types
MeSH terms
Substances
Grants and funding
- PROYE16001ESCO/Fundación Científica Asociación Española Contra el Cáncer (AECC)/International
- PI17/02119/MEC|Instituto de Salud Carlos III ISCIII/International
- CP12/03114/Miguel Servet Fellowship, Instituto de Salud Carlos III ISCIII/International
- PRECIPITA/FECYT/International
- Universidad Publica de Navarra/International
LinkOut - more resources
Full Text Sources
Other Literature Sources
Medical
Research Materials
