. 2019 Oct;10(5):1045-1059.
doi: 10.1002/jcsm.12441. Epub 2019 Jul 4.

Tumour-derived transforming growth factor-β signalling contributes to fibrosis in patients with cancer cachexia

Affiliations

Tumour-derived transforming growth factor-β signalling contributes to fibrosis in patients with cancer cachexia

Joanna D C C Lima et al. J Cachexia Sarcopenia Muscle. 2019 Oct.

Abstract

Background: Cachexia is a paraneoplastic syndrome related with poor prognosis. The tumour micro-environment contributes to systemic inflammation and increased oxidative stress as well as to fibrosis. The aim of the present study was to characterise the inflammatory circulating factors and tumour micro-environment profile, as potentially contributing to tumour fibrosis in cachectic cancer patients.

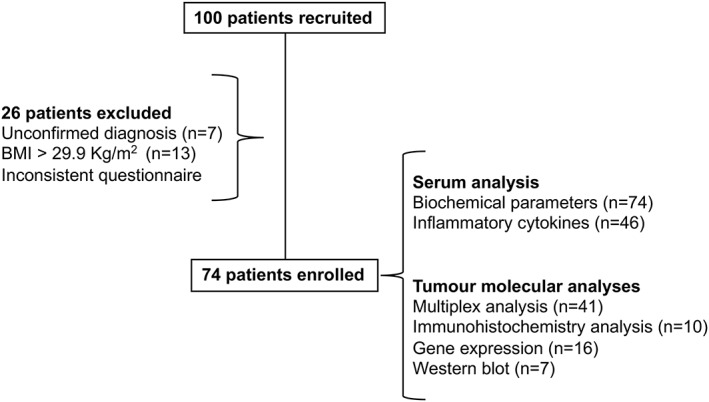
Methods: 74 patients (weight stable cancer n = 31; cachectic cancer n = 43) diagnosed with colorectal cancer were recruited, and tumour biopsies were collected during surgery. Multiplex assay was performed to study inflammatory cytokines and growth factors. Immunohistochemistry analysis was carried out to study extracellular matrix components.

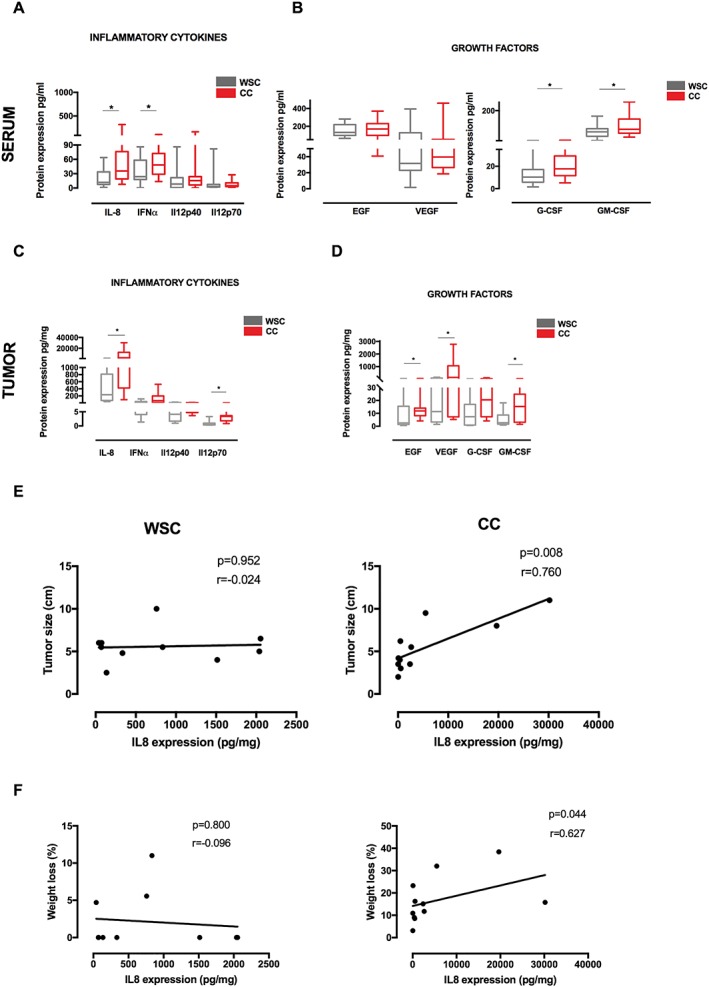
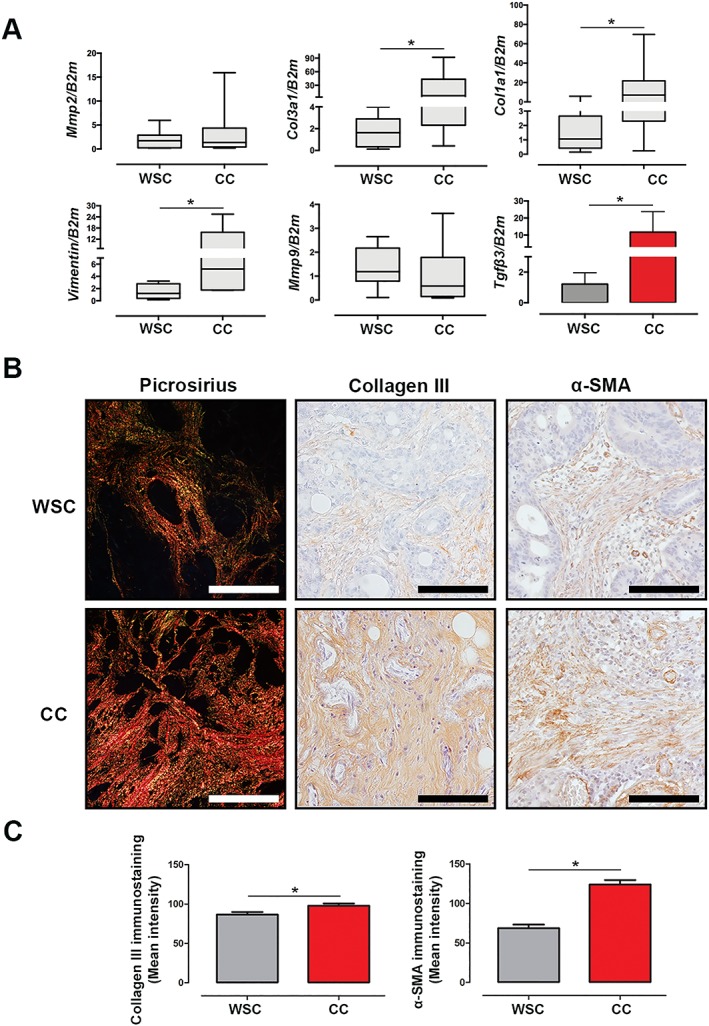
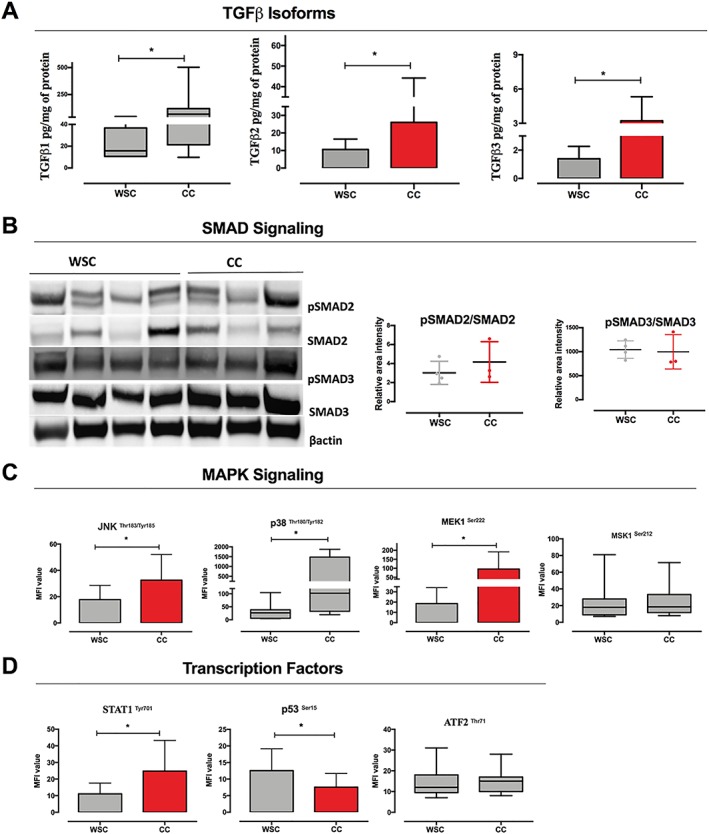
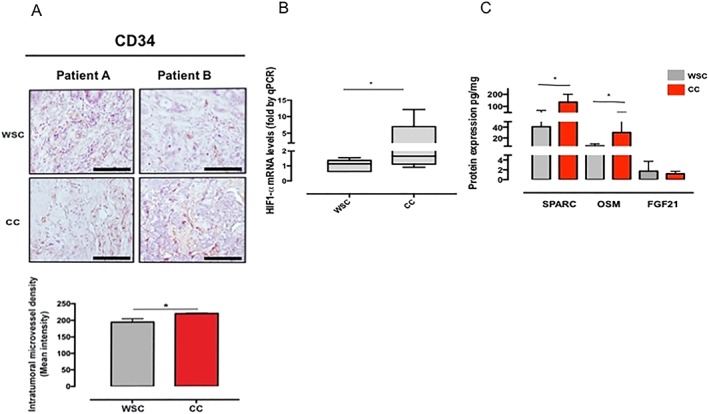
Results: Higher protein expression of inflammatory cytokines and growth factors such as epidermal growth factor, granulocyte-macrophage colony-stimulating factor, interferon-α, and interleukin (IL)-8 was observed in the tumour and serum of cachectic cancer patients in comparison with weight-stable counterparts. Also, IL-8 was positively correlated with weight loss in cachectic patients (P = 0.04; r = 0.627). Immunohistochemistry staining showed intense collagen deposition (P = 0.0006) and increased presence of α-smooth muscle actin (P < 0.0001) in tumours of cachectic cancer patients, characterizing fibrosis. In addition, higher transforming growth factor (TGF)-β1, TGF-β2, and TGF-β3 expression (P = 0.003, P = 0.05, and P = 0.047, respectively) was found in the tumour of cachectic patients, parallel to p38 mitogen-activated protein kinase alteration. Hypoxia-inducible factor-1α mRNA content was significantly increased in the tumour of cachectic patients, when compared with weight-stable group (P = 0.005).

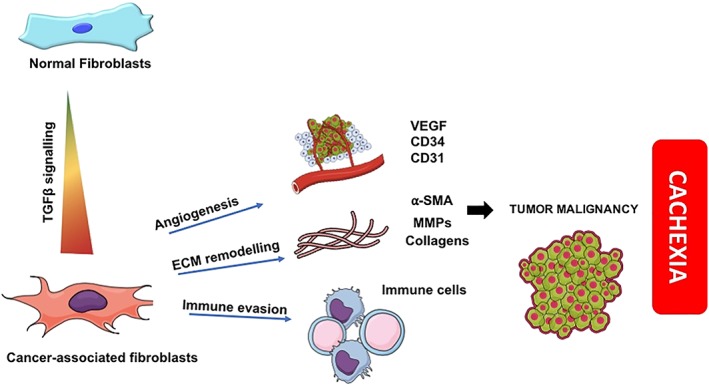
Conclusions: Our results demonstrate TGF-β pathway activation in the tumour in cachexia, through the (non-canonical) mitogen-activated protein kinase pathway. The results show that during cachexia, intratumoural inflammatory response contributes to the onset of fibrosis. Tumour remodelling, probably by TGF-β-induced transdifferentiation of fibroblasts to myofibroblasts, induces unbalanced inflammatory cytokine profile, angiogenesis, and elevation of extracellular matrix components (EMC). We speculate that these changes may affect tumour aggressiveness and present consequences in peripheral organs.

Keywords: Cachexia; Epithelial-mesenchymal components; Fibrosis; Tumour micro-environment.


Conflict of interest statement

None declared.

Figures

Figure 1
Figure 1
Flow chart of patient enrolment.
Figure 2
Figure 2
Inflammatory cytokines and growth factors in cachectic patients. Data were expressed as mean ± standard deviation or as median [first quartile; third quartile]. *Significant difference between the groups was tested using Mann–Whitney U test (P < 0.05). Pearson correlation analysis was employed between groups. (A) Protein expression of circulating inflammatory cytokines in serum of patients. (B) Protein expression of growth factors in serum of patients. Protein concentration in pg/mL of total protein. (C) Protein expression of inflammatory cytokines in tumour biopsies of patients. (D) Protein expression of growth factors in tumour biopsies of patients. Protein concentration in pg/mg of total protein. (E) Correlation between tumour size and interleukin (IL)‐8 expression in tumour. (F) Correlation between percentage of weight loss and IL‐8 expression in tumour. EGF, epidermal growth factor; G‐CSF, granulocyte colony‐stimulating factor; GM‐CSF, granulocyte–macrophage colony‐stimulating factor; IFN‐α, interferon‐α; VEGF, vascular endothelial growth factor. Sample number in serum: weight‐stable cancer (WSC) (n = 18–23) and cancer cachexia (CC) (n = 18–23). Sample number in tumour analysis: WSC (n = 8–10) and CC (n = 9–11).
Figure 3
Figure 3
Fibrosis is induced in the tumour of cachectic patients. Data were expressed as mean ± standard deviation or as median [first quartile; third quartile]. *Significant difference between the groups was tested using unpaired t‐test and Mann–Whitney U test (P < 0.05). (A) Gene expression of components to extracellular matrix. B2m, β2‐microglobulin; COL1A, type I collagen; COL3A, type III collagen; MMP2, matrix metalloproteinase 2; MMP9, matrix metalloproteinase 9; TGF‐β3: transforming growth factor‐β3. Weight‐stable cancer (WSC) (n = 7–8) and cancer cachexia (CC) (n = 7–8). (B, C) Representative picrosirius red staining (n = 1 per group) and immunohistochemistry for collagen III (WSC: n = 5; CC: n = 5) and α‐smooth muscle actin (α‐SMA) (WSC: n = 5; CC: n = 5) in the tumour sample. Scale bar: 112.0 μm.
Figure 4
Figure 4
Interaction between mitogen‐activated protein kinase (MAPK) and transforming growth factor (TGF)‐β signalling in cachexia. Data were expressed as mean ± standard deviation or as median [first quartile; third quartile]. *Significant difference between the groups was tested using unpaired t‐test and Mann–Whitney U test (P < 0.05). Protein concentration in pg/mL of total protein or medium fluorescent intensity (MFI). (A) Protein expression of TGF‐β isoforms [weight‐stable cancer (WSC): n = 7–10; cancer cachexia (CC): n = 7–10]. (B) Western blot analysis of phosphoSMAD2 (pSMAD2)/SMAD2 and phosphoSMAD3 (pSMAD3)/SMAD3 and band intensity (densitometry), and data are mean ± standard deviation (WSC: n = 4; CC: n = 3). (C) Relative levels of MAPK signalling components (WSC: n = 7–10; CC: n = 8–10; MFI value). (D) Relative levels of transcription factors related to MAPK signalling (WSC: n = 7–10; CC: n = 8–10; MFI value).
Figure 5
Figure 5
Angiogenesis mediated by hypoxia in the tumour of cachectic patients. Data were expressed as mean ± standard deviation or as median [first quartile; third quartile]. *Significant difference between the groups was tested using unpaired t‐test and Mann–Whitney U test (P < 0.05). Protein concentration expressed to medium fluorescent intensity (MFI). (A) Immunohistochemical staining for intratumoural microvessel density [CD34+; weight‐stable cancer (WSC): n = 4 and cancer cachexia (CC): n = 4]. (B) Gene expression of hypoxia‐inducible factor‐1α (HIF1‐α) (WSC: n = 7 and CC: n = 7). (C) Protein expression of myokines in tumour micro‐environment of cachectic patients (n = 7–8). FGF21, fibroblast growth factor 21; OSM, oncostatin M; qRT‐PCR, Real‐Time Quantitative Reverse Transcription PCR; SPARC, secreted protein acidic and rich in cysteine. Scale bar: 110.0 μm.
Figure 6
Figure 6
Summary of transforming growth factor‐β (TGF‐β) signalling in the tumour micro‐environment in cachexia. MMPs, matrix metalloproteinases; VEGF, vascular endothelial growth factor; α‐smooth muscle actin.

References

    1. Porporato PE. Understanding cachexia as a cancer metabolism syndrome. Oncogene 2016;5:e200–e210. - PMC - PubMed
    1. Mondello P, Lacquaniti A, Mondello S, Bolignano D, Pitini V, Aloisi C, et al. Emerging markers of cachexia predict survival in cancer patients. BMC Cancer 2014;14:1–10. - PMC - PubMed
    1. Donohoe CL, Ryan AM, Reynolds JV. Cancer cachexia: mechanisms and clinical implications. Gastroenterol Res Pract 2011;2011:1–13. - PMC - PubMed
    1. Vanderveen BN, Fix DK, Carson JA. Disrupted skeletal muscle mitochondrial dynamics, mitophagy, and biogenesis during cancer cachexia: a role for inflammation. Oxid Med Cell Longev 2017;2017:24–27. - PMC - PubMed
    1. De Matos‐Neto EM, Lima JDCC, de Pereira WO, Figuerêdo RG, Riccardi DMDR, Radloff K, et al. Systemic inflammation in cachexia—is tumor cytokine expression profile the culprit? Front Immunol 2015;6:629. - PMC - PubMed

Publication types

MeSH terms

LinkOut - more resources