

Median Nerve Stimulation Based BCI: A New Approach to Detect Intraoperative Awareness During General Anesthesia
- PMID: 31275105
- PMCID: PMC6593137
- DOI: 10.3389/fnins.2019.00622
Median Nerve Stimulation Based BCI: A New Approach to Detect Intraoperative Awareness During General Anesthesia
Abstract
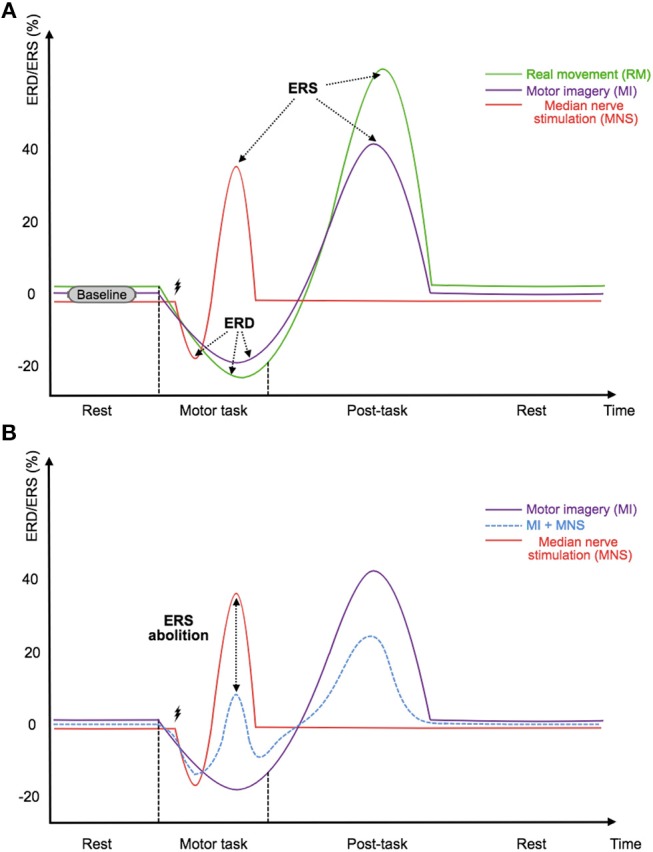
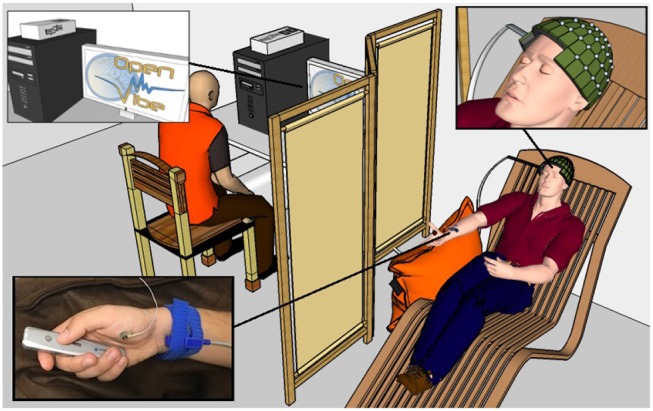
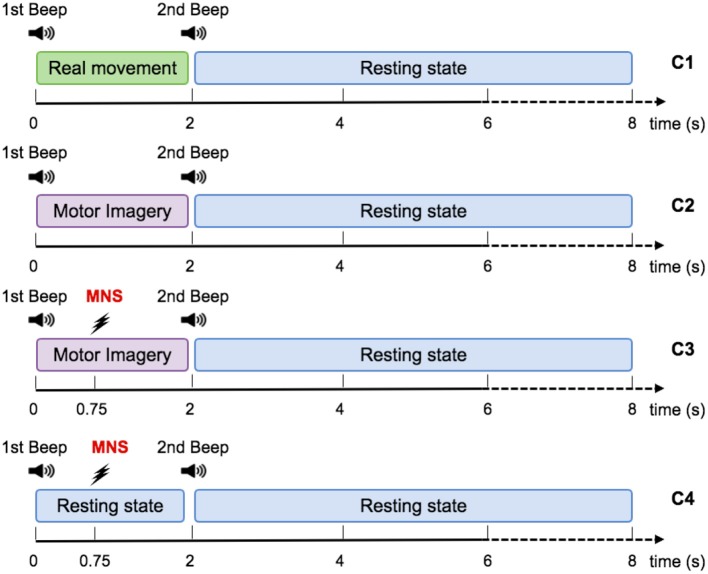
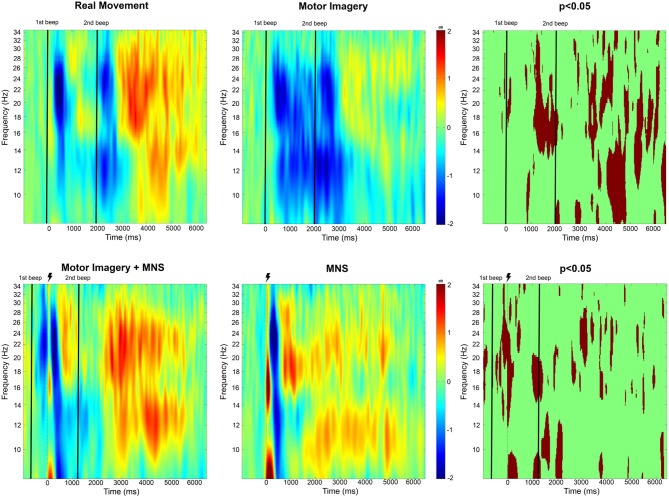
Hundreds of millions of general anesthesia are performed each year on patients all over the world. Among these patients, 0.1-0.2% are victims of Accidental Awareness during General Anesthesia (AAGA), i.e., an unexpected awakening during a surgical procedure under general anesthesia. Although anesthesiologists try to closely monitor patients using various techniques to prevent this terrifying phenomenon, there is currently no efficient solution to accurately detect its occurrence. We propose the conception of an innovative passive brain-computer interface (BCI) based on an intention of movement to prevent AAGA. Indeed, patients typically try to move to alert the medical staff during an AAGA, only to discover that they are unable to. First, we examine the challenges of such a BCI, i.e., the lack of a trigger to facilitate when to look for an intention to move, as well as the necessity for a high classification accuracy. Then, we present a solution that incorporates Median Nerve Stimulation (MNS). We investigate the specific modulations that MNS causes in the motor cortex and confirm that they can be altered by an intention of movement. Finally, we perform experiments on 16 healthy participants to assess whether an MI-based BCI using MNS is able to generate high classification accuracies. Our results show that MNS may provide a foundation for an innovative BCI that would allow the detection of AAGA.
Keywords: anesthesia; brain-computer interface; intraoperative awareness; median nerve stimulation; motor imagery.
Figures
Similar articles
-
Detection of Motor Cerebral Activity After Median Nerve Stimulation During General Anesthesia (STIM-MOTANA): Protocol for a Prospective Interventional Study.JMIR Res Protoc. 2023 Feb 2;12:e43870. doi: 10.2196/43870. JMIR Res Protoc. 2023. PMID: 36729587 Free PMC article.
-
MOTANA: study protocol to investigate motor cerebral activity during a propofol sedation.Trials. 2019 Aug 28;20(1):534. doi: 10.1186/s13063-019-3596-9. Trials. 2019. PMID: 31455386 Free PMC article.
-
Assessing motor imagery in brain-computer interface training: Psychological and neurophysiological correlates.Neuropsychologia. 2017 Mar;97:56-65. doi: 10.1016/j.neuropsychologia.2017.02.005. Epub 2017 Feb 4. Neuropsychologia. 2017. PMID: 28167121
-
From classic motor imagery to complex movement intention decoding: The noninvasive Graz-BCI approach.Prog Brain Res. 2016;228:39-70. doi: 10.1016/bs.pbr.2016.04.017. Epub 2016 May 31. Prog Brain Res. 2016. PMID: 27590965 Review.
-
Accidental awareness during anesthesia in children.Paediatr Anaesth. 2016 May;26(5):468-74. doi: 10.1111/pan.12894. Paediatr Anaesth. 2016. PMID: 27059416 Review.
Cited by
-
The Differences Between Motor Attempt and Motor Imagery in Brain-Computer Interface Accuracy and Event-Related Desynchronization of Patients With Hemiplegia.Front Neurorobot. 2021 Nov 5;15:706630. doi: 10.3389/fnbot.2021.706630. eCollection 2021. Front Neurorobot. 2021. PMID: 34803647 Free PMC article.
-
Influence of the visuo-proprioceptive illusion of movement and motor imagery of the wrist on EEG cortical excitability among healthy participants.PLoS One. 2021 Sep 2;16(9):e0256723. doi: 10.1371/journal.pone.0256723. eCollection 2021. PLoS One. 2021. PMID: 34473788 Free PMC article.
-
EEG-based emergency braking intention detection during simulated driving.Biomed Eng Online. 2023 Jul 1;22(1):65. doi: 10.1186/s12938-023-01129-4. Biomed Eng Online. 2023. PMID: 37393355 Free PMC article.
-
A Review of Non-Cardiac Complications of General Anesthesia: The Current State of Knowledge.Med Sci Monit. 2025 Apr 17;31:e947561. doi: 10.12659/MSM.947561. Med Sci Monit. 2025. PMID: 40241288 Free PMC article. Review.
-
Brain-computer interfaces: the innovative key to unlocking neurological conditions.Int J Surg. 2024 Sep 1;110(9):5745-5762. doi: 10.1097/JS9.0000000000002022. Int J Surg. 2024. PMID: 39166947 Free PMC article. Review.
References
LinkOut - more resources
Full Text Sources