Review
. 2019 Jun 19:10:769.
doi: 10.3389/fphys.2019.00769. eCollection 2019.

On the Shape of the Force-Velocity Relationship in Skeletal Muscles: The Linear, the Hyperbolic, and the Double-Hyperbolic

Affiliations
Review

On the Shape of the Force-Velocity Relationship in Skeletal Muscles: The Linear, the Hyperbolic, and the Double-Hyperbolic

Julian Alcazar et al. Front Physiol. .

Abstract

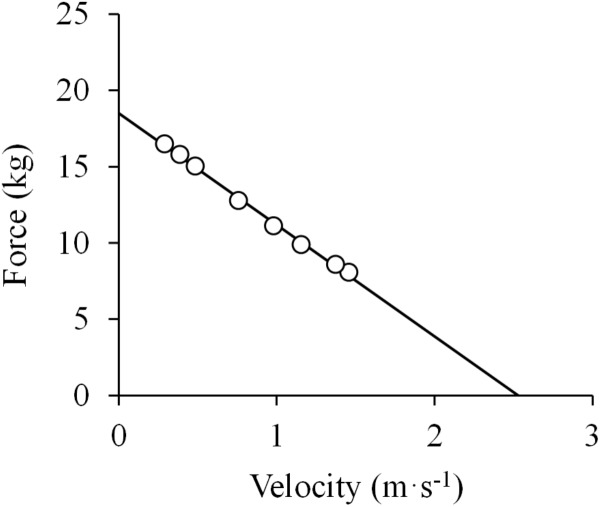
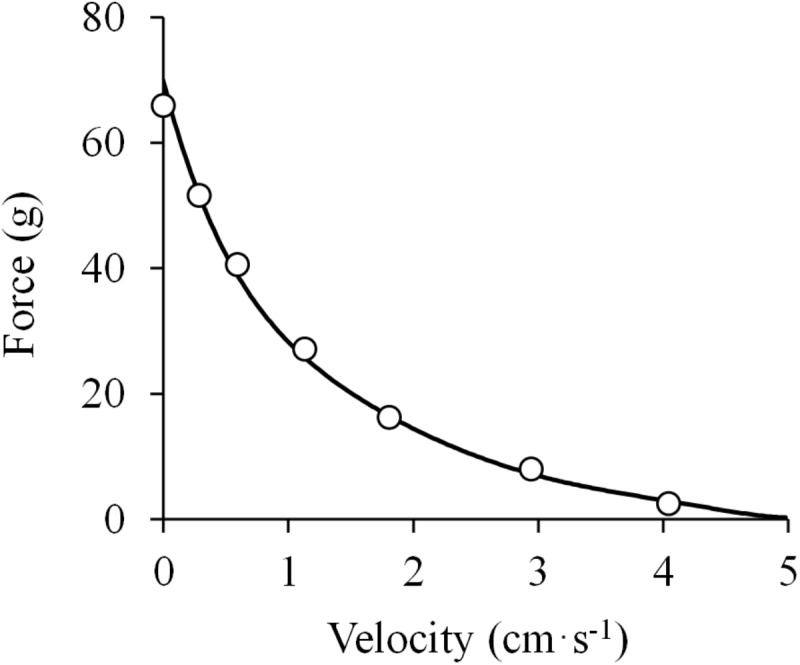
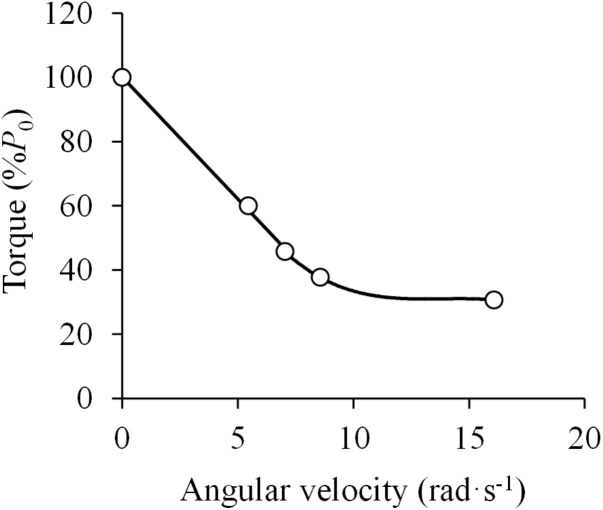
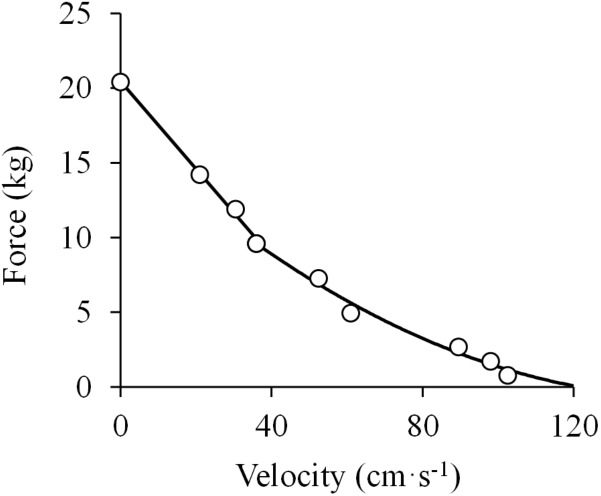
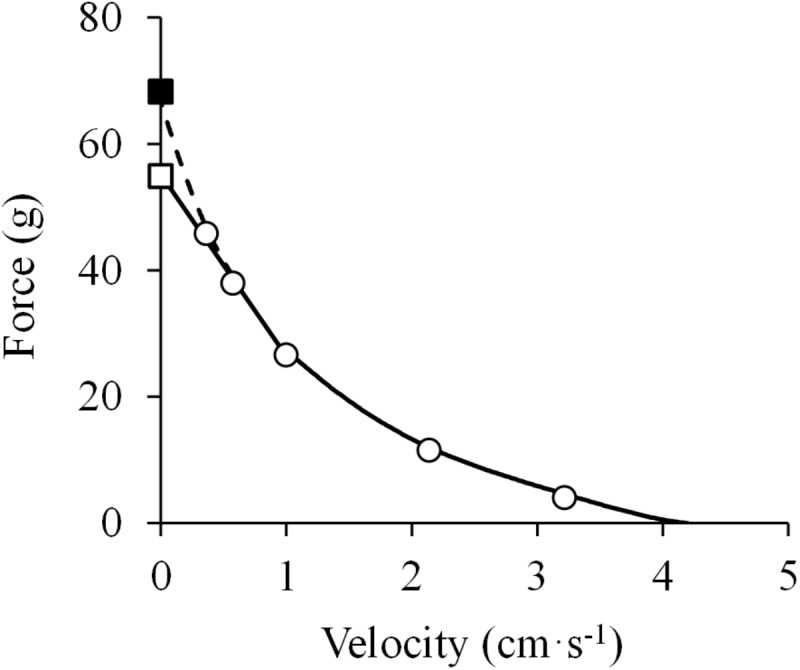
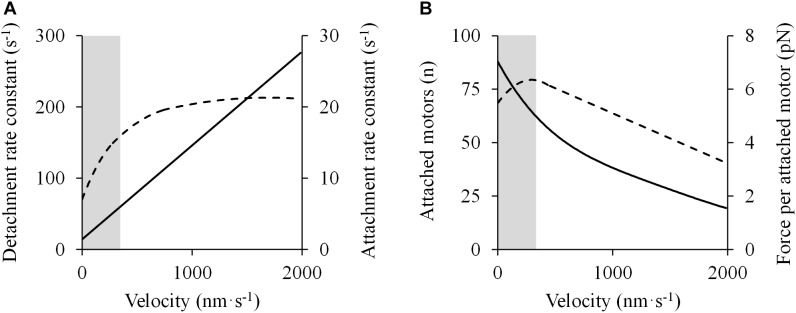
The shape of the force-velocity (F-V) relationship has important implications for different aspects of muscle physiology, such as muscle efficiency and fatigue, the understanding of the pathophysiology of several myopathies or the mechanisms of muscle contraction per se, and may be of relevance for other fields, such as the development of robotics and prosthetic applications featuring natural muscle-like properties. However, different opinions regarding the shape of the F-V relationship and the underlying mechanisms exist in the literature. In this review, we summarize relevant evidence on the shape of the F-V relationship obtained over the last century. Studies performed at multiple scales ranging from the sarcomere to the organism level have described the concentric F-V relationship as linear, hyperbolic or double-hyperbolic. While the F-V relationship has most frequently been described as a rectangular hyperbola, a large number of studies have found deviations from the hyperbolic function at both ends of the F-V relation. Indeed, current evidence suggests that the F-V relation in skeletal muscles follows a double-hyperbolic pattern, with a breakpoint located at very high forces/low velocities, which may be a direct consequence of the kinetic properties of myofilament cross-bridge formation. Deviations at low forces/high velocities, by contrast, may be related to a recently discovered, calcium-independent regulatory mechanism of muscle contraction, which may also explain the low metabolic cost of very fast muscle shortening contractions. Controversial results have also been reported regarding the eccentric F-V relationship, with studies in prepared muscle specimens suggesting that maximum eccentric force is substantially greater than isometric force, whereas in vivo studies in humans show only a modest increase, no change, or even a decrease in force in lengthening contractions. This review discusses possible reasons reported in the literature for these discrepant findings, including the testing procedures (familiarization, pre-load condition, and temperature) and a potential neural inhibition at higher lengthening velocities. Finally, some unresolved questions and recommendations for F-V testing in humans are reported at the end of this document.

Keywords: Edman’s equation; Hill’s equation; contraction velocity; maximal unloaded shortening velocity; motor unit; muscle contraction; muscle power; torque-velocity.


Figures

FIGURE 1
FIGURE 1
Linear force-velocity relationship. Data were obtained from Figure 4 in Hill (1922) using specialized software (ImageJ 1.51q8, NIH, United States). This modified version represents the force-velocity relationship of a standard subject during elbow flexions. From those data, force was calculated as the ratio between mechanical work and the range of movement (ROM) during the exercise (0.6 m), and velocity as the ROM divided by the time registered for each repetition. A linear function was fitted to the data (least squares method): F = –7.3 ×V + 18.5; R2 = 0.997.
FIGURE 2
FIGURE 2
Hyperbolic force-velocity relationship. Data were obtained from Figure 12 in Hill (1938) using specialized software (ImageJ 1.51q8, NIH, United States). This modified version represents the force-velocity relationship of the isolated sartorius muscle of a frog. A hyperbolic function was fitted to the data (least squares method): (F + 14.4) × (V + 1.0) = (70.6 + 14.4) × 1.0; R2 = 0.998.
FIGURE 3
FIGURE 3
Force (torque)-velocity (angular velocity) relationship. Data were obtained from Figure 8 in Dern et al. (1947) using specialized software (ImageJ 1.51q8, NIH, United States). This modified version represents the force-velocity relationship of a standard subject during elbow flexions. P0 denotes the maximal isometric torque. The attempts with no apparent effect of fatigue were selected. A linear function was fitted to the data above 40% of P0 (F = –7.6 ×V + 100.3; R2 = 0.998) and a third order polynomial function was fitted to the data below 40% of P0 (F = –0.05 ×V3 + 2.00 ×V2 – 27.67 ×V + 158.10; R2 = 1.000) (least squares method in both).
FIGURE 4
FIGURE 4
Force-velocity relationship. Data were obtained from Figure 1 in Ralston et al. (1949) using specialized software (ImageJ 1.51q8, NIH, United States). This modified version represents the force-velocity relationship of the in vivo human pectoralis major muscle. A linear function was fitted to the data above 40% of maximal isometric force (P0) (F = –0.29 × V + 20.43; R2 = 0.996) and a second order polynomial function was fitted to the data below 40% of P0 (F = 0.0008 ×V2 – 0.2335 ×V + 16.991; R2 = 0.983) (least squares method in both).
FIGURE 5
FIGURE 5
Force-velocity relationship. Data were obtained from Figure 5 in Abbott and Wilkie (1953) using specialized software (ImageJ 1.51q8, NIH, United States). This modified version represents the force-velocity relationship of the isolated sartorius muscle of a frog. When the baseline isometric force was considered (closed square), a hyperbolic equation was fitted to the data [(F + 18.5) × (V + 1.2) = (67.0 + 18.5) × 1.2; R2 = 0.999] (dashed line in the high-force region) (least squares method). In contrast, when the isometric force measured after the isotonic recordings was considered (open square), a linear model was adequately fitted to the data above 40% of maximal isometric force (P0) (F = –28.8 ×V + 55.3; R2 = 0.996) (solid line in the high-force region), while the hyperbolic function was adequately fitted to the F-V data below 40% of P0 (R2 = 0.999) (solid line in the low-force region) (least squares method in both).
FIGURE 6
FIGURE 6
(A) Double-hyperbolic force-velocity relationship. Data were obtained from Figure 2 in Edman (1988a) using specialized software (ImageJ 1.51q8, NIH, United States). This modified version represents the force-velocity relationship of a single muscle fiber from the anterior tibialis muscle of a frog. Note the deviation of the experimental data from those predicted by the rectangular hyperbola in the high-force region (>0.78 maximal isometric force or P0) despite the excellent fit ((F + 0.06) × (V + 0.59) = (0.21 + 0.06) × 0.59; R2 = 0.994) (dashed line) (least squares method). In contrast, all measurement data are well-represented by a double-hyperbolic F-V equation (V=(0.21F)×0.59F+0.06(111+e154.65×(F0.82×0.17)); R2 = 0.999) (solid line) (least squares method). (B) Sigmoidal transition of the force-velocity relationship from concentric (CON) to eccentric (ECC) dynamic muscle actions (open circles). Data were obtained from Figure 7 in Edman (1988a) using specialized software (ImageJ 1.51q8, NIH, United States). This modified version represents the eccentric and concentric force-velocity relationship of a single muscle fiber from the anterior tibialis muscle of a frog. A double-hyperbolic function was fitted to the concentric data (see above) and a hyperbolic function was fitted to the eccentric data (V=0.028×(1.000F)2×1.000F+(0.384); R2 = 0.990) (least squares method). Note the drastic differences in force around the isometric force (open square) (0.90–1.20 P0) with only minimal changes in contraction velocity (1.8% of maximal unloaded shortening velocity).
FIGURE 7
FIGURE 7
Molecular mechanisms accounting for the double-hyperbolic shape of the F-V relationship. Data were obtained from Figure 4 in Piazzesi et al. (2007) using specialized software (ImageJ 1.51q8, NIH, United States). In this modified version: (A) Cross-bridge kinetics (detachment – solid line – and attachment – dashed line – rate constants) are presented as a function of velocity. (B) The number of attached motors (solid line) varies with velocity, following a nearly hyperbolic shape, while the average force per attached motor (discontinuous line) decreases below a certain velocity threshold. These events explain the deviation from the rectangular hyperbola in the high-force/low-velocity region of the force-velocity relationship (shaded area).

References

    1. Aagaard P., Simonsen E. B., Andersen J. L., Magnusson S. P., Halkjaer-Kristensen J., Dyhre-Poulsen P. (2000). Neural inhibition during maximal eccentric and concentric quadriceps contraction: effects of resistance training. J. Appl. Physiol. 89 2249–2257. 10.1152/jappl.2000.89.6.2249 - DOI - PubMed
    1. Abbott B. C., Aubert X. M. (1952). The force exerted by active striated muscle during and after change of length. J. Physiol. 117 77–86. - PMC - PubMed
    1. Abbott B. C., Lowy J. (1956). J. Physiol. 133.∗ - PubMed
    1. Abbott B. C., Wilkie D. R. (1953). The relation between velocity of shortening and the tension-length curve of skeletal muscle. J. Physiol. 120 214–223. 10.1113/jphysiol.1953.sp004886 - DOI - PMC - PubMed
    1. Ahn A. N., Monti R. J., Biewener A. A. (2003). In vivo and in vitro heterogeneity of segment length changes in the semimembranosus muscle of the toad. J. Physiol. 549(Pt 3), 877–888. 10.1113/jphysiol.2002.038018 - DOI - PMC - PubMed

LinkOut - more resources