. 2019 Jun 18:10:1311.
doi: 10.3389/fimmu.2019.01311. eCollection 2019.

Protease Activated Receptor 4 as a Novel Modulator of Regulatory T Cell Function

Affiliations

Protease Activated Receptor 4 as a Novel Modulator of Regulatory T Cell Function

Qi Peng et al. Front Immunol. .

Abstract

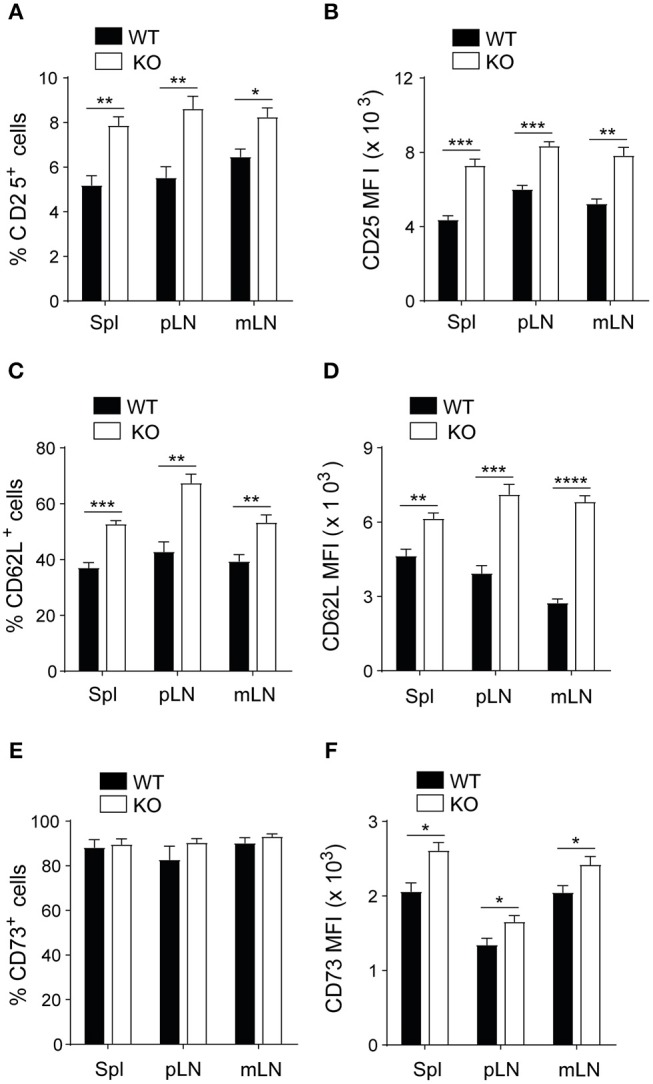
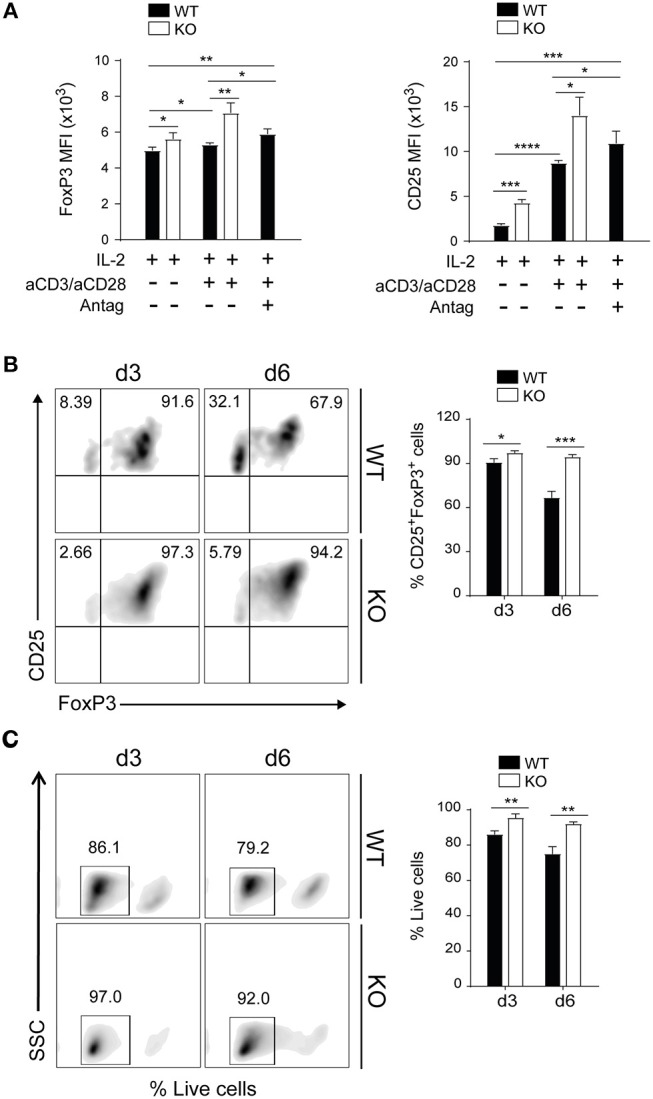
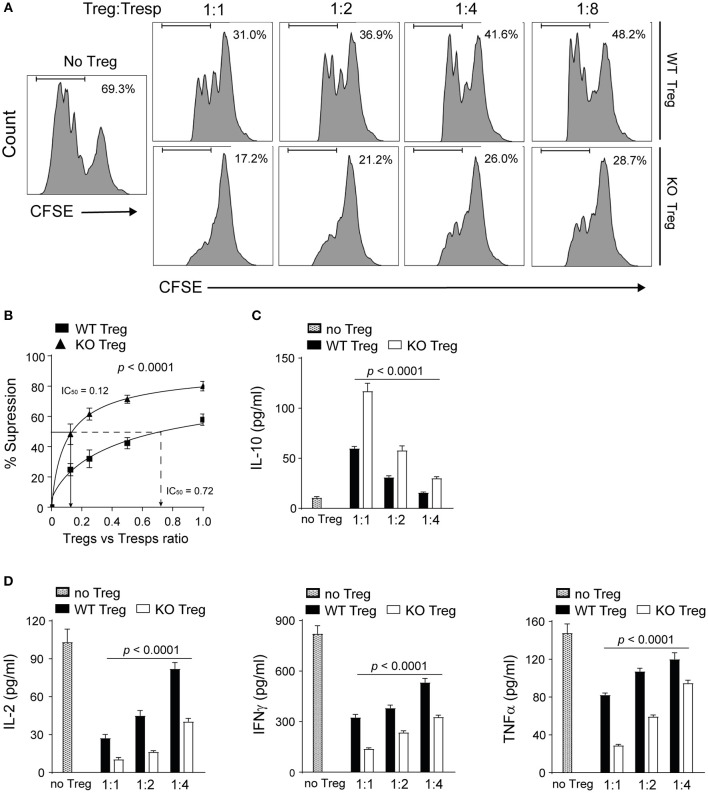
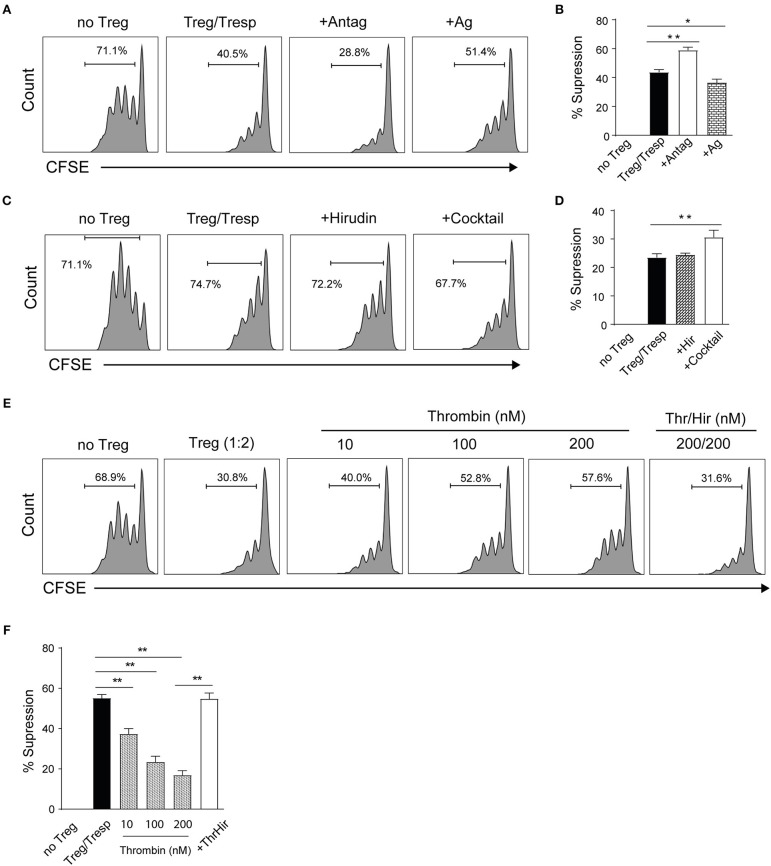
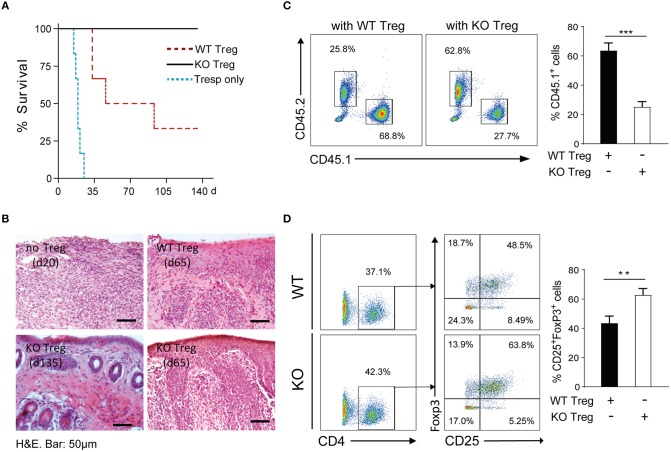
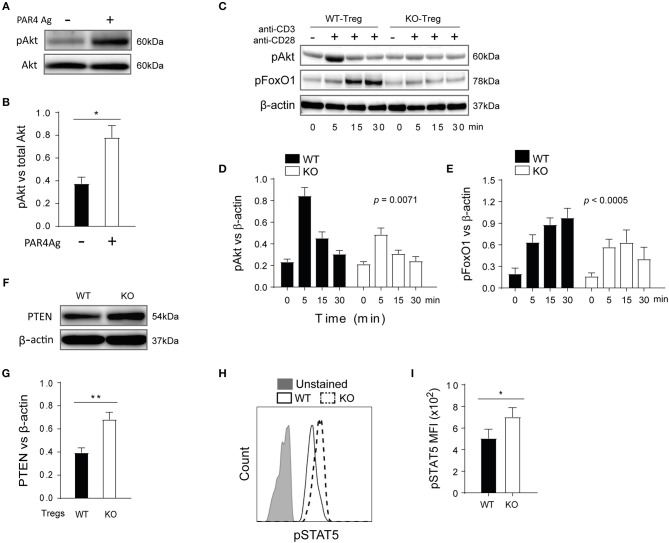
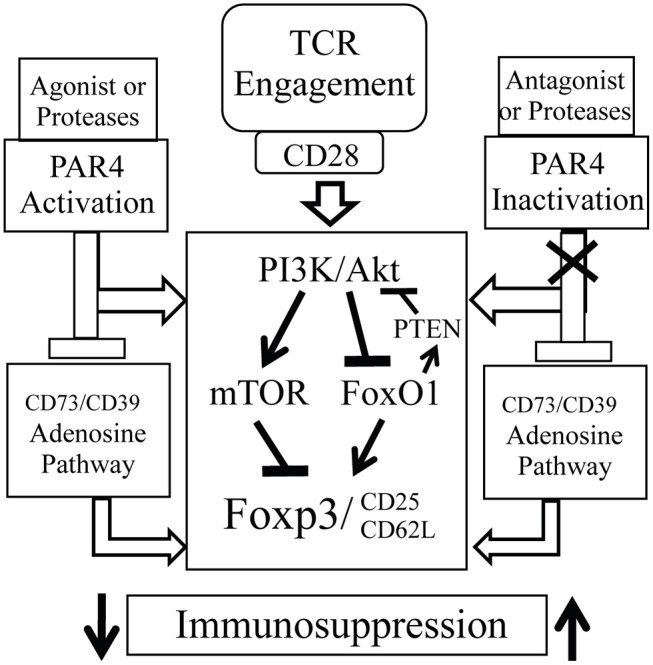
Regulatory T cells (Tregs) are a subpopulation of T cells that maintain immunological tolerance. In inflammatory responses the function of Tregs is tightly controlled by several factors including signaling through innate receptors such as Toll like receptors and anaphylatoxin receptors allowing an effective immune response to be generated. Protease-activated receptors (PARs) are another family of innate receptors expressed on multiple cell types and involved in the pathogenesis of autoimmune disorders. Whether proteases are able to directly modulate Treg function is unknown. Here, we show using two complimentary approaches that signaling through PAR-4 influences the expression of CD25, CD62L, and CD73, the suppressive capacity, and the stability of Tregs, via phosphorylation of FoxO1 and negative regulation of PTEN and FoxP3. Taken together, our results demonstrate an important role of PAR4 in tuning the function of Tregs and open the possibility of targeting PAR4 to modulate immune responses.

Keywords: PI3K/Akt signaling pathway; forkhead box protein O1 (FoxO1); immunoregulation; phosphatase and tensin homolog on chromosome 10 (PTEN); protease activated receptor 4 (PAR4); regulatory T cells (Tregs).


Figures

Figure 1
Figure 1
Tregs from PAR4ko mice express higher levels of CD25, CD62L, and CD73 molecules. Cells obtained from homogenized the spleen, peripheral lymph nodes (pLN) and mesenteric lymph nodes (mLN) of C57BL/6 WT (filled bars) and PAR4ko (open bars) mice were analyzed using flow cytometry. The percentage of CD25+ cells in the CD4+ T cells (A) and within the CD4+CD25+ T cells the percentages of CD62L and CD73 (C,E) are shown. The MFI levels for the same populations of these cells in (A,C,E) are shown in (B,D,F). Graphs represent mean ± SEM from six mice per group. Data were analyzed by unpaired two-tailed t-test. *p < 0.05, **p < 0.005, ***p < 0.0005, and ****p < 0.0001 when WT and PAR4ko Tregs were compared.
Figure 2
Figure 2
PAR4 signaling regulates stability and survival of Foxp3+ Tregs in vitro. CD4+CD25+ Tregs were freshly isolated from spleen and pLNs of WT (filled bars) and PAR4ko (open bars) mice. The Tregs were activated with anti-CD3/anti-CD28 in the presence of IL-2 for 3 days and in some cases PAR4 antagonist (Antag) was added to WT Tregs. The MFI levels of FoxP3 and CD25 expression were analyzed by flow cytometry (A). Flow cytometry assessment of FoxP3 and CD25 expression on Tregs activated by anti-CD3/anti-CD28 in presence of IL-2 for 3 and 6 days (B). Flow cytometry assessment of live Tregs activated by anti-CD3/anti-CD28 in presence of IL-2 for 3 and 6 days (C). The cells were stained with live/dead near-IR dead cell stain kit. Graphs show mean ± SEM from four experiments. Data were analyzed by unpaired two-way t-test. *p < 0.05, **p < 0.005, ***p < 0.0005, and ****p < 0.0001 in comparison between WT and PAR4ko Tregs.
Figure 3
Figure 3
Absence of PAR4 leads to the enhanced suppressive capacity of Tregs. CD4+CD25+ Tregs from WT spleen and pLN were purified and co-cultured with PAR4ko Tresps and APCs in the presence of anti-CD3 for 72 h. Representative histograms showing the CFSE dilutions of Tresps cultured alone (No Tregs) or with different numbers of WT or PAR4ko Tregs (A). Pooled data showing the percentages of suppression of WT and PAR4ko Tregs [p < 0.0001; (B)]. IC50 values representing the Treg:Tresps ratio required to achieve 50% suppression are shown for the PAR4ko (triangles) and WT (squares) Tregs. Graphs show mean ± SEM from six experiments. Data were analyzed by two-way ANOVA to compare between these two Treg groups. CBA analysis of cytokines IL-10 [p < 0.0001; (C)] and IL-2, IFNγ, and TNFα [p < 0.0001; (D)] in the supernatants obtained from six suppression assays. Graphs show mean ± SEM from four experiments. Data were analyzed by two-way ANOVA to compare between these two Treg groups with a sequential dilution.
Figure 4
Figure 4
PAR4 signaling modulates the suppressive capacity of Tregs. CD4+CD25+ Tregs from WT spleen and pLN were freshly isolated. Representative histograms (A) and pooled data (B) showing in vitro suppression of CFSE-labeled PAR4ko Tresps by WT Tregs (filled bar; in the ratio of 2 to 1) in the absence or presence of a PAR4 antagonist (Antag; open bar) or agonist (Ag; dotted bar) in 72 h suppressive assays co-cultured with PAR4ko APCs and addition of anti-CD3. Graphs show mean ± SEM from four experiments. Data were analyzed by unpaired two-way t-test. *p < 0.05 and **p < 0.01 in comparison between the Treg groups without or with PAR4 antagonist or agonist, respectively. Representative histograms (C) and pooled data (D) showing in vitro suppression of CFSE-labeled PAR4ko Tresps by WT Tregs (filled bar; in the ratio of 2 to 1) in the absence or presence of thrombin inhibitor hirudin (Hir; dotted bar) or protease inhibitor cocktail (open bar) in 72 h suppressive assays. Graphs show mean ± SEM from four experiments. Data were analyzed by unpaired two-way t-test. **p < 0.01 in comparison between the Treg groups without or with the cocktail, respectively. Representative histograms (E) and pooled data (F) showing in vitro suppression of CFSE-labeled PAR4ko Tresps by WT Tregs (in the ratio of 2 to 1) in the absence (filled bar) or presence of thrombin (Thr) in different concentrations without (dotted bars) or with Hir (open bars). Graphs show mean ± SEM from four experiments. Data were analyzed by unpaired two-way t-test. **p < 0.01 in comparison between the WT Tregs without or with thrombin.
Figure 5
Figure 5
PAR4ko Tregs promote indefinite skin allograft survival in vivo. BALB/c skin graft survival was assessed in recipients Rag2−/− mice in which CD45.1+ Tresps only (blue dotted line, n = 6) or at a ratio 2 to 1 with CD45.2+ WT (red dotted line, n = 6) or PAR4ko (black solid line, n = 6) Tregs were adoptively transferred. (A) Survival graph of skin allografts. Data were analyzed by Log-rank test. p = 0.0005, when Tresps with WT (or PAR4ko) Tregs were compared to Tresps only groups; p = 0.0179, comparison between WT and PAR4ko Treg groups. (B) Representative H&E staining of skin grafts from recipient mice receiving Tresps only (day 20) or Tresps with WT or PAR4ko Tregs (d65), or from Tresps with PAR4ko Tregs (d135). Bar, 50 μm. Flow cytometry analysis of CD45.1+ and CD45.2+ population (C) and the CD25+FoxP3+ cells in the CD4+ gated population of CD45.2+ cells (D) in the draining lymph nodes of the recipients receiving WT or PAR4ko Treg cells sacrificed at d115. Graphs show mean ± SEM from four mice per group. Data were analyzed by unpaired two-way t-test. **p < 0.01 ***p < 0.001 when WT and PAR4ko Treg groups were compared.
Figure 6
Figure 6
PTEN and Akt/FoxO1 links PAR4 signaling to regulate downstream pathways in WT Treg cells. Freshly isolated WT CD4+ CD25+ Tregs were stimulated with PAR4 agonist for 15 min. The levels of pAkt in these cells were analyzed by Western blots (A) and quantified against total Akt (B). Graph shows mean ± SEM from four experiments. Data were analyzed by unpaired two-way t-test. *p < 0.05 in comparison between WT and PAR4ko Tregs. The Tregs were also activated with anti-CD3/anti-CD28 for varied time points, and the levels of pAkt and pFoxo1 analyzed in western blots (C) and quantified against beta-actin [(D,E), respectively]. Graphs show mean ± SEM from four experiments. Data were analyzed by two-way ANOVA. P = 0.0071 and p < 0.0005, compared between WT and PAR4ko Tregs. The level of total PTEN in the Treg cells from WT and PAR4ko mice was analyzed in Western blots (F) and quantified against beta-actin (G). Graph shows mean ± SEM from four experiments. Data were analyzed by unpaired two-way t-test. **p < 0.001 in comparison between WT and PAR4ko Tregs. The Tregs were also activated with IL-2 for 30 min and then the MFI levels of pSTAT5 were analyzed by flow cytometry (H) and the cumulative data (I). Graph shows mean ± SEM from three experiments. Data were analyzed by unpaired two-way t-test. *p < 0.05 in comparison between WT and PAR4ko Tregs.
Figure 7
Figure 7
Possible underlying mechanism of PAR4 signaling. PAR4 activation may directly activate PI3K/AKT pathway, which then upregulates the activity of the downstream effector mTOR and downregulates the activities of Foxo1 and PTEN, and subsequently controls the expression of Foxp3, CD25, and CD62L. However, accumulation of excessive proteases at the sites of inflammation may overregulate PAR4 signaling on various cell types including Tregs, which then reduces function, stability, and mobility of Tregs. Moreover, PAR4 activation may also negatively control adenosine pathway. Once removing PAR4 signaling, the negative regulator, these Tregs possess “super” capacity with a Foxp3high CD25high CD62Lhigh phenotype and are able to induce immune tolerance.

References

    1. Libby P, Ridker PM, Hansson GK. Progress and challenges in translating the biology of atherosclerosis. Nature. (2011) 473:317–25. 10.1038/nature10146 - DOI - PubMed
    1. Itoh M, Takahashi T, Sakaguchi N, Kuniyasu Y, Shimizu J, Otsuka F, et al. . Thymus and autoimmunity: production of CD25+CD4+ naturally anergic and suppressive T cells as a key function of the thymus in maintaining immunologic self-tolerance. J Immunol. (1999) 162:5317–26. - PubMed
    1. Takahashi T, Kuniyasu Y, Toda M, Sakaguchi N, Itoh M, Iwata M, et al. . Immunologic self-tolerance maintained by CD25+CD4+ naturally anergic and suppressive T cells: induction of autoimmune disease by breaking their anergic/suppressive state. Int Immunol. (1998) 10:1969–80. 10.1093/intimm/10.12.1969 - DOI - PubMed
    1. Joffre O, Santolaria T, Calise D, Al Saati T, Hudrisier D, Romagnoli P, et al. . Prevention of acute and chronic allograft rejection with CD4+CD25+Foxp3+ regulatory T lymphocytes. Nat Med. (2008) 14:88–92. 10.1038/nm1688 - DOI - PMC - PubMed
    1. Yamaguchi T, Hirota K, Nagahama K, Ohkawa K, Takahashi T, Nomura T, et al. . Control of immune responses by antigen-specific regulatory T cells expressing the folate receptor. Immunity. (2007) 27:145–59. 10.1016/j.immuni.2007.04.017 - DOI - PubMed

Publication types

Substances