. 2019 Jun 18:10:1338.
doi: 10.3389/fimmu.2019.01338. eCollection 2019.

A Modular Cytokine Analysis Method Reveals Novel Associations With Clinical Phenotypes and Identifies Sets of Co-signaling Cytokines Across Influenza Natural Infection Cohorts and Healthy Controls

Affiliations

A Modular Cytokine Analysis Method Reveals Novel Associations With Clinical Phenotypes and Identifies Sets of Co-signaling Cytokines Across Influenza Natural Infection Cohorts and Healthy Controls

Liel Cohen et al. Front Immunol. .

Abstract

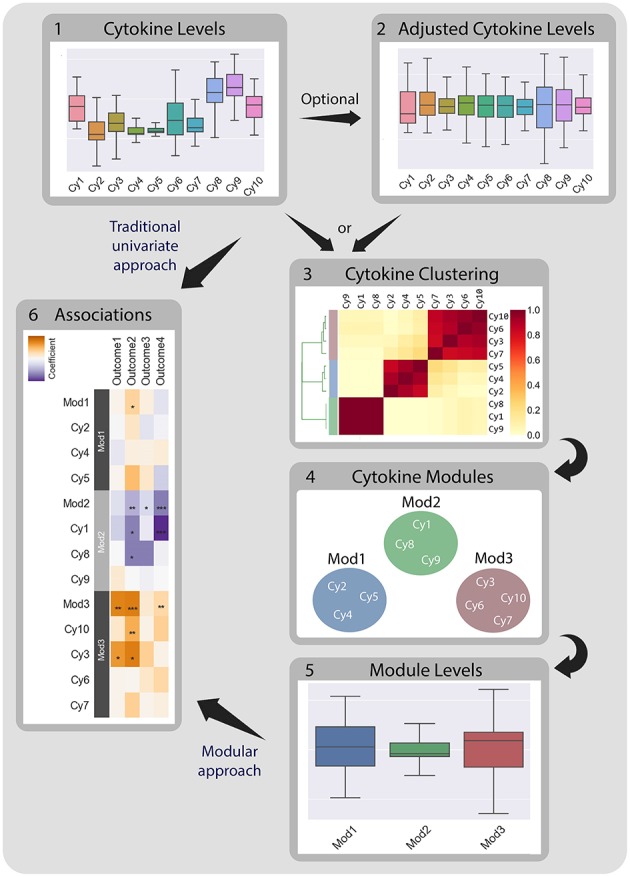
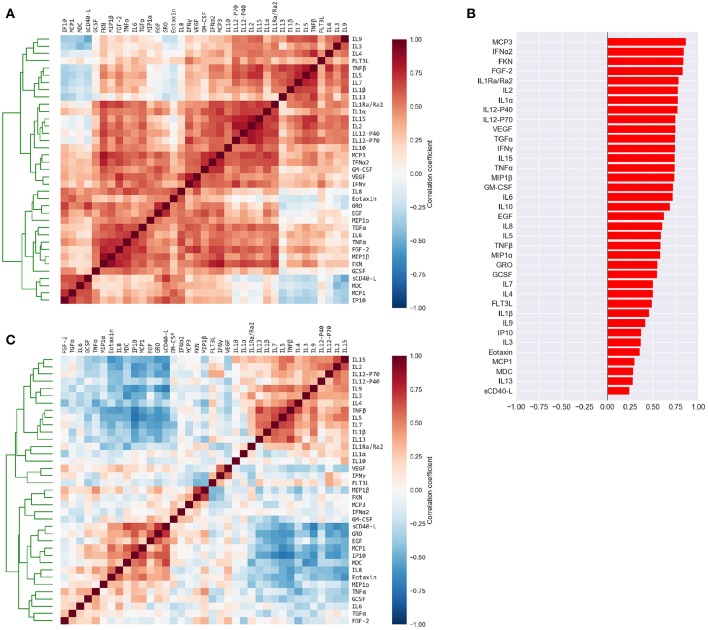
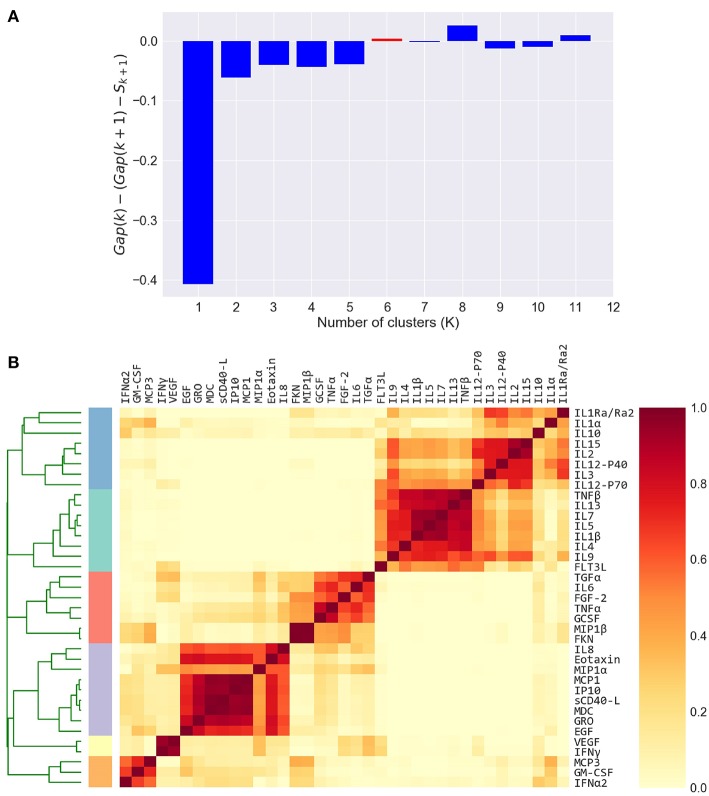
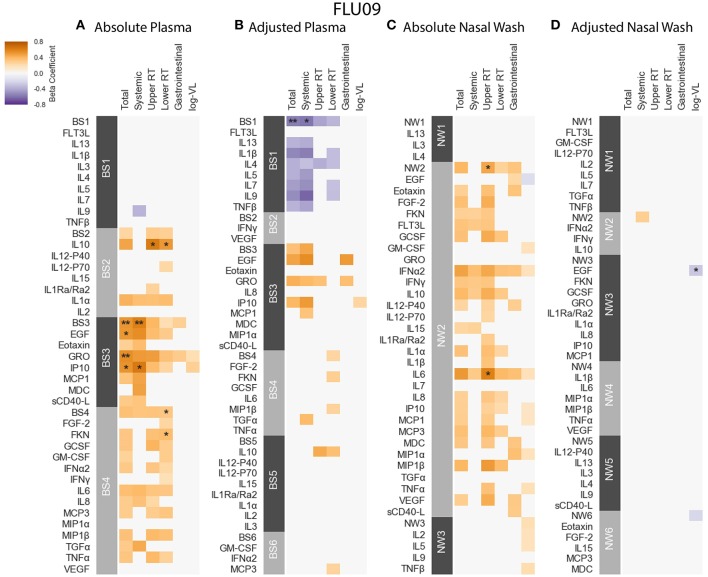
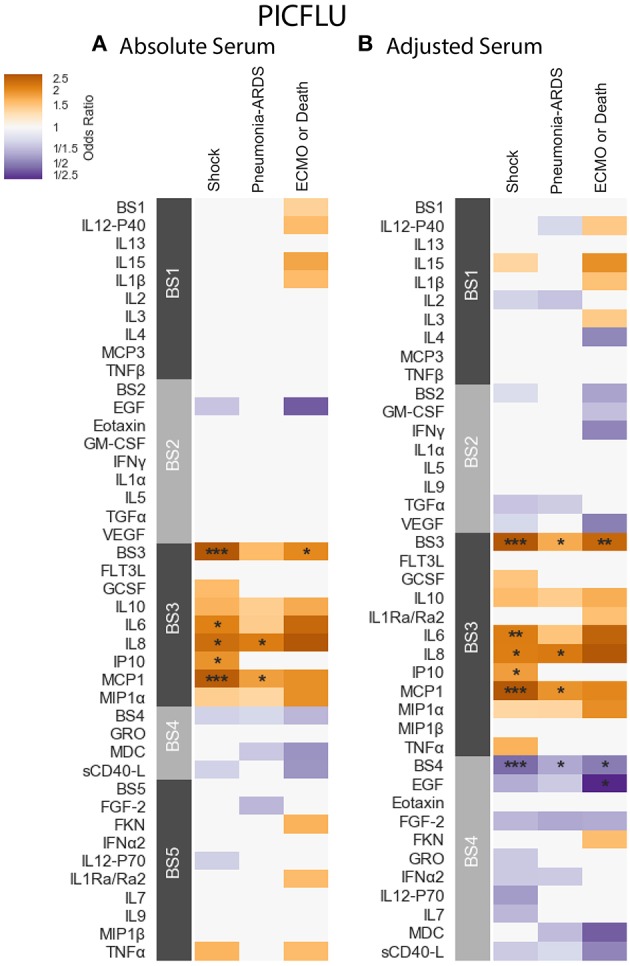
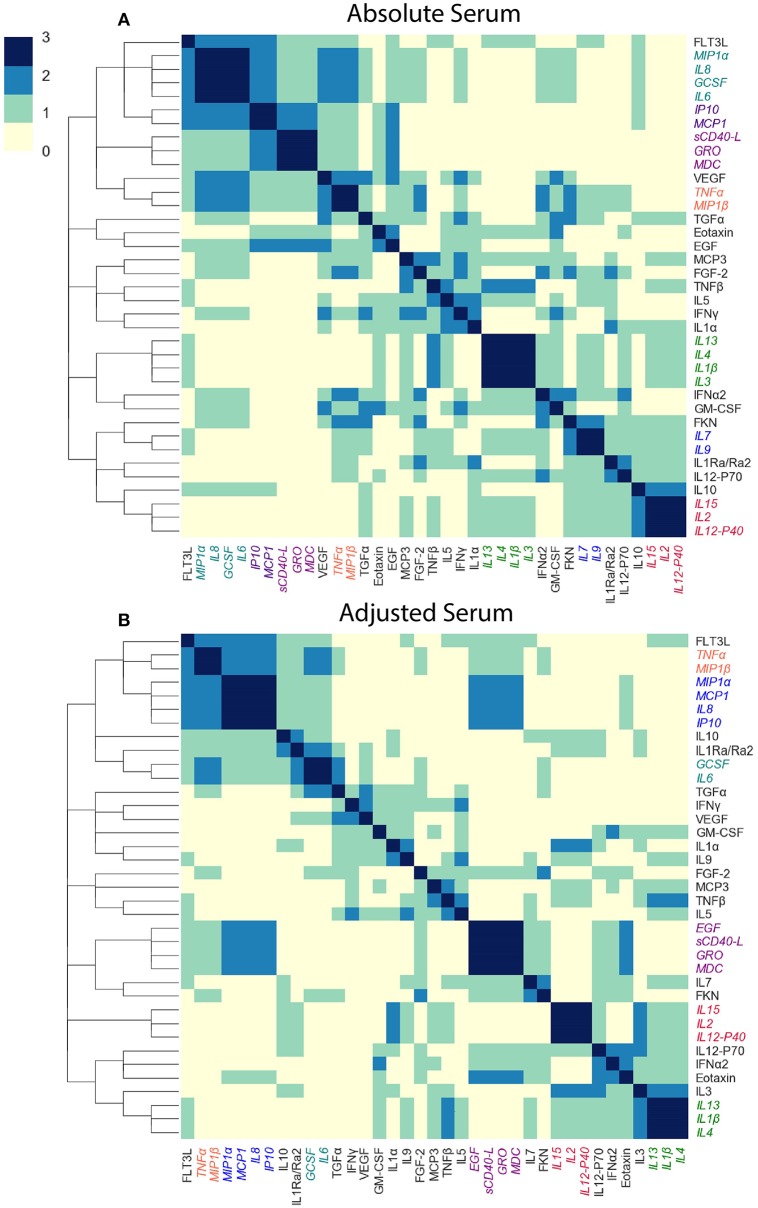
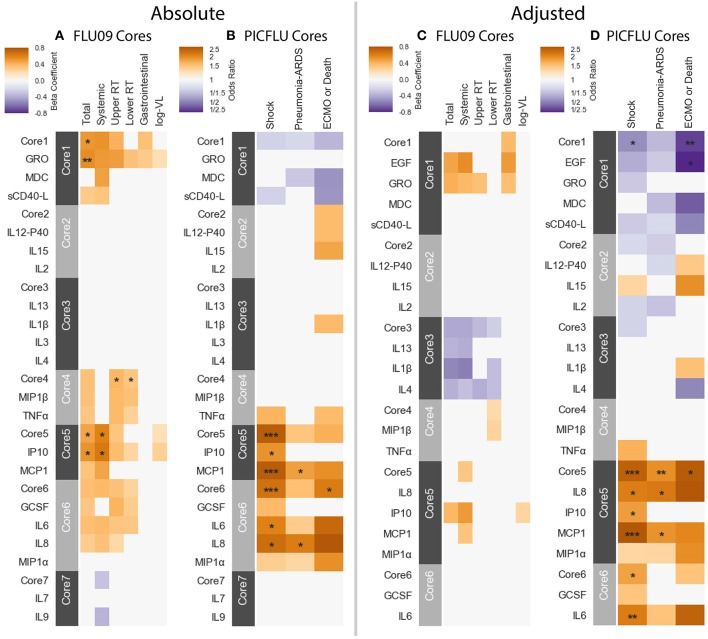
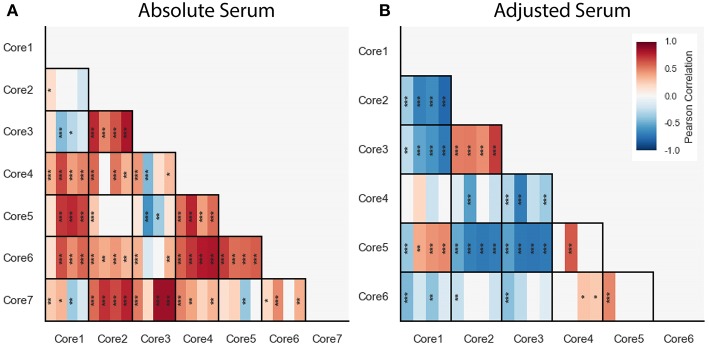
Cytokines and chemokines are key signaling molecules of the immune system. Recent technological advances enable measurement of multiplexed cytokine profiles in biological samples. These profiles can then be used to identify potential biomarkers of a variety of clinical phenotypes. However, testing for such associations for each cytokine separately ignores the highly context-dependent covariation in cytokine secretion and decreases statistical power to detect associations due to multiple hypothesis testing. Here we present CytoMod-a novel data-driven approach for analysis of cytokine profiles that uses unsupervised clustering and regression to identify putative functional modules of co-signaling cytokines. Each module represents a biosignature of co-signaling cytokines. We applied this approach to three independent clinical cohorts of subjects naturally infected with influenza in which cytokine profiles and clinical phenotypes were collected. We found that in two out of three cohorts, cytokine modules were significantly associated with clinical phenotypes, and in many cases these associations were stronger than the associations of the individual cytokines within them. By comparing cytokine modules across datasets, we identified cytokine "cores"-specific subsets of co-expressed cytokines that clustered together across the three cohorts. Cytokine cores were also associated with clinical phenotypes. Interestingly, most of these cores were also co-expressed in a cohort of healthy controls, suggesting that in part, patterns of cytokine co-signaling may be generalizable. CytoMod can be readily applied to any cytokine profile dataset regardless of measurement technology, increases the statistical power to detect associations with clinical phenotypes and may help shed light on the complex co-signaling networks of cytokines in both health and infection.

Keywords: biomarker; chemokines; cytokines; influenza; innate immunology.


Figures

Figure 1
Figure 1
CytoMod—a modular data driven approach to identify cytokine modules and assess their associations with clinical phenotypes. Traditionally, associations between cytokine data (1) and clinical phenotypes (5) are tested directly using univariate models. CytoMod independently uses absolute cytokine profiles (1) or adjusted cytokine profiles (2) to generate cytokine modules (3)-sets of co-signaling cytokines within a given cohort. Modules are generated using unsupervised hierarchical clustering. Associations are then tested between module levels (4) and clinical phenotypes (5). By significantly reducing the number of associations tested CytoMod increases the statistical power to detect associations. By comparing modules across datasets, CytoMod can also identify “cores” of cytokines that consistently co-signal together.
Figure 2
Figure 2
Cytokine levels are highly correlated to each other and to the mean cytokine level of each subject. (A) Pairwise Pearson's correlations among the absolute plasma cytokine levels in the FLU09 cohort. Cytokines were sorted along both axes using hierarchical clustering (complete-linkage). (B) Correlations between cytokine levels and mean cytokine levels for each subject. (C) Pairwise Pearson's correlations between cytokines following adjustment to the mean cytokine level (see Methods for details). Cytokines were sorted along both axes using complete-linkage.
Figure 3
Figure 3
Defining cytokine modules on the FLU09 adjusted plasma cytokine profiles. (A) Automated selection of the optimal number of modules. The Tibshirani gap statistic is used to automatically determine the optimal number of modules. The cytokine profiles are clustered into K = 1−11 clusters and the optimal K is selected. The plot shows the δ gap statistic, defined as Gap(K) − (Gap(K + 1) − Sk + 1) for K = 1−11. The optimal number of modules (K=6) is selected by identifying the first value of K for which this measure is positive, while also constraining it to vary between 2 and 6. (B) Heatmap of cytokine modules - Complete linkage clustering over the Pearson pairwise correlation similarity measure is used to cluster cytokines into K modules, where K is decided using the gap statistic. A clustering reliability score is computed over 1, 000 samplings of subjects that are sampled with replacement. The score for each pair of cytokines represents the fraction of times they clustered together across 1, 000 random samples. The reliability score of K = 6 is presented here. The final modules are then constructed by clustering the pairwise reliability scores, and are represented by the colored stripes below the clustering dendrogram.
Figure 4
Figure 4
FLU09 cytokine associations with clinical phenotypes. Associations were identified using linear regression controlling for patients age using both absolute and adjusted plasma samples (A,B), and absolute and adjusted nasal wash samples (C,D). Modules of covarying cytokines were constructed separately for absolute and adjusted cytokine measurements from plasma or nasal wash samples. We then tested associations with several clincal phenotypes described in section 2.1: upper respiratory tract (URT) symptoms, lower respiratory tract (LRT) symptoms, systemic symptoms, gastrointestinal symptoms and log viral load (VL). Each cytokine or module is indicated along the rows, grouped by their assigned module. Heatmap color indicates the direction and magnitude of the regression coefficient between cytokine or module level with a given clinical phenotype. Only associations with false-discovery rate (FDR)-adjusted q-value ≤ 0.2 are colored. Asterisks indicate family-wise error rate (FWER)-adjusted p-values with ***, **, and * indicating p ≤ 0.0005, 0.005, and 0.05, respectively.
Figure 5
Figure 5
PICFLU serum cytokine associations with clinical phenotypes identified using logistic regression while controlling for patients age and bacterial coinfection. Modules constructed of covarying cytokines [absolute (A) and adjusted (B) measurements separately] from serum samples, were tested for associations with the clinical phenotypes described in section 2.1: shock, pneumonia-ARDS and ECMO or death. Each cytokine or module is indicated along the rows, grouped by their assigned module. Heatmap color indicates the direction and magnitude of the regression coefficient between cytokine or module level with a given clinical phenotype with and without the complication. Only associations with false-discovery rate (FDR)-adjusted q ≤ 0.2 are colored. Asterisks indicate family-wise error rate (FWER)-adjusted p-values with ***, **, and * indicating p ≤ 0.0005, 0.005, and 0.05, respectively.
Figure 6
Figure 6
Defining cytokine cores. By leveraging information across cytokine profile datasets, we can identify cytokine cores—subsets of cytokines that consistently co-signal across all three blood datasets used in this study. Heatmaps of the number of times each pair of cytokines clustered together in all three cohorts, for adjusted (A) and absolute (B) blood sample data independently. Cytokine names are colored by cytokine cores.
Figure 7
Figure 7
Cores constructed from groups of covarying cytokines (absolute and adjusted measurements separately) as detailed in section 3.5. Associations between cytokine cores and clinical phenotypes are shown for FLU09 (A,C) and PICFLU (B,D) for both raw and adjusted cytokine levels. Blood cytokine cores associations with phenotypes were estimated using regression while also controlling for other variables as described in section 3.3. Each cytokine or core is indicated along the rows. Heatmap color indicates the direction and magnitude of the regression coefficient. For each individual cytokine FDR and FWER adjustments are shown are controlled over all 37 cytokines. Only associations with false-discovery rate (FDR)-adjusted q ≤ 0.2 are colored. Asterisks indicate family-wise error rate (FWER)-adjusted p-values with ***, **, and * indicating p ≤ 0.0005, 0.005, and 0.05, respectively.
Figure 8
Figure 8
Pairwise Pearson correlations between absolute (A) and adjusted (B) blood cytokine cores within each dataset, presented with vertical stripes from left to right: PICFLU, SHIVERS, FLU09, and FLU09-healthy. Heatmap color indicates the correlation coefficient. P-values for the coefficients were adjusted for multiple hypothesis tests within each dataset separately. Only associations with false-discovery rate (FDR)-adjusted q ≤ 0.2 are colored. Asterisks indicate family-wise error rate (FWER)-adjusted p-values with ***, **, and * indicating p ≤ 0.0005, 0.005, and 0.05, respectively.

References

    1. Miller MD, Krangel MS. Biology and biochemistry of the chemokines: a family of chemotactic and inflammatory cytokines. Crit Rev Immunol. (1992) 12:17–46. - PubMed
    1. Kishimoto T, Taga T, Akira S. Cytokine signal transduction. Cell. (1994) 76:253–62. 10.1016/0092-8674(94)90333-6 - DOI - PubMed
    1. Bidwell J, Keen L, Gallagher G, Kimberly R, Huizinga T, McDermott M, et al. . Cytokine gene polymorphism in human disease: on-line databases. Genes Immunity. (1999) 1:3. 10.1038/sj.gene.6363645 - DOI - PubMed
    1. Crosby LM, Waters CM. Epithelial repair mechanisms in the lung. Am J Physiol Lung Cell Mol Physiol. (2010) 298:L715–31. 10.1152/ajplung.00361.2009 - DOI - PMC - PubMed
    1. Goldberg RB. Cytokine and cytokine-like inflammation markers, endothelial dysfunction, and imbalanced coagulation in development of diabetes and its complications. J Clin Endocrinol Metab. (2009) 94:3171–82. 10.1210/jc.2008-2534 - DOI - PubMed

Publication types

MeSH terms