

Pan-cancer repository of validated natural and cryptic mRNA splicing mutations
- PMID: 31275557
- PMCID: PMC6544075
- DOI: 10.12688/f1000research.17204.3
Pan-cancer repository of validated natural and cryptic mRNA splicing mutations
Abstract
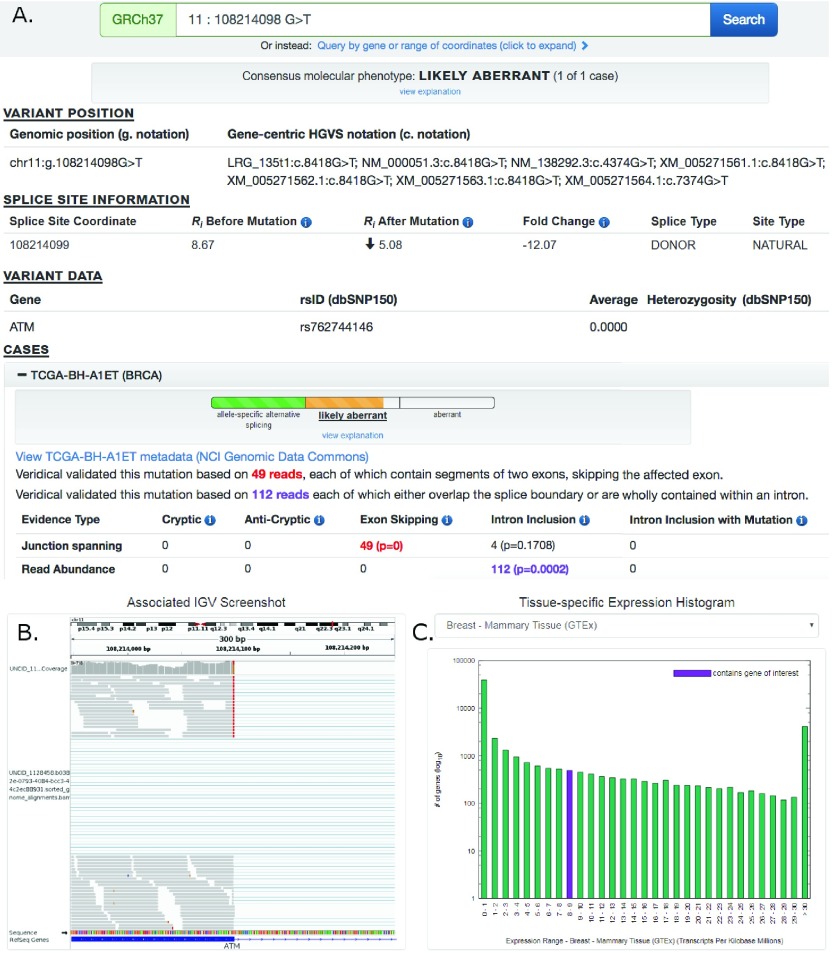
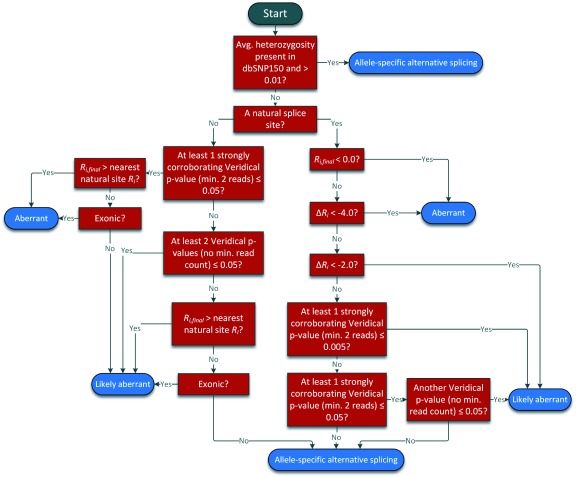
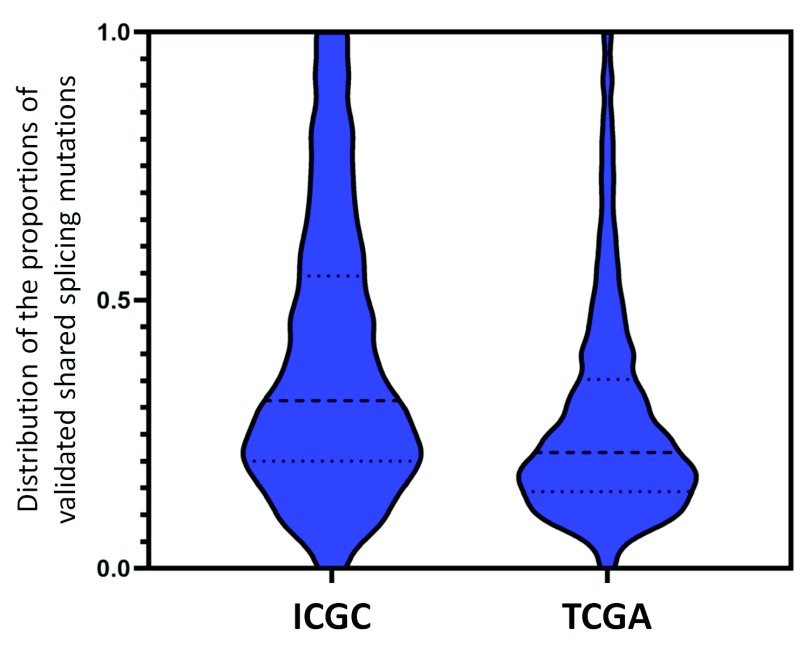
We present a major public resource of mRNA splicing mutations validated according to multiple lines of evidence of abnormal gene expression. Likely mutations present in all tumor types reported in the Cancer Genome Atlas (TCGA) and the International Cancer Genome Consortium (ICGC) were identified based on the comparative strengths of splice sites in tumor versus normal genomes, and then validated by respectively comparing counts of splice junction spanning and abundance of transcript reads in RNA-Seq data from matched tissues and tumors lacking these mutations. The comprehensive resource features 341,486 of these validated mutations, the majority of which (69.9%) are not present in the Single Nucleotide Polymorphism Database (dbSNP 150). There are 131,347 unique mutations which weaken or abolish natural splice sites, and 222,071 mutations which strengthen cryptic splice sites (11,932 affect both simultaneously). 28,812 novel or rare flagged variants (with <1% population frequency in dbSNP) were observed in multiple tumor tissue types. An algorithm was developed to classify variants into splicing molecular phenotypes that integrates germline heterozygosity, degree of information change and impact on expression. The classification thresholds were calibrated against the ClinVar clinical database phenotypic assignments. Variants are partitioned into allele-specific alternative splicing, likely aberrant and aberrant splicing phenotypes. Single variants or chromosome ranges can be queried using a Global Alliance for Genomics and Health (GA4GH)-compliant, web-based Beacon "Validated Splicing Mutations" either separately or in aggregate alongside other Beacons through the public Beacon Network, as well as through our website. The website provides additional information, such as a visual representation of supporting RNAseq results, gene expression in the corresponding normal tissues, and splicing molecular phenotypes.
Keywords: Chromosomes; Genome; Information Theory; Mutation; Neoplasms; Next Generation Sequencing; RNA Splice Sites; Single Nucleotide Polymorphism; Validation.
Conflict of interest statement
Competing interests: PKR cofounded and BCS is an employee of CytoGnomix Inc., which hosts the interactive webpage described in this study. CytoGnomix markets subscriptions to and services based on the software that generated the ValidSpliceMut database. EJM has no conflict of interest.
Figures
Similar articles
-
Expression Changes Confirm Genomic Variants Predicted to Result in Allele-Specific, Alternative mRNA Splicing.Front Genet. 2020 Mar 5;11:109. doi: 10.3389/fgene.2020.00109. eCollection 2020. Front Genet. 2020. PMID: 32211018 Free PMC article.
-
Comprehensive prediction of mRNA splicing effects of BRCA1 and BRCA2 variants.Hum Mutat. 2011 Jul;32(7):735-42. doi: 10.1002/humu.21513. Epub 2011 May 5. Hum Mutat. 2011. PMID: 21523855
-
Comprehensive profiling of cancer neoantigens from aberrant RNA splicing.J Immunother Cancer. 2024 May 15;12(5):e008988. doi: 10.1136/jitc-2024-008988. J Immunother Cancer. 2024. PMID: 38754917 Free PMC article.
-
Cancer-Associated Perturbations in Alternative Pre-messenger RNA Splicing.Cancer Treat Res. 2013;158:41-94. doi: 10.1007/978-3-642-31659-3_3. Cancer Treat Res. 2013. PMID: 24222354 Review.
-
Interpretation of mRNA splicing mutations in genetic disease: review of the literature and guidelines for information-theoretical analysis.F1000Res. 2014 Nov 18;3:282. doi: 10.12688/f1000research.5654.1. eCollection 2014. F1000Res. 2014. PMID: 25717368 Free PMC article. Review.
Cited by
-
Collaborative, Multidisciplinary Evaluation of Cancer Variants Through Virtual Molecular Tumor Boards Informs Local Clinical Practices.JCO Clin Cancer Inform. 2020 Jul;4:602-613. doi: 10.1200/CCI.19.00169. JCO Clin Cancer Inform. 2020. PMID: 32644817 Free PMC article. Review.
-
Discovery of circular transcripts of the human BCL2-like 12 (BCL2L12) apoptosis-related gene, using targeted nanopore sequencing, provides new insights into circular RNA biology.Funct Integr Genomics. 2025 Mar 19;25(1):66. doi: 10.1007/s10142-025-01578-1. Funct Integr Genomics. 2025. PMID: 40106061 Free PMC article.
-
Integrated analysis of genomic and transcriptomic data for the discovery of splice-associated variants in cancer.Nat Commun. 2023 Mar 22;14(1):1589. doi: 10.1038/s41467-023-37266-6. Nat Commun. 2023. PMID: 36949070 Free PMC article.
-
Massive computational identification of somatic variants in exonic splicing enhancers using The Cancer Genome Atlas.Cancer Med. 2019 Dec;8(17):7372-7384. doi: 10.1002/cam4.2619. Epub 2019 Oct 21. Cancer Med. 2019. PMID: 31631560 Free PMC article.
-
Expression Changes Confirm Genomic Variants Predicted to Result in Allele-Specific, Alternative mRNA Splicing.Front Genet. 2020 Mar 5;11:109. doi: 10.3389/fgene.2020.00109. eCollection 2020. Front Genet. 2020. PMID: 32211018 Free PMC article.
References
-
- Richards S, Aziz N, Bale S, et al. : Standards and guidelines for the interpretation of sequence variants: a joint consensus recommendation of the American College of Medical Genetics and Genomics and the Association for Molecular Pathology. Genet Med. 2015;17(5):405–424. 10.1038/gim.2015.30 - DOI - PMC - PubMed
Publication types
MeSH terms
Substances
LinkOut - more resources
Full Text Sources