

Pulsed Terahertz Reflection Imaging of tumors in a spontaneous model of breast cancer
- PMID: 31275612
- PMCID: PMC6605103
- DOI: 10.1088/2057-1976/aae699
Pulsed Terahertz Reflection Imaging of tumors in a spontaneous model of breast cancer
Abstract
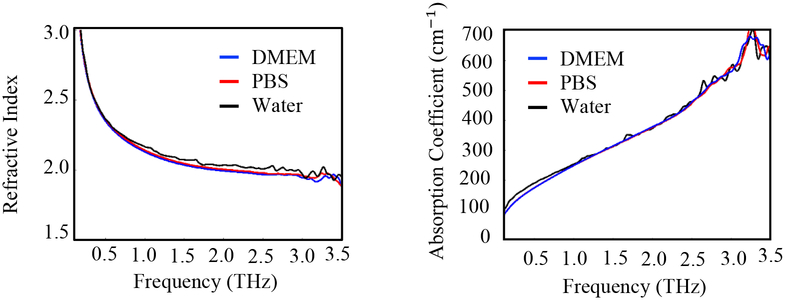
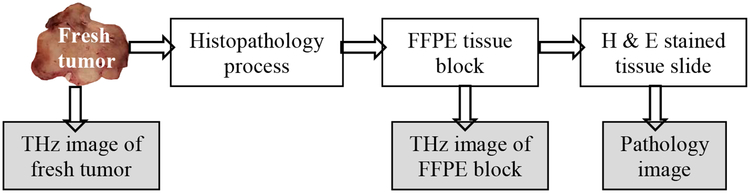
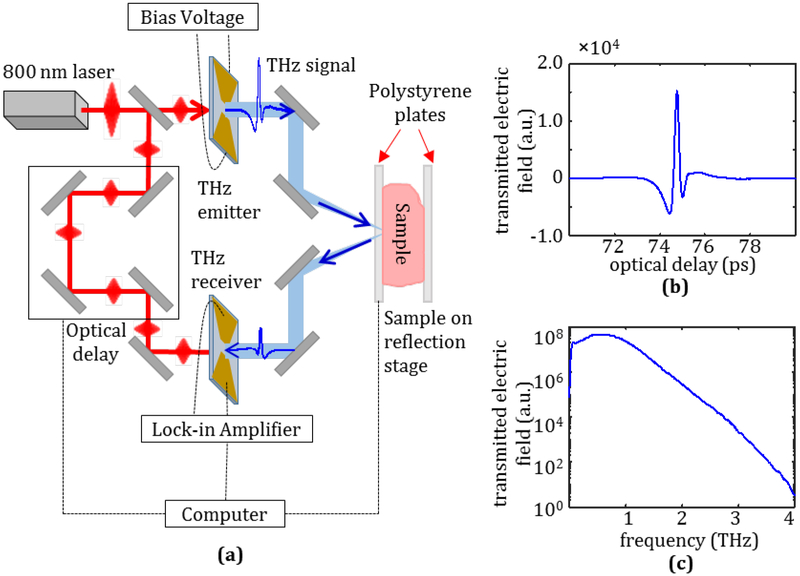
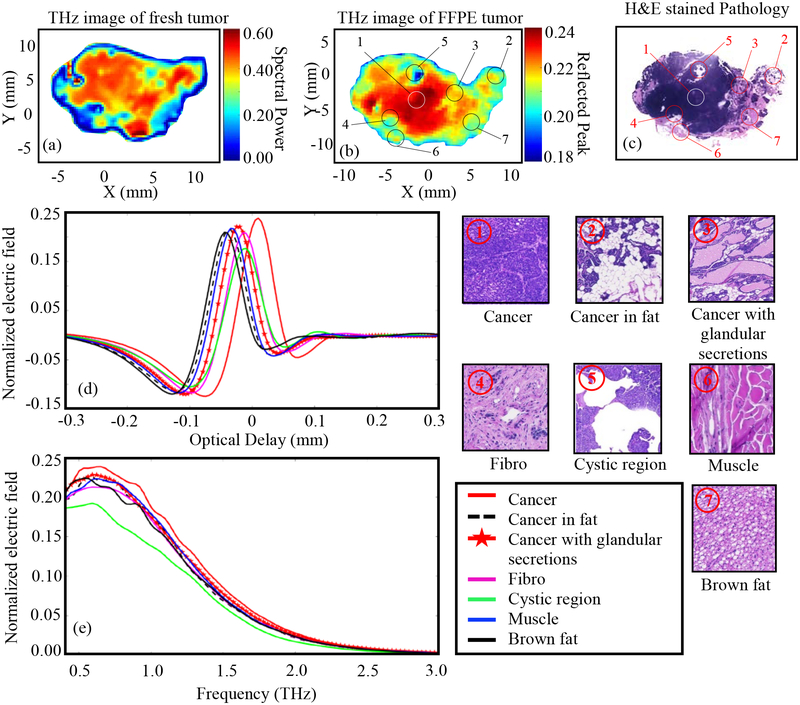
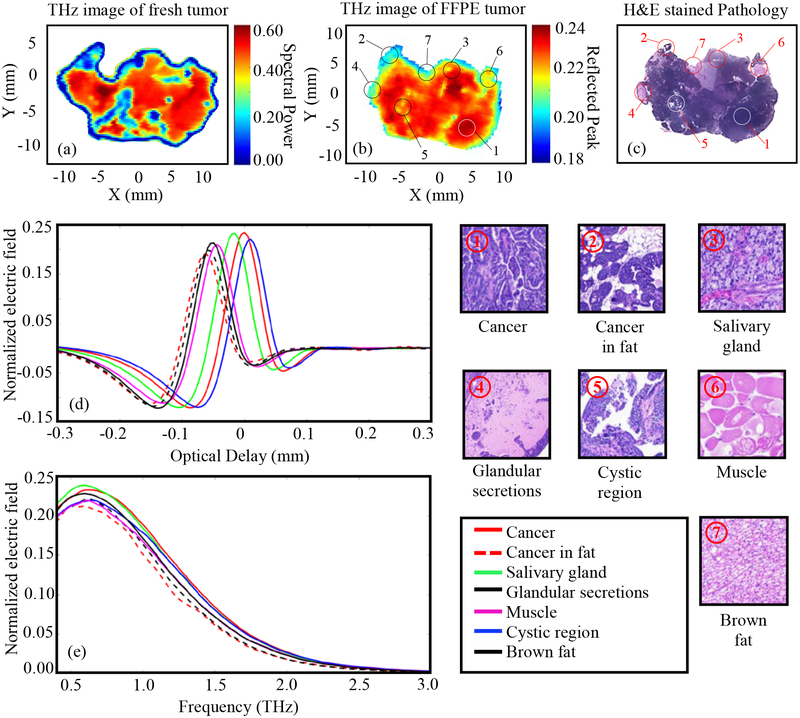
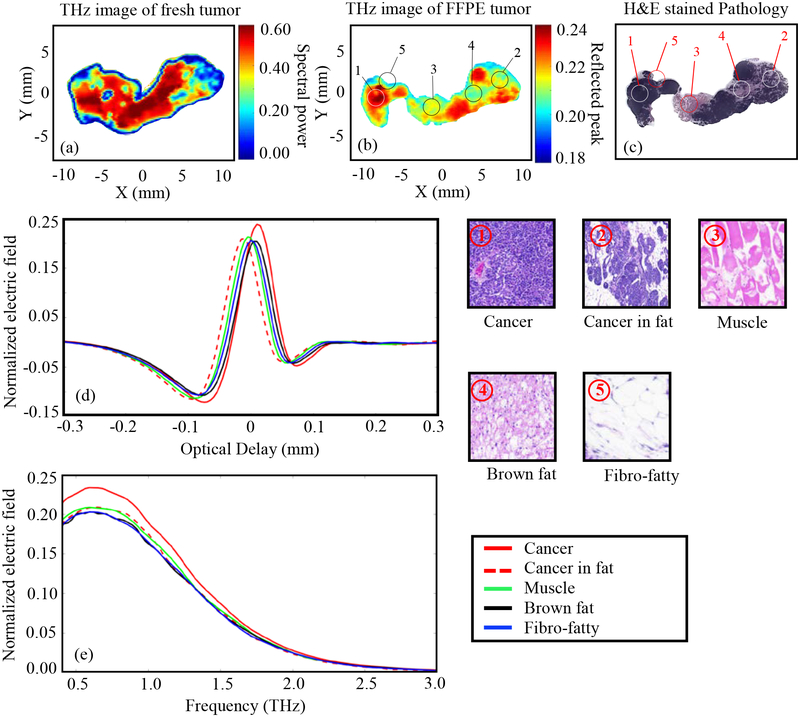
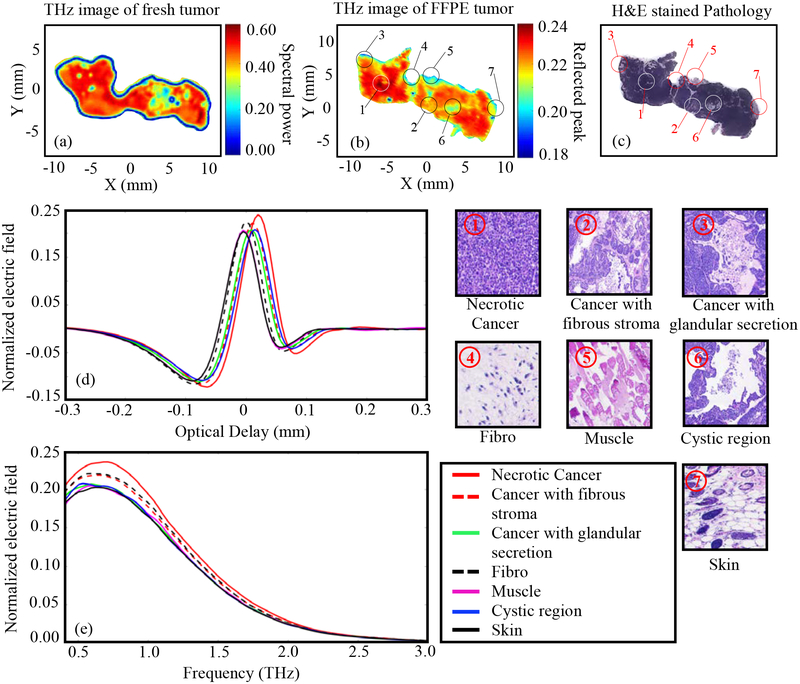
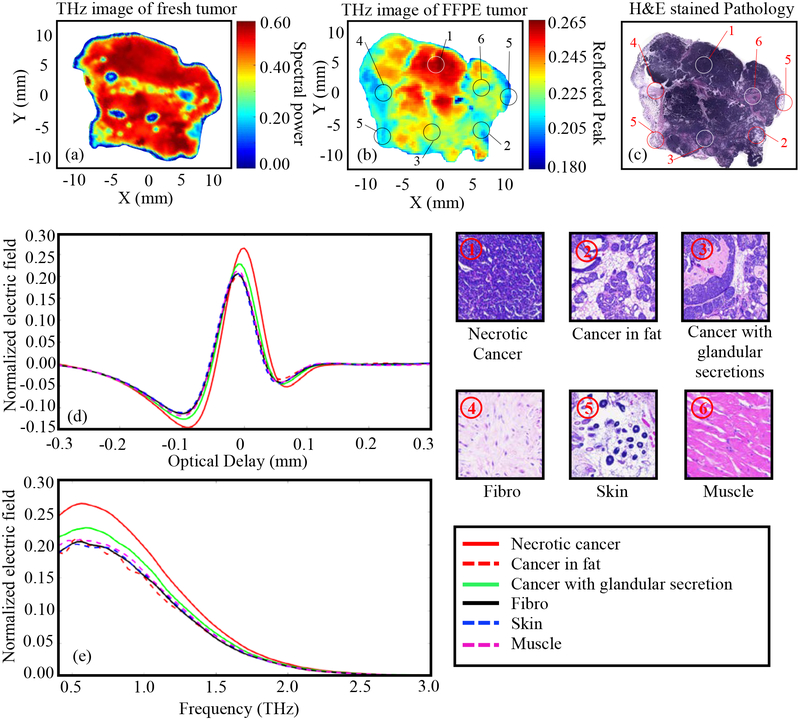
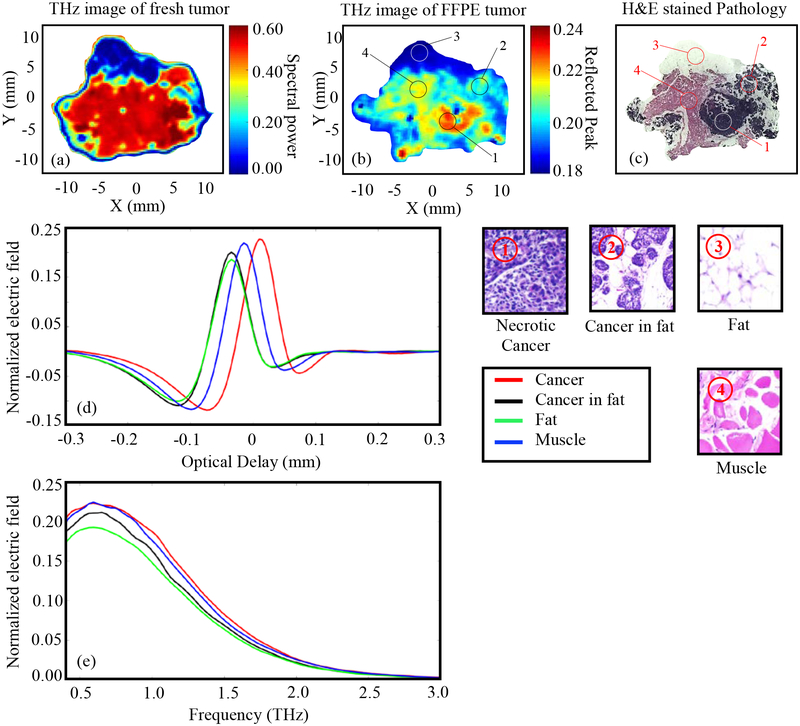
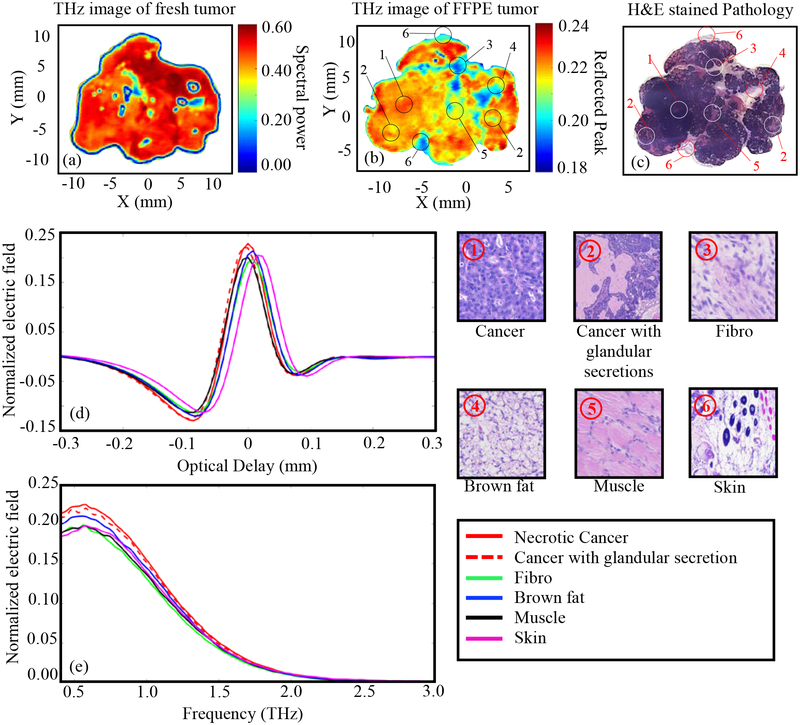
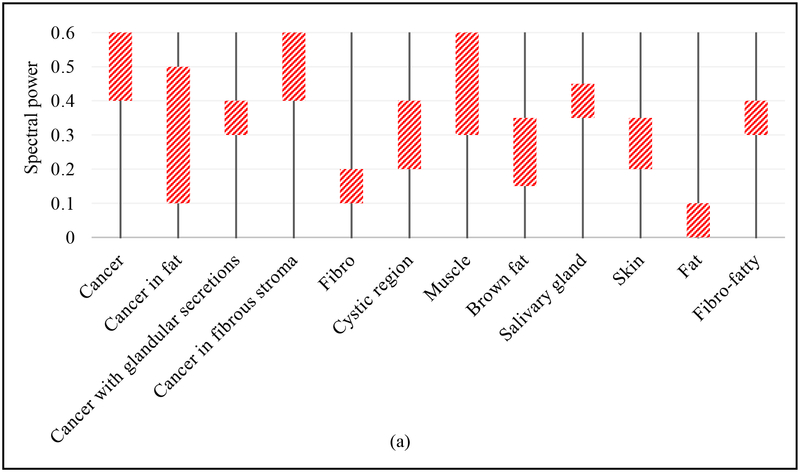
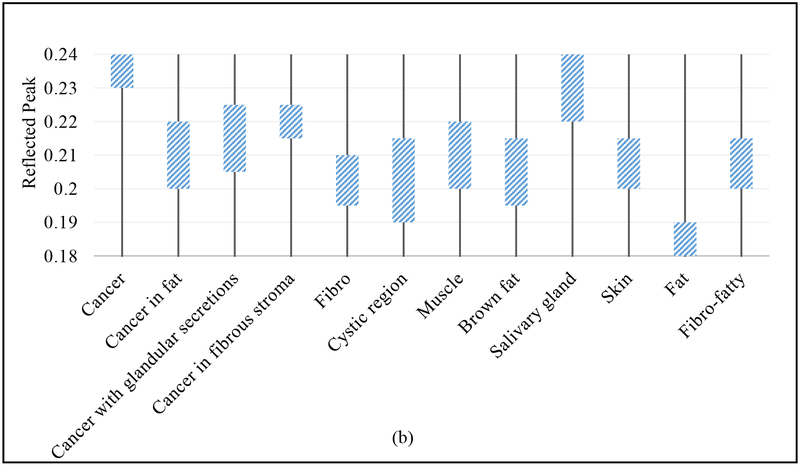
We report the use of reflection-mode terahertz (THz) imaging in a transgenic mouse model of breast cancer. Unlike tumor xenografts that are grown from established cell lines, these tumors were spontaneously generated in the mammary fat pad of mice, and are a better representation of human breast cancer. THz imaging results from 7 tumors that recapitulate the compartmental complexity of breast cancer are presented here. Imaging was first performed on freshly excised tumors within an hour of excision and then repeated after fixation with formalin and paraffin. These THz images were then compared with histopathology to determine reflection-mode signals from specific regions within tumor. Our results demonstrate that the THz signal was consistently higher in cancerous tissue compared with fat, muscle, and fibrous tissue. Almost all tumors presented in this work demonstrated advanced stages where cancer infiltrated other tissues like fat and fibrous stroma. As the first known THz investigation in a transgenic model, these results hold promise for THz imaging at different stages of breast cancer.
Keywords: Terahertz imaging; breast cancer; pathology; reflection mode; transgenic.
Figures
Similar articles
-
Pulsed terahertz imaging of breast cancer in freshly excised murine tumors.J Biomed Opt. 2018 Feb;23(2):1-13. doi: 10.1117/1.JBO.23.2.026004. J Biomed Opt. 2018. PMID: 29446263 Free PMC article.
-
Assessment of Terahertz Imaging for Excised Breast Cancer Tumors with Image Morphing.J Infrared Millim Terahertz Waves. 2018 Dec;39(12):1283-1302. doi: 10.1007/s10762-018-0529-8. Epub 2018 Aug 9. J Infrared Millim Terahertz Waves. 2018. PMID: 30984302 Free PMC article.
-
Mammary tumors in Sprague Dawley rats induced by N-ethyl-N-nitrosourea for evaluating terahertz imaging of breast cancer.J Med Imaging (Bellingham). 2021 Mar;8(2):023504. doi: 10.1117/1.JMI.8.2.023504. Epub 2021 Apr 26. J Med Imaging (Bellingham). 2021. PMID: 33928181 Free PMC article.
-
Terahertz Imaging for Breast Cancer Detection.Sensors (Basel). 2021 Sep 28;21(19):6465. doi: 10.3390/s21196465. Sensors (Basel). 2021. PMID: 34640784 Free PMC article. Review.
-
Terahertz radiation and the skin: a review.J Biomed Opt. 2021 Feb;26(4):043005. doi: 10.1117/1.JBO.26.4.043005. J Biomed Opt. 2021. PMID: 33583155 Free PMC article. Review.
Cited by
-
Cancer detection in excised breast tumors using terahertz imaging and spectroscopy.Biomed Spectrosc Imaging. 2019;8(1-2):1-9. doi: 10.3233/bsi-190187. Epub 2019 Jul 9. Biomed Spectrosc Imaging. 2019. PMID: 32566474 Free PMC article.
-
Advances in terahertz technology for cancer detection applications.Opt Quantum Electron. 2023;55(2):151. doi: 10.1007/s11082-022-04340-0. Epub 2022 Dec 26. Opt Quantum Electron. 2023. PMID: 36588663 Free PMC article. Review.
-
Performance Analysis of an Aperture-Coupled THz Antenna for Diagnosing Breast Cancer.Micromachines (Basel). 2023 Jun 22;14(7):1281. doi: 10.3390/mi14071281. Micromachines (Basel). 2023. PMID: 37512593 Free PMC article.
-
Terahertz Imaging and Characterization Protocol for Freshly Excised Breast Cancer Tumors.J Vis Exp. 2020 Apr 5;(158):10.3791/61007. doi: 10.3791/61007. J Vis Exp. 2020. PMID: 32310233 Free PMC article.
-
Development of Terahertz Imaging Markers for Pancreatic Ductal Adenocarcinoma using Maximum A Posteriori Probability (MAP) Estimation.ACS Omega. 2023 Mar 8;8(11):9925-9933. doi: 10.1021/acsomega.2c07080. eCollection 2023 Mar 21. ACS Omega. 2023. PMID: 36969433 Free PMC article.
References
-
- Siegel RL, Miller KD, and Jemal A, “Cancer statistics, 2018,” CA. Cancer J. Clin 68(1), 7–30 (2018). - PubMed
-
- American Cancer Society, “Cancer Facts & Figures 2016,” Cancer Facts Fig. 2016 1–9 (2016).
-
- Grootendorst MR, Cariati M, Pinder SE, Kothari A, Douek M, Kovacs T, Hamed H, Pawa A, Nimmo F, Owen J, Ramalingam V, Sethi S, Mistry S, Vyas K, Tuch DS, Britten A, Van Hemelrijck M,Cook GJ, Sibley-Allen C, Allen S, and Purushotham A, “Intraoperative Assessment of Tumor Resection Margins in Breast-Conserving Surgery Using 18 F-FDG Cerenkov Luminescence Imaging: A First-in-Human Feasibility Study,” J. Nucl. Med 58(6), 891–898 (2017). - PubMed
-
- Blair KJ and Legenza M, “Re-Excision Rates Following Breast Conserving Therapy : A Single Institutions Experience Over Ten Years,” Marshall J. Med 3(3), (2017).
-
- Hu BB and Nuss MC, “Imaging with terahertz waves,” Opt. Lett 20(16), 1716 (1995). - PubMed
Grants and funding
LinkOut - more resources
Full Text Sources
Research Materials