. 2018:8:10.3390/app8040617.
doi: 10.3390/app8040617.

Waveguide coupling via magnetic gratings with effective strips

Affiliations

Waveguide coupling via magnetic gratings with effective strips

Kevin M Roccapriore et al. Appl Sci (Basel). 2018.

Abstract

Gratings with complex multilayer strips are studied under inclined incident light. Great interest in these gratings is due to applications as input/output tools for waveguides and as subwavelength metafilms. The structured strips introduce anisotropy in the effective parameters, providing additional flexibility in polarization and angular dependences of optical responses. Their characterization is challenging in the intermediate regime between subwavelength and diffractive modes. The transition between modes occurs at the Wood's anomaly wavelength, which is different at different angle of incidence. The usual characterization with an effective film using permittivity ε and permeability μ has limited effectiveness at normal incidence but does not apply at inclined illumination, due to the effect of periodicity. The optical properties are better characterized with effective medium strips instead of an effective medium layer to account for the multilayer strips and the underlying periodic nature of the grating. This approach is convenient for describing such intermediate gratings for two types of applications: both metafilms and the coupling of incident waves to waveguide modes or diffraction orders. The parameters of the effective strips are retrieved by matching the spectral-angular map at different incident angles.

Keywords: homogenization; magnetic grating; metamaterials; metasurfaces; waveguide coupling.


Conflict of interest statement

Conflicts of Interest: The authors declare no conflict of interest.

Figures

Figure 1:
Figure 1:
Sample geometry and experimental setup. Panel (a) shows the vertical substructure of the strip, (b) portrays the replacement of the real structure with an effective strip, (c) depicts the inclined illumination setup, in addition to usual far-field transmission spectroscopy, necessary for retrieving the optical parameters.
Figure 2:
Figure 2:
SEM micrograph of meta-grating sample. Note the trapezoidal shape.
Figure 3.
Figure 3.
Substrate transmission at 30° incline, showing the stability of the source output spectra. These spectra are collected for each angle of incidence and used later for normalizing procedures. Green and red lines represent TM and TE polarizations, respectively. The dashed variants show the stability of each after one hour.
Figure 4.
Figure 4.
Representation of the actual trapezoidal shape of the grating due to fabrication limitations. A TM polarized beam is incident at an incline; depending on frequency, either a symmetric (left) or antisymmetric (right) mode may be excited. Note that the strips are still considered to be infinite in the y-direction.
Figure 5.
Figure 5.
Normal incidence transmission for TM (left) and TE (right) polarizations. Note that only εy is responsible for TE spectra, while TM spectra depends on εx, εz, and μy. With TM polarization, λd, λe, and λm correspond to the Wood’s anomaly (diffraction threshold), electric resonance, and magnetic resonance, respectively. Data is matched by providing incremental adjustments to the parameters of each dielectric function. Note that the set of parameters providing agreement here must also provide satisfactory matching for the spectral-angular data. Error bars in simulated spectra reflect +/− 5% uncertainty.
Figure 6.
Figure 6.
The geometry of the sample affects the output; this is shown for parallel rays interacting with the grating (a). Note, that depending on the incident beam positions relative to the substrate edge there are three possible scenarios, these rays may either hit the corner and split between upward and downward as shown in (a), or propagate in one of two directions, upward or downward. If the beam goes upward it makes a gap in the down side (b). Map (b) is an angular extension of Figure 8(b) SIM TM 40°, as an example; the gap at −60° is pointed by arrow.
Figure 7.
Figure 7.
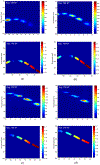
Experimental (top panels) and simulated (bottom panels) spectral-angular map of TE polarized incident light for incident angles 30° (a), 40° (b), 50° (c), and 60° (d). The intensity scales are in the same units for all maps of the TE polarization. Simulated data are matched to experimental data by considering maximum intensity in a spot.
Figure 8.
Figure 8.
Experimental (top panels) and simulated (bottom panels) spectral-angular map of TM polarized incident light for incident angles 30° (a), 40° (b), 50° (c), and 60° (d). The intensity scales are in the same units for all maps of the TM polarization. Simulated data are matched to experimental data by considering maximum intensity in a spot.
Figure 9.
Figure 9.
Spectral-angular data conversion for TE of each prominent “spot” to 1D column graph. The labels A, B, C, D, and E refer to the spots from left to right in Figure 7 in each intensity map. Error bars reflect a 10 % uncertainty. All intensities are on a relative zero to one scaling system.
Figure 10.
Figure 10.
Spectral-angular data conversion for TM of each prominent “spot” to 1D column graph. The labels A, B, C, D, and E refer to the spots from left to right in Figure 8 in each intensity map. Error bars reflect a 10 % uncertainty. All intensities are on a relative zero to one scaling system.
Figure 11.
Figure 11.
Retrieved parameters of the permittivity and permeability via our methods; note μx and μz (not pictured) are unity, (a-c) respectively show the x-, y-, and z-components of the permittivity while (d) shows the y-component of the permeability. ε1 and μ1 refer to real parts, while ε2 and μ2 refer to imaginary parts of the corresponding function.

References

    1. Kildishev AV; Cai W; Chettiar UK; Yuan H-K; Sarychev AK; Drachev VP; Shalaev VM Negative refractive index in optics of metal-dielectric composites. JOSA B 2006, 23, 423–433, doi:10.1364/JOSAB.23.000423. - DOI
    1. Brown DP; Walker MA; Urbas AM; Kildishev AV; Xiao S; Drachev VP Direct measurement of group delay dispersion in metamagnetics for ultrafast pulse shaping. Opt. Express 2012,20, 23082–23087, doi:10.1364/OE.20.023082. - DOI - PubMed
    1. Drachev VP; Podolskiy VA; Kildishev AV Hyperbolic metamaterials: new physics behind a classical problem. Opt. Express 2013, 21,15048–15064, doi:10.1364/OE.21.015048. - DOI - PubMed
    1. Ekinci Y; Christ A; Agio M; Martin OJF; Solak HH; Löffler JF Electric and magnetic resonances in arrays of coupled gold nanoparticle in-tandem pairs. Opt. Express 2008, 16, 13287–13295, doi:10.1364/OE.16.013287. - DOI - PubMed
    1. Smith DR; Schultz S; Markoš P; Soukoulis CM Determination of effective permittivity and permeability of metamaterials from reflection and transmission coefficients. Phys. Rev. B 2002, 65,195104, doi:10.1103/PhysRevB.65.195104. - DOI

LinkOut - more resources