. 2019 Jun 21:7:e7113.
doi: 10.7717/peerj.7113. eCollection 2019.

Metabolomic and biochemical characterization of a new model of the transition of acute kidney injury to chronic kidney disease induced by folic acid

Affiliations

Metabolomic and biochemical characterization of a new model of the transition of acute kidney injury to chronic kidney disease induced by folic acid

Marlene Marisol Perales-Quintana et al. PeerJ. .

Abstract

Background: Renal diseases represent a major public health problem. The demonstration that maladaptive repair of acute kidney injury (AKI) can lead to the development of chronic kidney disease (CKD) and end-stage renal disease has generated interest in studying the pathophysiological pathways involved. Animal models of AKI-CKD transition represent important tools to study this pathology. We hypothesized that the administration of multiple doses of folic acid (FA) would lead to a progressive loss of renal function that could be characterized through biochemical parameters, histological classification and nuclear magnetic resonance (NMR) profiling.

Methods: Wistar rats were divided into groups: the control group received a daily intraperitoneal (I.P.) injection of double-distilled water, the experimental group received a daily I.P. injection of FA (250 mg kg body weight-1). Disease was classified according to blood urea nitrogen level: mild (40-80 mg dL-1), moderate (100-200 mg dL-1) and severe (>200 mg dL-1). We analyzed through biochemical parameters, histological classification and NMR profiling.

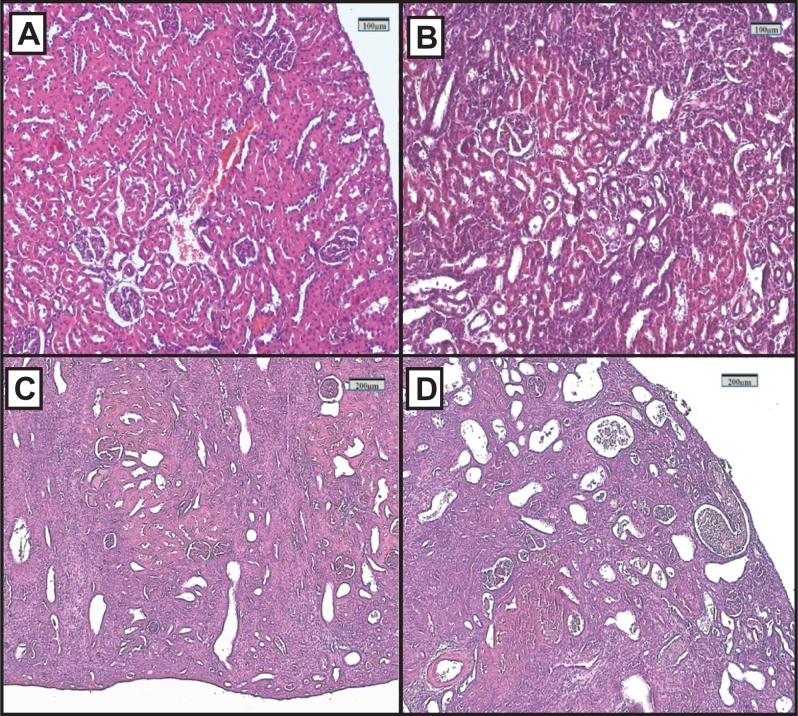
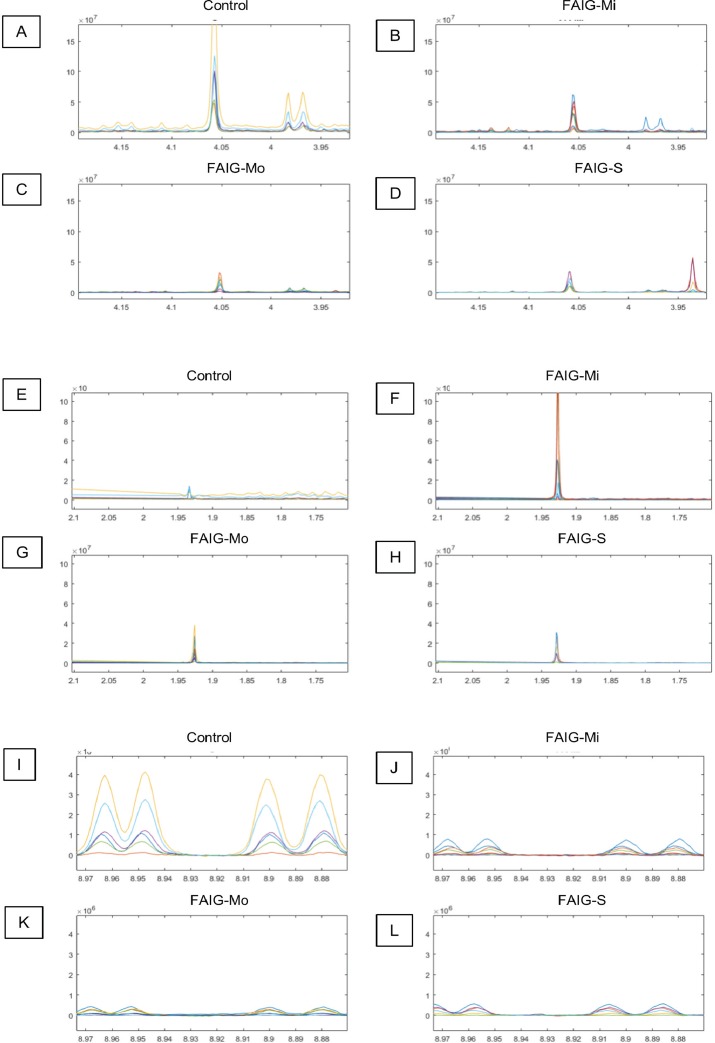
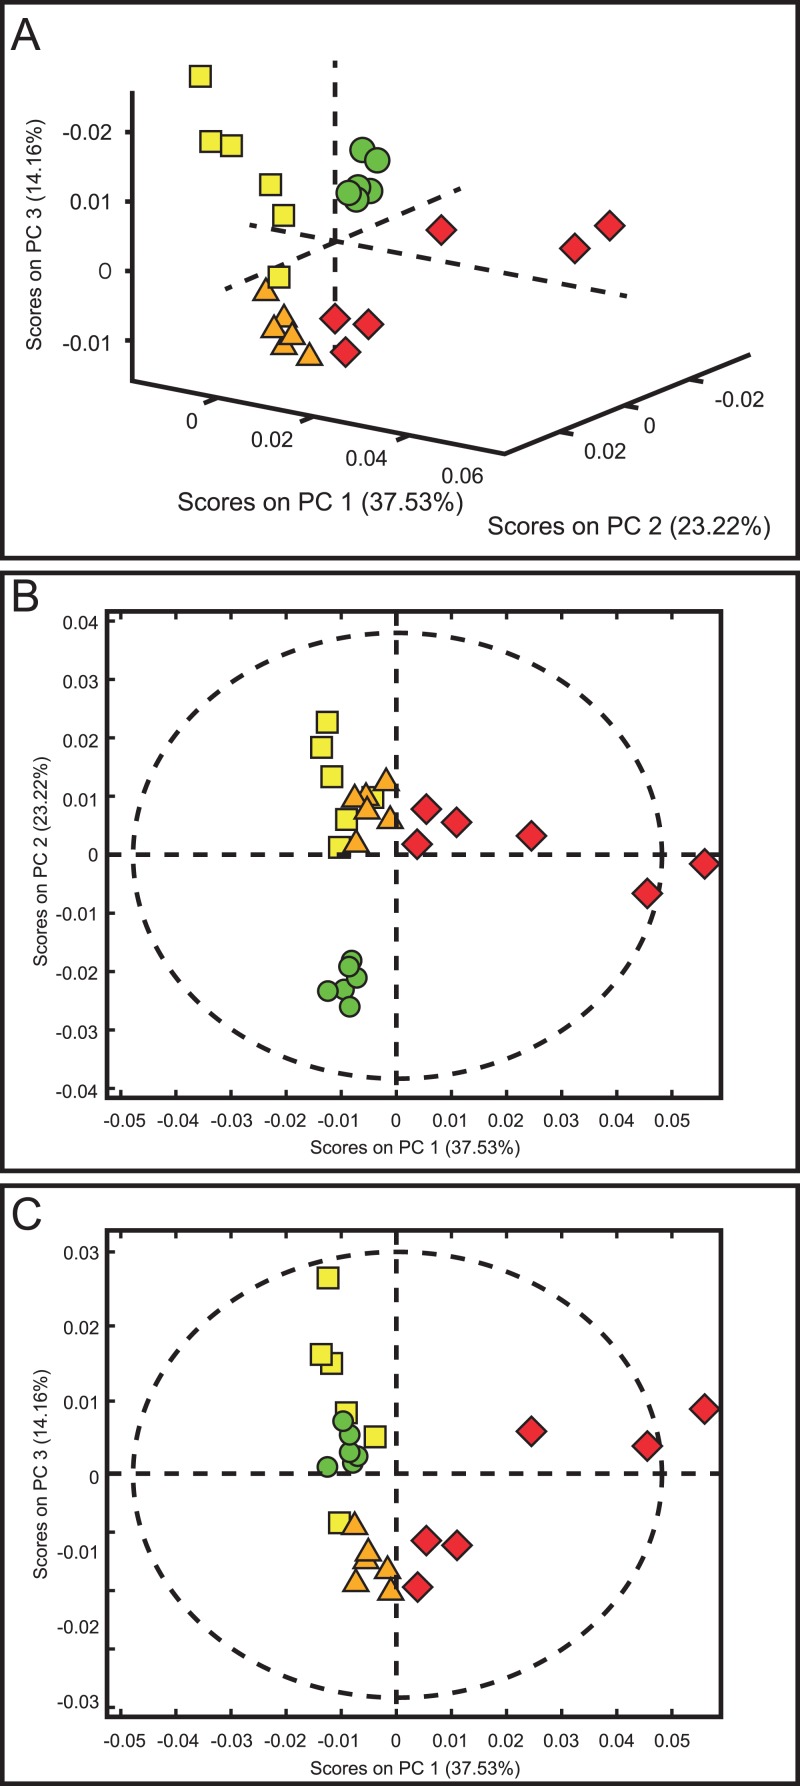
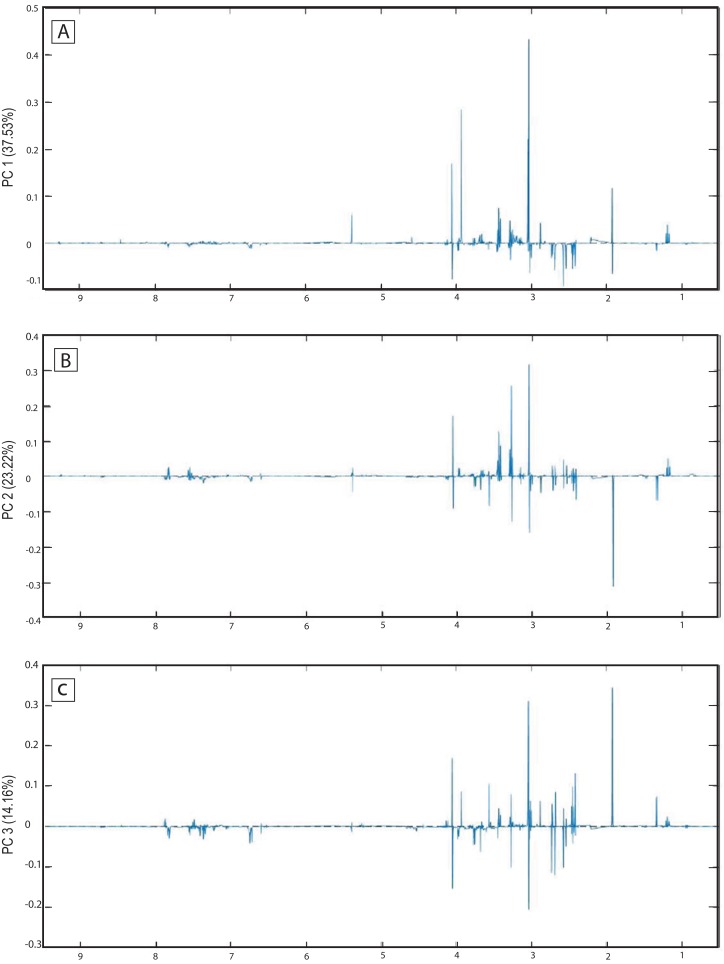
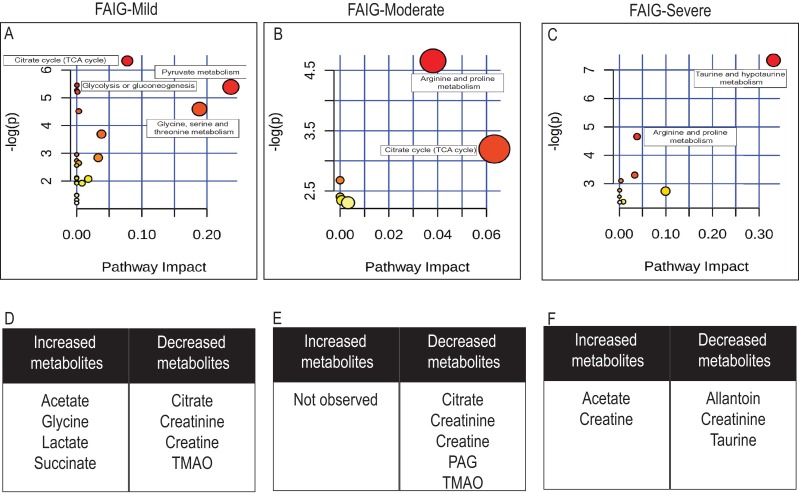
Results: Biochemical markers, pro-inflammatory cytokines and kidney injury biomarkers differed significantly (P < 0.05) between control and experimental groups. Histology revealed that as damage progressed, the degree of tubular injury increased, and the inflammatory infiltrate was more evident. NMR metabolomics and chemometrics revealed differences in urinary metabolites associated with CKD progression. The main physiological pathways affected were those involved in energy production and amino-acid metabolism, together with organic osmolytes. These data suggest that multiple administrations of FA induce a reproducible model of the induction of CKD. This model could help to evaluate new strategies for nephroprotection that could be applied in the clinic.

Keywords: Acute kidney disease; Chronic kidney disease; Folic acid; NMR metabolomics; PCA.


Conflict of interest statement

The authors declare that they have no competing interests.

Figures

Figure 1
Figure 1. Serum levels of biochemical markers, pro-inflammatory cytokines and kidney injury biomarkers.
(A) Serum level of BUN; (B) Serum level of creatinine; (C) Serum level of interleukin 1β; (D) Serum level of interleukin 6; (E) Serum level of tumor necrosis factor alpha; (F) Serum level of neutrophil gelatinase associated with lipocalin; (G) Serum level of kidney injury molecule-1; (H) Serum level of cystatin C. Values are expressed as means ± SD. N = 6 in each group. *P < 0.05 vs. C. P < 0.05 vs. FAIG-Mi. #P < 0.05 vs. FAIG-Mo. FAIG-Mi: Mild damage, FAIG-Mo: Moderate damage, FAIG-S: Severe damage.
Figure 2
Figure 2. Representative light microphotographs of sections of renal tissue from each experimental group, stained with haematoxylin and eosin.
(A) Control group, (B) FAIG-Mi: Mild damage, (C) FAIG-Mo: Moderate damage, (D) FAIG-S: Severe damage.
Figure 3
Figure 3. 1H-NMR spectra of rat urine from the different experimental groups.
(A) 1H-NMR spectra of urine samples of each experimental group. (B) High field of the 1H-NMR spectra of urine samples of each experimental group. (C) Low field of the 1H-NMR spectra of urine samples of each experimental group. Identified metabolites: (1) valine, (2) lactate, (3) alanine, (4) acetate, (5) succinate, (6) oxoglutarate, (7) citrate, (8) dimethylamine, (9) trimethylamine, (10) creatinine, (11) creatine, (12) malonate, (13) taurine, (14) TMAO, (15) glycine, (16) phenylacetylglycine, (17) hippurate, (18) allantoin, (19) urea, (20) aconitate, (21) kynurenate, (22) n-1-methylnicotinamide (23) trigonelline. (*) Removed peaks correspond to the folic acid signals.
Figure 4
Figure 4. Selected regions of the 1H-NMR spectra of urine from each experimental group.
The singlet of the creatinine signal (4.05 ppm) and the doublet of the signal of hippurate (3.97 ppm) in the (A) Control group, (B) FAIG-Mi, (C) FAIG-Mo, (D) FAIG-S. The acetate singlet (1.92 ppm) in the (E) Control group, (F) FAIG-Mi, (G) FAIG-Mo, (H) FAIG-S. The n-1-methylnicotinamide doublets (8.89 and 8.99 ppm) in the (I) Control group, (J) FAIG-Mi, (K) FAIG-Mo, (L) FAIG-S. Visual differences are clearly detectable.
Figure 5
Figure 5. Score plots from PCA applied to 1H-NMR spectra of rat urine samples from control rats and rats with AKI–CKD transition induced by folic acid.
(A) 3D plot of the three components. (B) Score plot of PC1 and PC2, (C) Score plot of PC1 and PC3. Control group: green circles, FAIG-mild group: yellow squares, FAIG-moderate group: orange triangles, FAIG-severe group: red diamonds.
Figure 6
Figure 6. Loading plots from PCA applied to 1H-NMR spectra of rat urine samples from control rats and rats with AKI–CKD transition induced by folic acid.
Loading plots from (A) PC1, first principal component; (B) PC2, second principal component and (C) PC3, third principal component.
Figure 7
Figure 7. Pathway analysis of identified metabolites in the different groups.
The upper panels (A–C) represent the relevant metabolic pathways on the basis of the urine metabolites of each group using the MetaboAnalyst. The lower tables (D–F) correspond to the metabolites whose NMR signal increased or decreased in comparison to control group. (A) and (D) FAIG-Mi: Mild damage; (B) and (E) FAIG-Mo: Moderate damage; (C) and (F) FAIG-S: Severe damage.

References

    1. Agharazii M, St-Louis R, Gautier-Bastien A, Ung R-V, Mokas S, Lariviere R, Richard DE. Inflammatory cytokines and reactive oxygen species as mediators of chronic kidney disease-related vascular calcification. American Journal of Hypertension. 2015;28(6):746–755. doi: 10.1093/ajh/hpu225. - DOI - PubMed
    1. Al Za’abi M, Al Salam S, Al Suleimani Y, Manoj P, Nemmar A, Ali BH. Gum acacia improves renal function and ameliorates systemic inflammation, oxidative and nitrosative stress in streptozotocin-induced diabetes in rats with adenine-induced chronic kidney disease. Cellular Physiology and Biochemistry. 2018;45(6):2293–2304. doi: 10.1159/000488176. - DOI - PubMed
    1. Ali BH, Adham SA, Al Za’abi M, Waly MI, Yasin J, Nemmar A, Schupp N. Ameliorative Effect of Chrysin on Adenine-Induced Chronic Kidney Disease in Rats. PLOS ONE. 2015;10(4):e0125285. doi: 10.1371/journal.pone.0125285. - DOI - PMC - PubMed
    1. Ali BH, Al-Salam S, Al Suleimani Y, Al Kalbani J, Al Bahlani S, Ashique M, Manoj P, Al Dhahli B, Al Abri N, Naser HT, Yasin J, Nemmar A, Al Za’abi M, Hartmann C, Schupp N. Curcumin ameliorates kidney function and oxidative stress in experimental chronic kidney disease. Basic & Clinical Pharmacology & Toxicology. 2018;122(1):65–73. doi: 10.1111/bcpt.12817. - DOI - PubMed
    1. Ali BH, Karaca T, Al Suleimani Y, Al Za’abi M, Al Kalbani J, Ashique M, Nemmar A. The effect of swimming exercise on adenine-induced kidney disease in rats, and the influence of curcumin or lisinopril thereon. PLOS ONE. 2017;12(4):e0176316. doi: 10.1371/journal.pone.0176316. - DOI - PMC - PubMed

LinkOut - more resources