Framework for Estimating Indirect Costs in Animal Health Using Time Series Analysis
- PMID: 31275949
- PMCID: PMC6592220
- DOI: 10.3389/fvets.2019.00190
Framework for Estimating Indirect Costs in Animal Health Using Time Series Analysis
Abstract
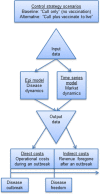
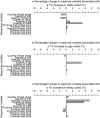
Traditionally, cost-benefit analyses (CBAs) focus on the direct costs of animal disease, including animal mortality, morbidity, and associated response costs. However, such approaches often fail to capture the wider, dynamic market impacts that could arise. The duration of these market dislocations could last well after an initial disease outbreak. More generally, current approaches also muddle definitions of indirect costs, confusing debate on the scope of the totalities of disease-induced economic impacts. The aim of this work was to clarify definitions of indirect costs in the context of animal diseases and to apply this definition to a time series methodological framework to estimate the indirect costs of animal disease control strategies, using a foot and mouth disease (FMD) outbreak in Scotland as a case study. Time series analysis is an econometric method for analyzing statistical relationships between data series over time, thus allowing insights into how market dynamics may change following a disease outbreak. First an epidemiological model simulated FMD disease dynamics based on alternative control strategies. Output from the epidemiological model was used to quantify direct costs and applied in a multivariate vector error correction model to quantify the indirect costs of alternative vaccine stock strategies as a result of FMD. Indirect costs were defined as the economic losses incurred in markets after disease freedom is declared. As such, our definition of indirect costs captures the knock-on price and quantity effects in six agricultural markets after a disease outbreak. Our results suggest that controlling a FMD epidemic with vaccination is less costly in direct and indirect costs relative to a no vaccination (i.e., "cull only") strategy, when considering large FMD outbreaks in Scotland. Our research clarifies and provides a framework for estimating indirect costs, which is applicable to both exotic and endemic diseases. Standard accounting CBAs only capture activities in isolation, ignore linkages across sectors, and do not consider price effects. However, our framework not only delineates when indirect costs start, but also captures the wider knock-on price effects between sectors, which are often omitted from CBAs but are necessary to support decision-making in animal disease prevention and control strategies.
Keywords: animal disease; disease control strategy; foot and mouth disease; indirect costs; market impact; time series modeling; vector error correction model.
Figures


References
-
- FAO The Economic Losses Caused by Animal Disease. Food and Agriculture Organization of the United Nations, Rome (1962). Available online at: http://www.fao.org/3/a-i5512e.pdf
-
- World Bank People, Pathogens and Our Planet, volume 1: Towards a One Health Approach for Controlling Zoonotic Diseases (2010).
-
- Berentsen P, Dijkhuizen A, Oskam A. A dynamic model for cost-benefit analyses of foot-and-mouth disease control strategies. Prev Vet Med. (1992) 12:229–43. 10.1016/0167-5877(92)90052-H - DOI
-
- Fofana A, Toma L, Moran D, Gunn G, Gubbins S, Szmaragd C, et al. An ex-ante economic appraisal of Bluetongue virus incursions and control strategies. J Agric Sci. (2016) 154:118–35. 10.1017/S0021859615000015 - DOI
LinkOut - more resources
Full Text Sources
Research Materials

