

Influence of Insertion Torque on Clinical and Biological Outcomes before and after Loading of Mandibular Implant-Retained Overdentures in Atrophic Edentulous Mandibles
- PMID: 31275984
- PMCID: PMC6582836
- DOI: 10.1155/2019/8132520
Influence of Insertion Torque on Clinical and Biological Outcomes before and after Loading of Mandibular Implant-Retained Overdentures in Atrophic Edentulous Mandibles
Abstract
Aim: To evaluate the influence of primary insertion torque (IT) values of narrow dental implants on the peri-implant health, implant stability, immunoinflammatory responses, bone loss, and success and survival rates.
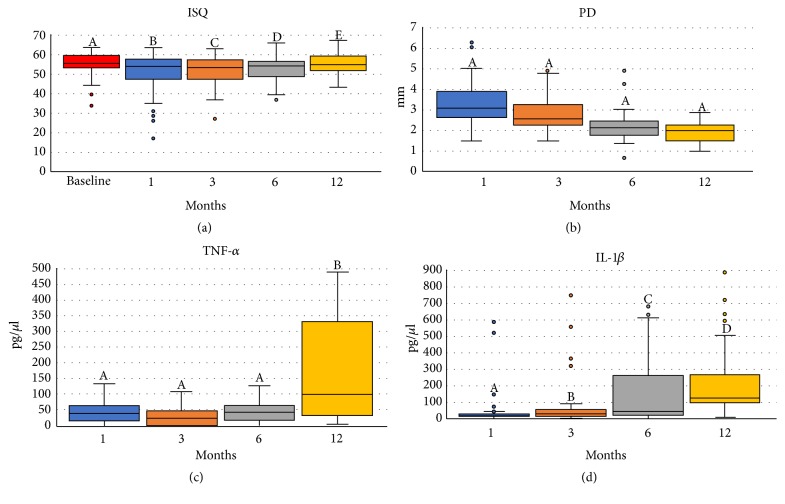
Methods: Thirty-one edentulous patients received two narrow implants (2.9x10mm, Facility NeoPoros) to retain mandibular overdentures. The implants were categorized in four groups according to their IT: (G1) IT > 10 Ncm; (G2) IT ≥ 10Ncm and ≤ 30 Ncm; (G3) IT >30Ncm and < 45Ncm; (G4) IT ≥ 45Ncm, and all implants were loaded after 3 months of healing. The following clinical outcomes were evaluated 1, 3, 6, and 12 months after implant insertion: (i) peri-implant tissue health (PH), gingival index (GI), plaque index (PI), calculus presence (CP), probing depth (PD), and bleeding on probing (BOP); (ii) implant stability quotient (ISQ) by resonance frequency analysis; and (iii) IL-1β and TNF-α concentration in the peri-implant crevicular fluid. The marginal bone level (MBL) and changes (MBC) were evaluated. The Chi2 test, Kruskal-Wallis test, mixed-effects regression analysis, and the Kendall rank correlation coefficient were used for statistical analysis (α = 5%).
Results: G1 presented the highest PD at all evaluated periods. G2 presented higher PI at month 6 and 12. G4 showed increased GI at month 3 and 12 and more CP at month 1 (p=.003). G2 and G4 had higher ISQ values over the study period, while those from G1 and G3 presented lower ISQ values. The IL-1β concentration increased until month 12 and was independent of IT and bone type; G4 had a higher IL-1β concentration in month 3 than the other groups (p=.015). The TNF-α release was negatively correlated with IT, and TNF-α release was highest in G1 at month 12. The MBL immediately after surgery and the MBC at month 12 were similar between the groups, and G4 presented a positive MBC at month 12. The survival and success rates were 75% for G1, 81.3% for G2, 64.3% for G3, and 95% for G4.
Conclusion: The IT did not influence the clinical outcomes and the peri-implant immunoinflammatory responses and was weakly correlated with the narrow dental implants primary stability. The observed success rates suggest that the ideal IT for atrophic fully edentulous patients may deviate from the standardized IT of 32 Ncm.
Figures


Similar articles
-
Healing differences in narrow diameter implants submitted to immediate and conventional loading in mandibular overdentures: A randomized clinical trial.J Periodontal Res. 2019 Jun;54(3):241-250. doi: 10.1111/jre.12624. Epub 2018 Nov 19. J Periodontal Res. 2019. PMID: 30450551 Clinical Trial.
-
Mapping of inflammatory biomarkers in the peri-implant crevicular fluid before and after the occlusal loading of narrow diameter implants.Clin Oral Investig. 2020 Mar;24(3):1311-1320. doi: 10.1007/s00784-019-03010-y. Epub 2019 Jul 16. Clin Oral Investig. 2020. PMID: 31312971
-
Clinical performance of narrow-diameter implants with hydrophobic and hydrophilic surfaces with mandibular implant overdentures: 1-year results of a randomized clinical trial.Clin Oral Implants Res. 2022 Jan;33(1):21-32. doi: 10.1111/clr.13851. Epub 2021 Oct 6. Clin Oral Implants Res. 2022. PMID: 34551146 Clinical Trial.
-
Effect of mandibular residual ridge regularization on peri-implant wound healing when narrow diameter implants are used as overdenture retainers.J Prosthet Dent. 2022 Oct;128(4):648-655. doi: 10.1016/j.prosdent.2020.12.029. Epub 2021 Mar 19. J Prosthet Dent. 2022. PMID: 33752905
-
Is the clinical performance of dental implants influenced by different macrogeometries? A systematic review and meta-analysis.J Prosthet Dent. 2024 Oct 3:S0022-3913(24)00585-7. doi: 10.1016/j.prosdent.2024.08.019. Online ahead of print. J Prosthet Dent. 2024. PMID: 39366839 Review.
Cited by
-
Bone healing around implants placed in subjects with metabolically compromised systemic conditions.J Biomed Mater Res B Appl Biomater. 2023 Sep;111(9):1664-1671. doi: 10.1002/jbm.b.35264. Epub 2023 May 15. J Biomed Mater Res B Appl Biomater. 2023. PMID: 37184298 Free PMC article.
-
Failure Modes and Survival of Anterior Crowns Supported by Narrow Implant Systems.Biomed Res Int. 2020 Sep 7;2020:1057846. doi: 10.1155/2020/1057846. eCollection 2020. Biomed Res Int. 2020. PMID: 32964016 Free PMC article.
-
In vitro evaluation of the influence of bone cortical thickness on the primary stability of conventional- and short-sized implants.J Clin Exp Dent. 2022 Feb 1;14(2):e138-e143. doi: 10.4317/jced.58886. eCollection 2022 Feb. J Clin Exp Dent. 2022. PMID: 35173896 Free PMC article.
-
Randomized Clinical Trial: Bone Bioactive Liquid Improves Implant Stability and Osseointegration.J Funct Biomater. 2024 Oct 1;15(10):293. doi: 10.3390/jfb15100293. J Funct Biomater. 2024. PMID: 39452591 Free PMC article.
-
Pro-Inflammatory Cytokines Expressed During the Initial Phases of Osseointegration: A Systematic Review.J Clin Med. 2024 Nov 28;13(23):7247. doi: 10.3390/jcm13237247. J Clin Med. 2024. PMID: 39685706 Free PMC article. Review.
References
MeSH terms
Substances
LinkOut - more resources
Full Text Sources
Research Materials
Miscellaneous
