

Emerging Cancer Survival Trends, Disparities, and Priorities in Adolescents and Young Adults: A California Cancer Registry-Based Study
- PMID: 31276099
- PMCID: PMC6597054
- DOI: 10.1093/jncics/pkz031
Emerging Cancer Survival Trends, Disparities, and Priorities in Adolescents and Young Adults: A California Cancer Registry-Based Study
Abstract
Background: Although landmark studies in the 1990s demonstrated that adolescents and young adults (AYAs, ages 15-39 years) with cancer had lower survival improvement compared to other ages, therapeutic advances warrant reappraisal of those observations. We utilized more recent data to study site-specific AYA survival trends and disparities and gain a more contemporary understanding of this problem.
Methods: Using California Cancer Registry data from 1988 to 2014, we calculated 1) 5-year overall survival improvement for AYAs compared to other age groups; 2) hazard ratios (HRs) of death for AYAs comparing 2001-2014 with 1988-2000 stratified by site, stage, sex, age group, race and ethnicity, and socioeconomic status (SES); and 3) site-specific adjusted HRs (aHRs) for AYA risk groups and interaction analyses by time period.
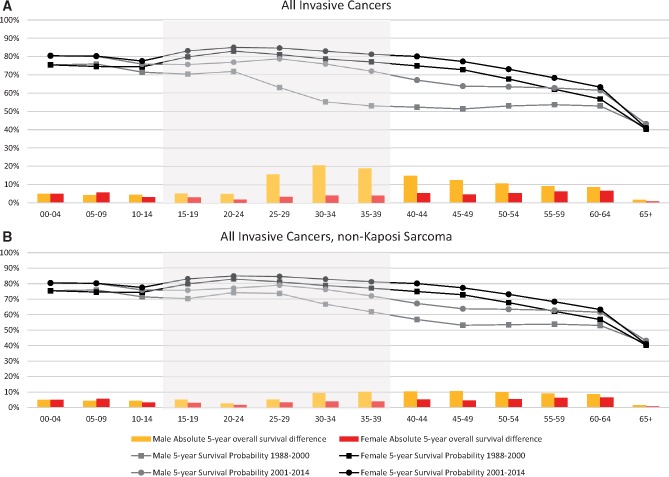
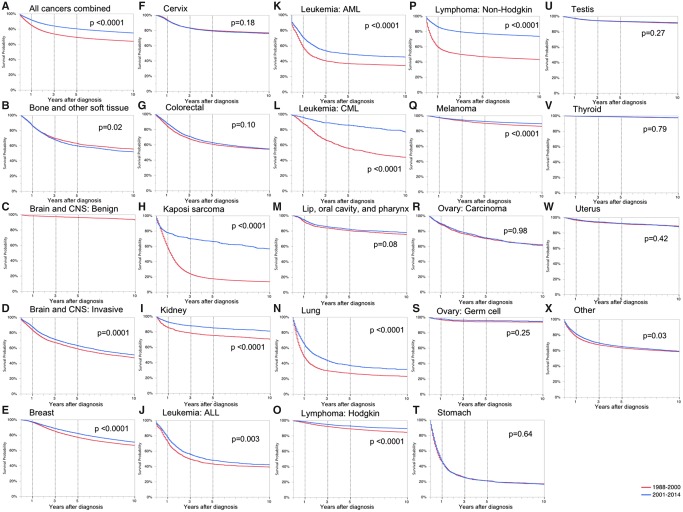
Results: For all cancers combined, AYAs demonstrated survival improvement that exceeded all other age groups, largely due to reduced mortality in human immunodeficiency virus and acquired immunodeficiency syndrome-related cancers. The strongest predictor of death was cancer stage (aHR = 6.32 for distant vs localized, 95% confidence interval [CI] = 6.20 to 6.45). The aHR of death was statistically significantly higher for blacks (1.46, 95% CI = 1.42 to 1.50), Asian and Pacific Islanders (1.12, 95% CI = 1.09 to 1.15), and Latino whites (1.06, 95% CI = 1.04 to 1.08) compared to non-Latino whites, and was statistically significantly higher for low SES compared to high (1.31, 95% CI = 1.29 to 1.34). Survival disparities by stage, race and ethnicity, and SES worsened over time.
Conclusions: For AYAs in aggregate, the historical cancer survival improvement gap has been closed. However, the growing survival disparities in AYA subsets reported here, including advanced stage disease, racial and ethnic minorities, and low SES, highlight new priorities in need of increased attention, including inequities in cancer care and delivery within this vulnerable population.
Figures
References
-
- Aizer AA, Wilhite TJ, Chen MH, et al. Lack of reduction in racial disparities in cancer-specific mortality over a 20-year period. Cancer. 2014;120(10):1532–1539. - PubMed
-
- Albano JD, Ward E, Jemal A, et al. Cancer mortality in the United States by education level and race. J Natl Cancer Inst. 2007;99(18):1384–1394. - PubMed
-
- Adolescent and Young Adult Progress Review Group. Closing the Gap: Research and Care Imperatives for Adolescents and Young Adults with Cancer. Bethesda, MD: US Department of Health and Human Services, National Institutes of Health, National Cancer Institute, LIVESTRONG Young Adult Alliance; 2006.
Grants and funding
LinkOut - more resources
Full Text Sources
Miscellaneous