

Evaluation of a motion-robust 2D chemical shift-encoded technique for R2* and field map quantification in ferumoxytol-enhanced MRI of the placenta in pregnant rhesus macaques
- PMID: 31276263
- PMCID: PMC7839098
- DOI: 10.1002/jmri.26849
Evaluation of a motion-robust 2D chemical shift-encoded technique for R2* and field map quantification in ferumoxytol-enhanced MRI of the placenta in pregnant rhesus macaques
Abstract
Background: 3D chemical shift-encoded (CSE)-MRI techniques enable assessment of ferumoxytol concentration but are unreliable in the presence of motion.
Purpose: To evaluate a motion-robust 2D-sequential CSE-MRI for R2* and B0 mapping in ferumoxytol-enhanced MRI of the placenta.
Study type: Prospective.
Animal model: Pregnant rhesus macaques.
Field strength/sequence: 3.0T/CSE-MRI.
Assessment: 2D-sequential CSE-MRI was compared with 3D respiratory-gated CSE-MRI in placental imaging of 11 anesthetized animals at multiple timepoints before and after ferumoxytol administration, and in ferumoxytol phantoms (0 μg/mL-440 μg/mL). Motion artifacts of CSE-MRI in 10 pregnant women without ferumoxytol administration were assessed retrospectively by three blinded readers (4-point Likert scale). The repeatability of CSE-MRI in seven pregnant women was also prospectively studied.
Statistical tests: Placental R2* and boundary B0 field measurements (ΔB0) were compared between 2D-sequential and 3D respiratory-gated CSE-MRI using linear regression and Bland-Altman analysis.
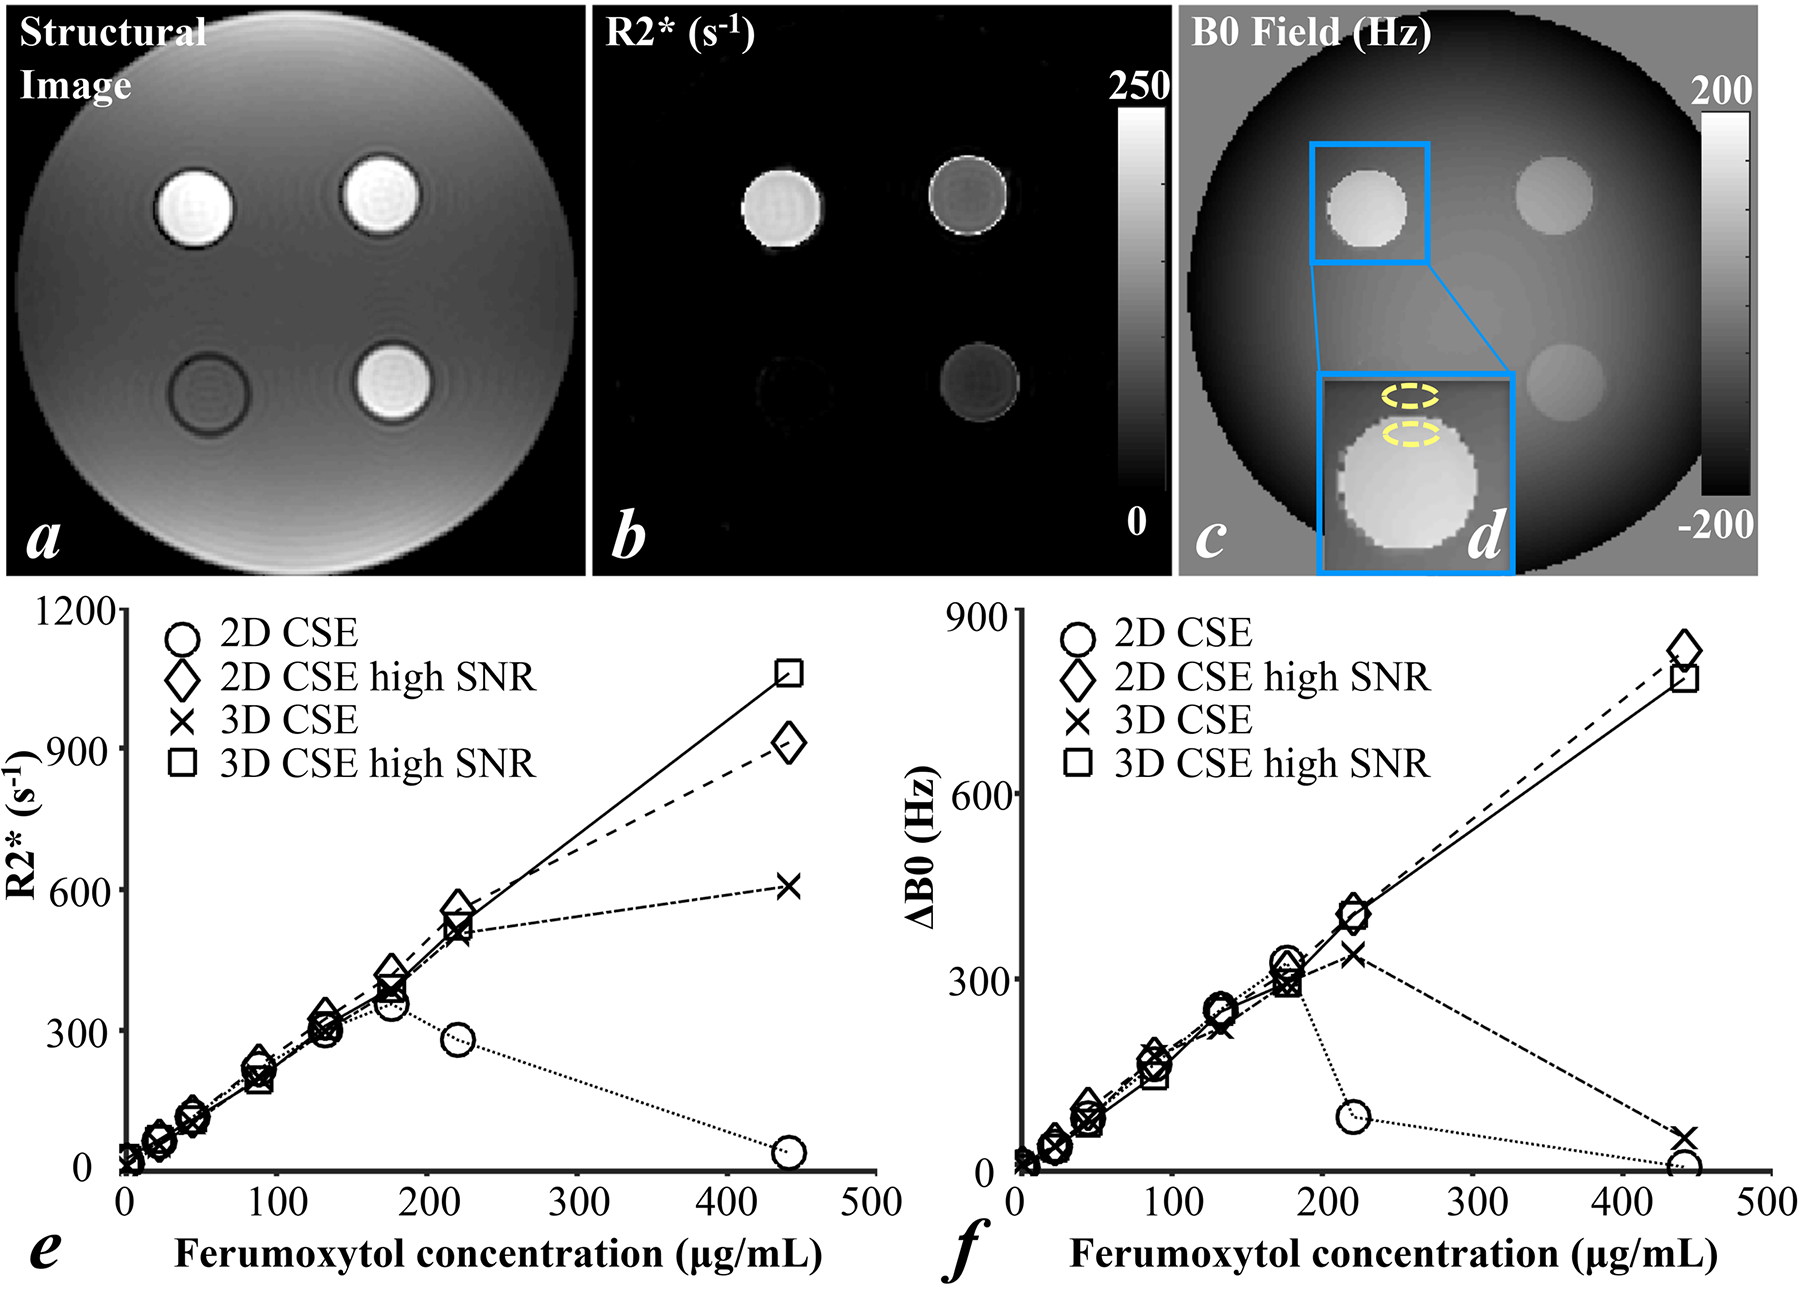
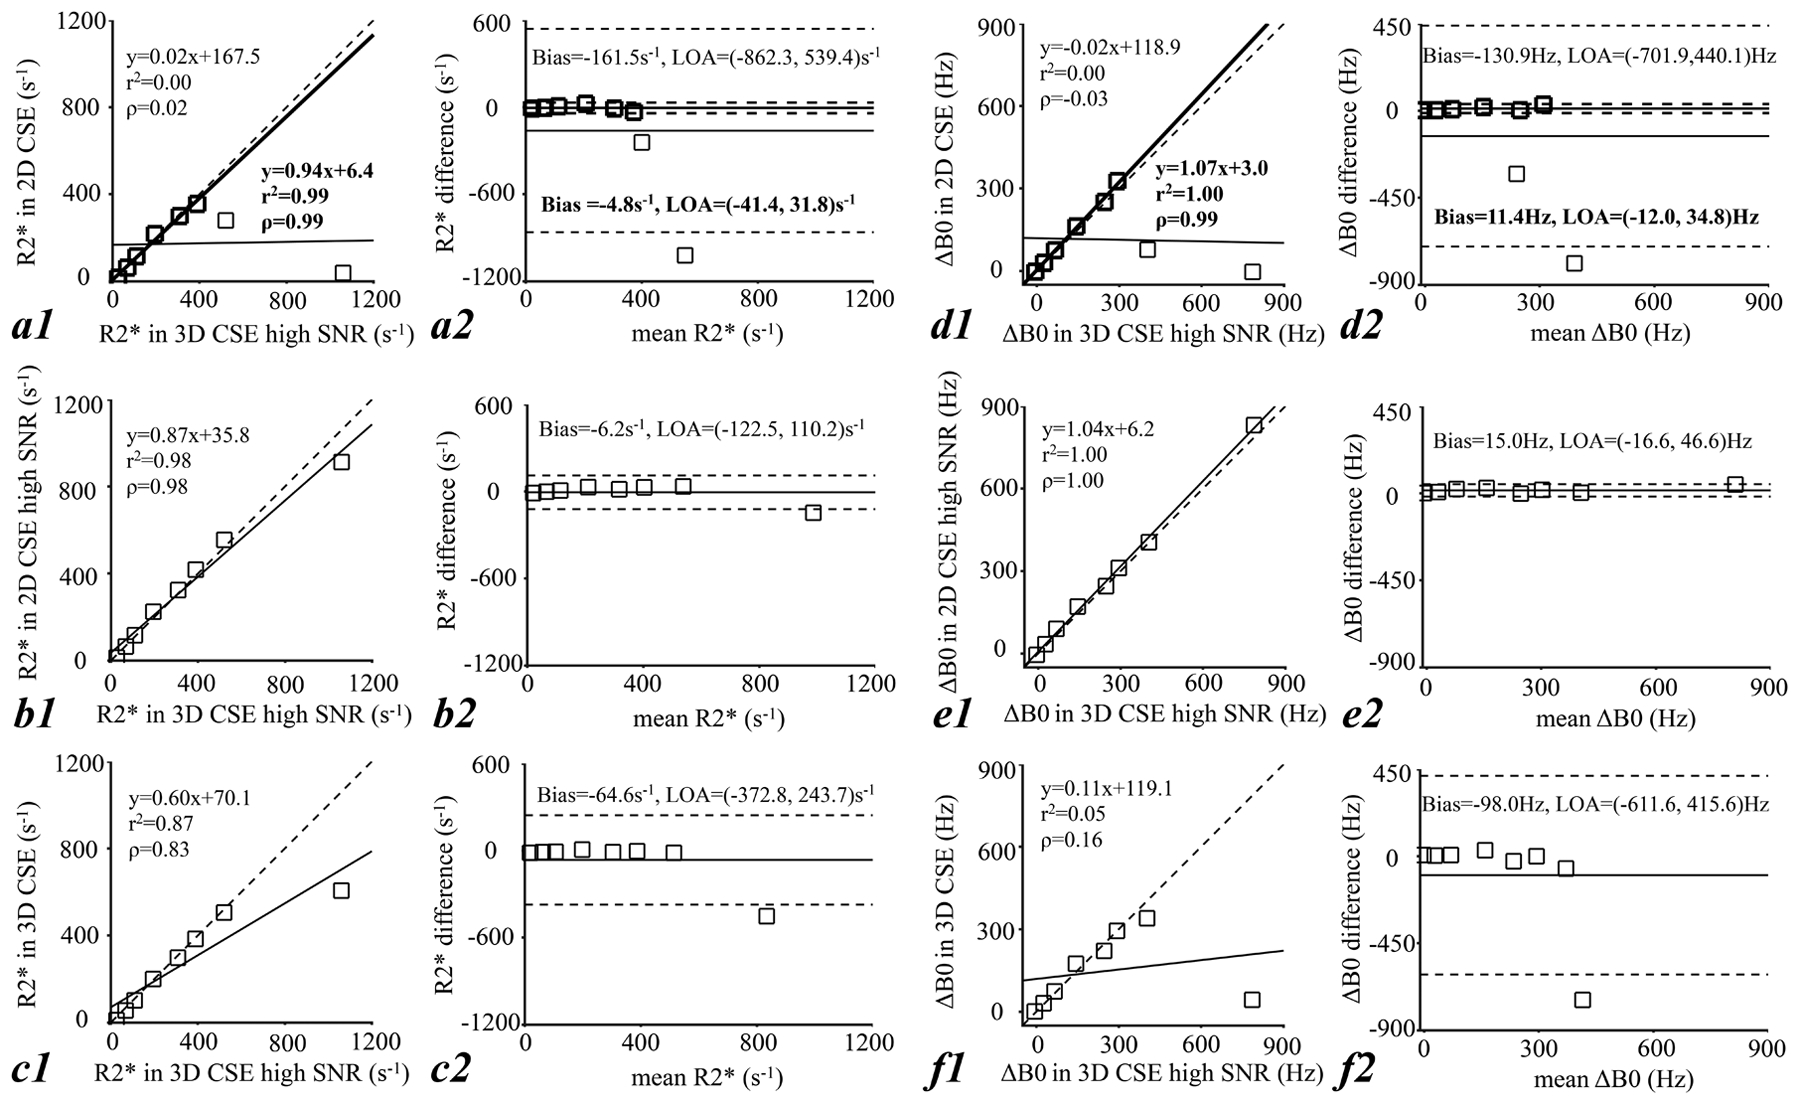
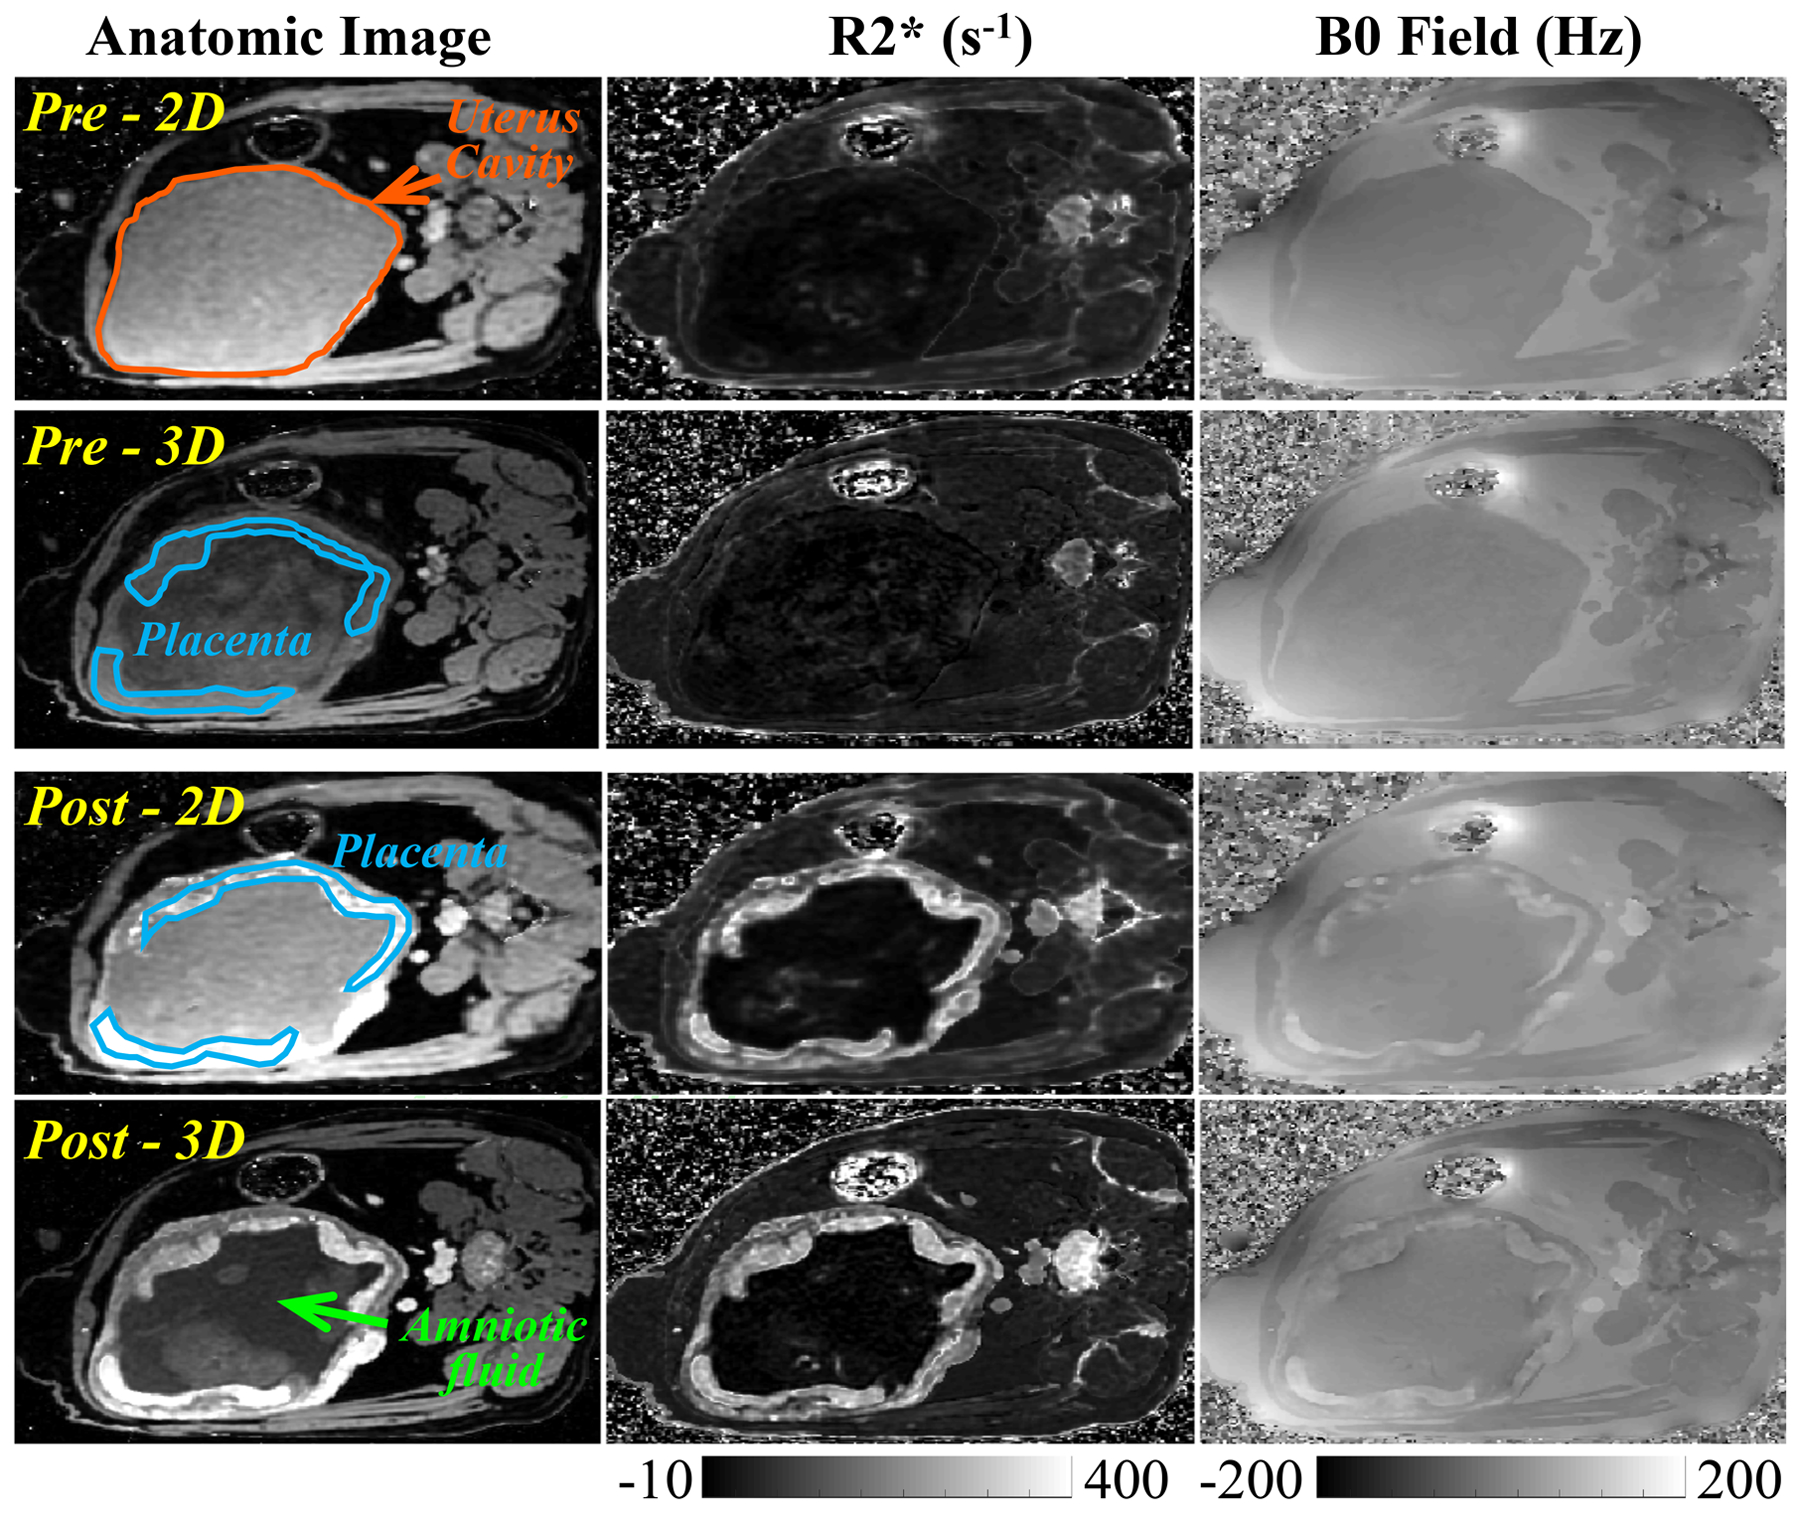
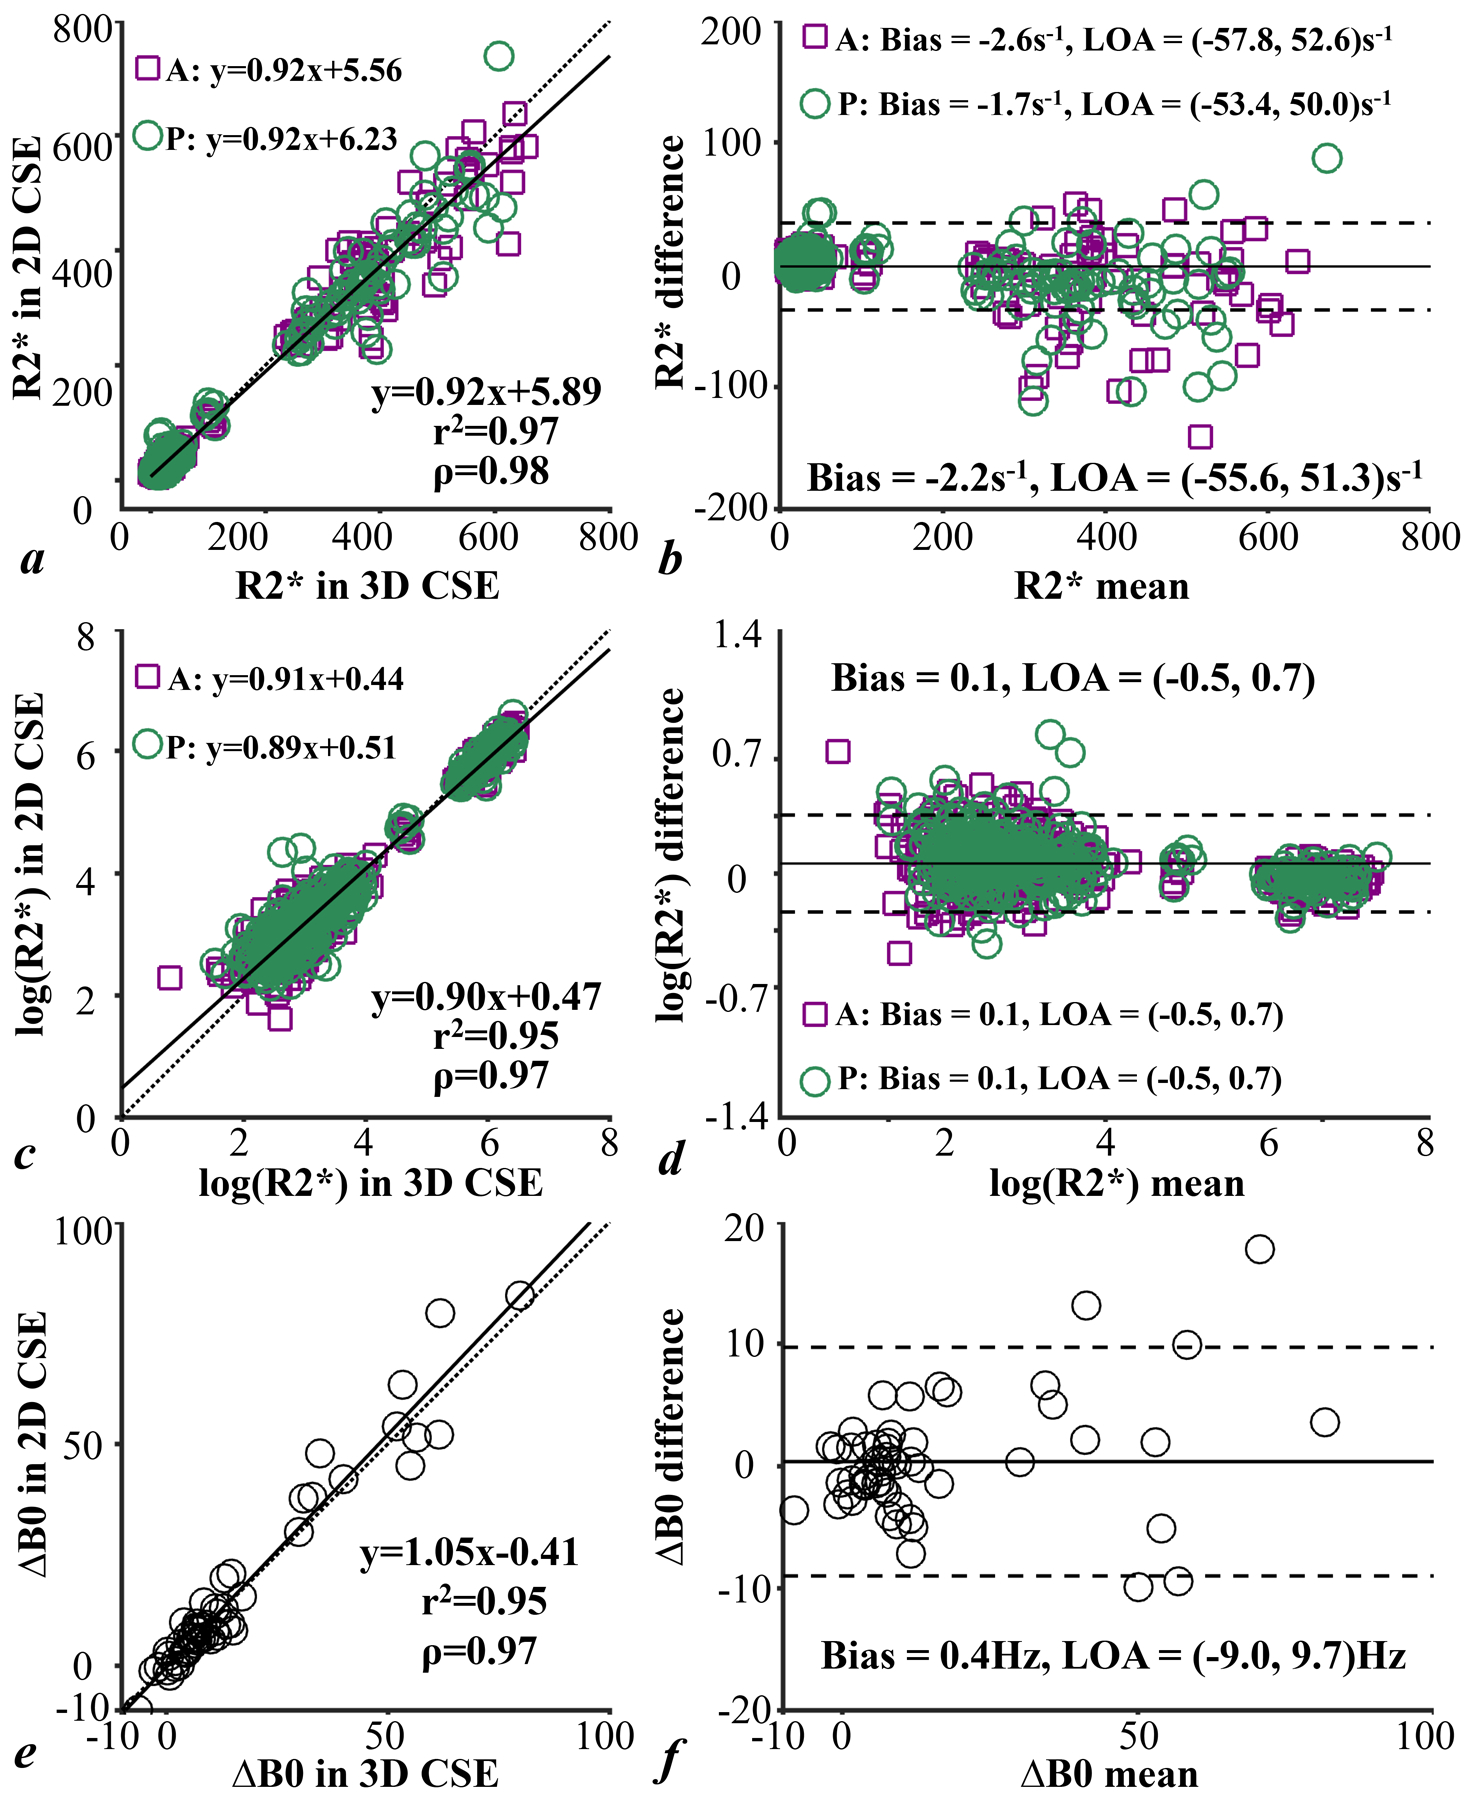
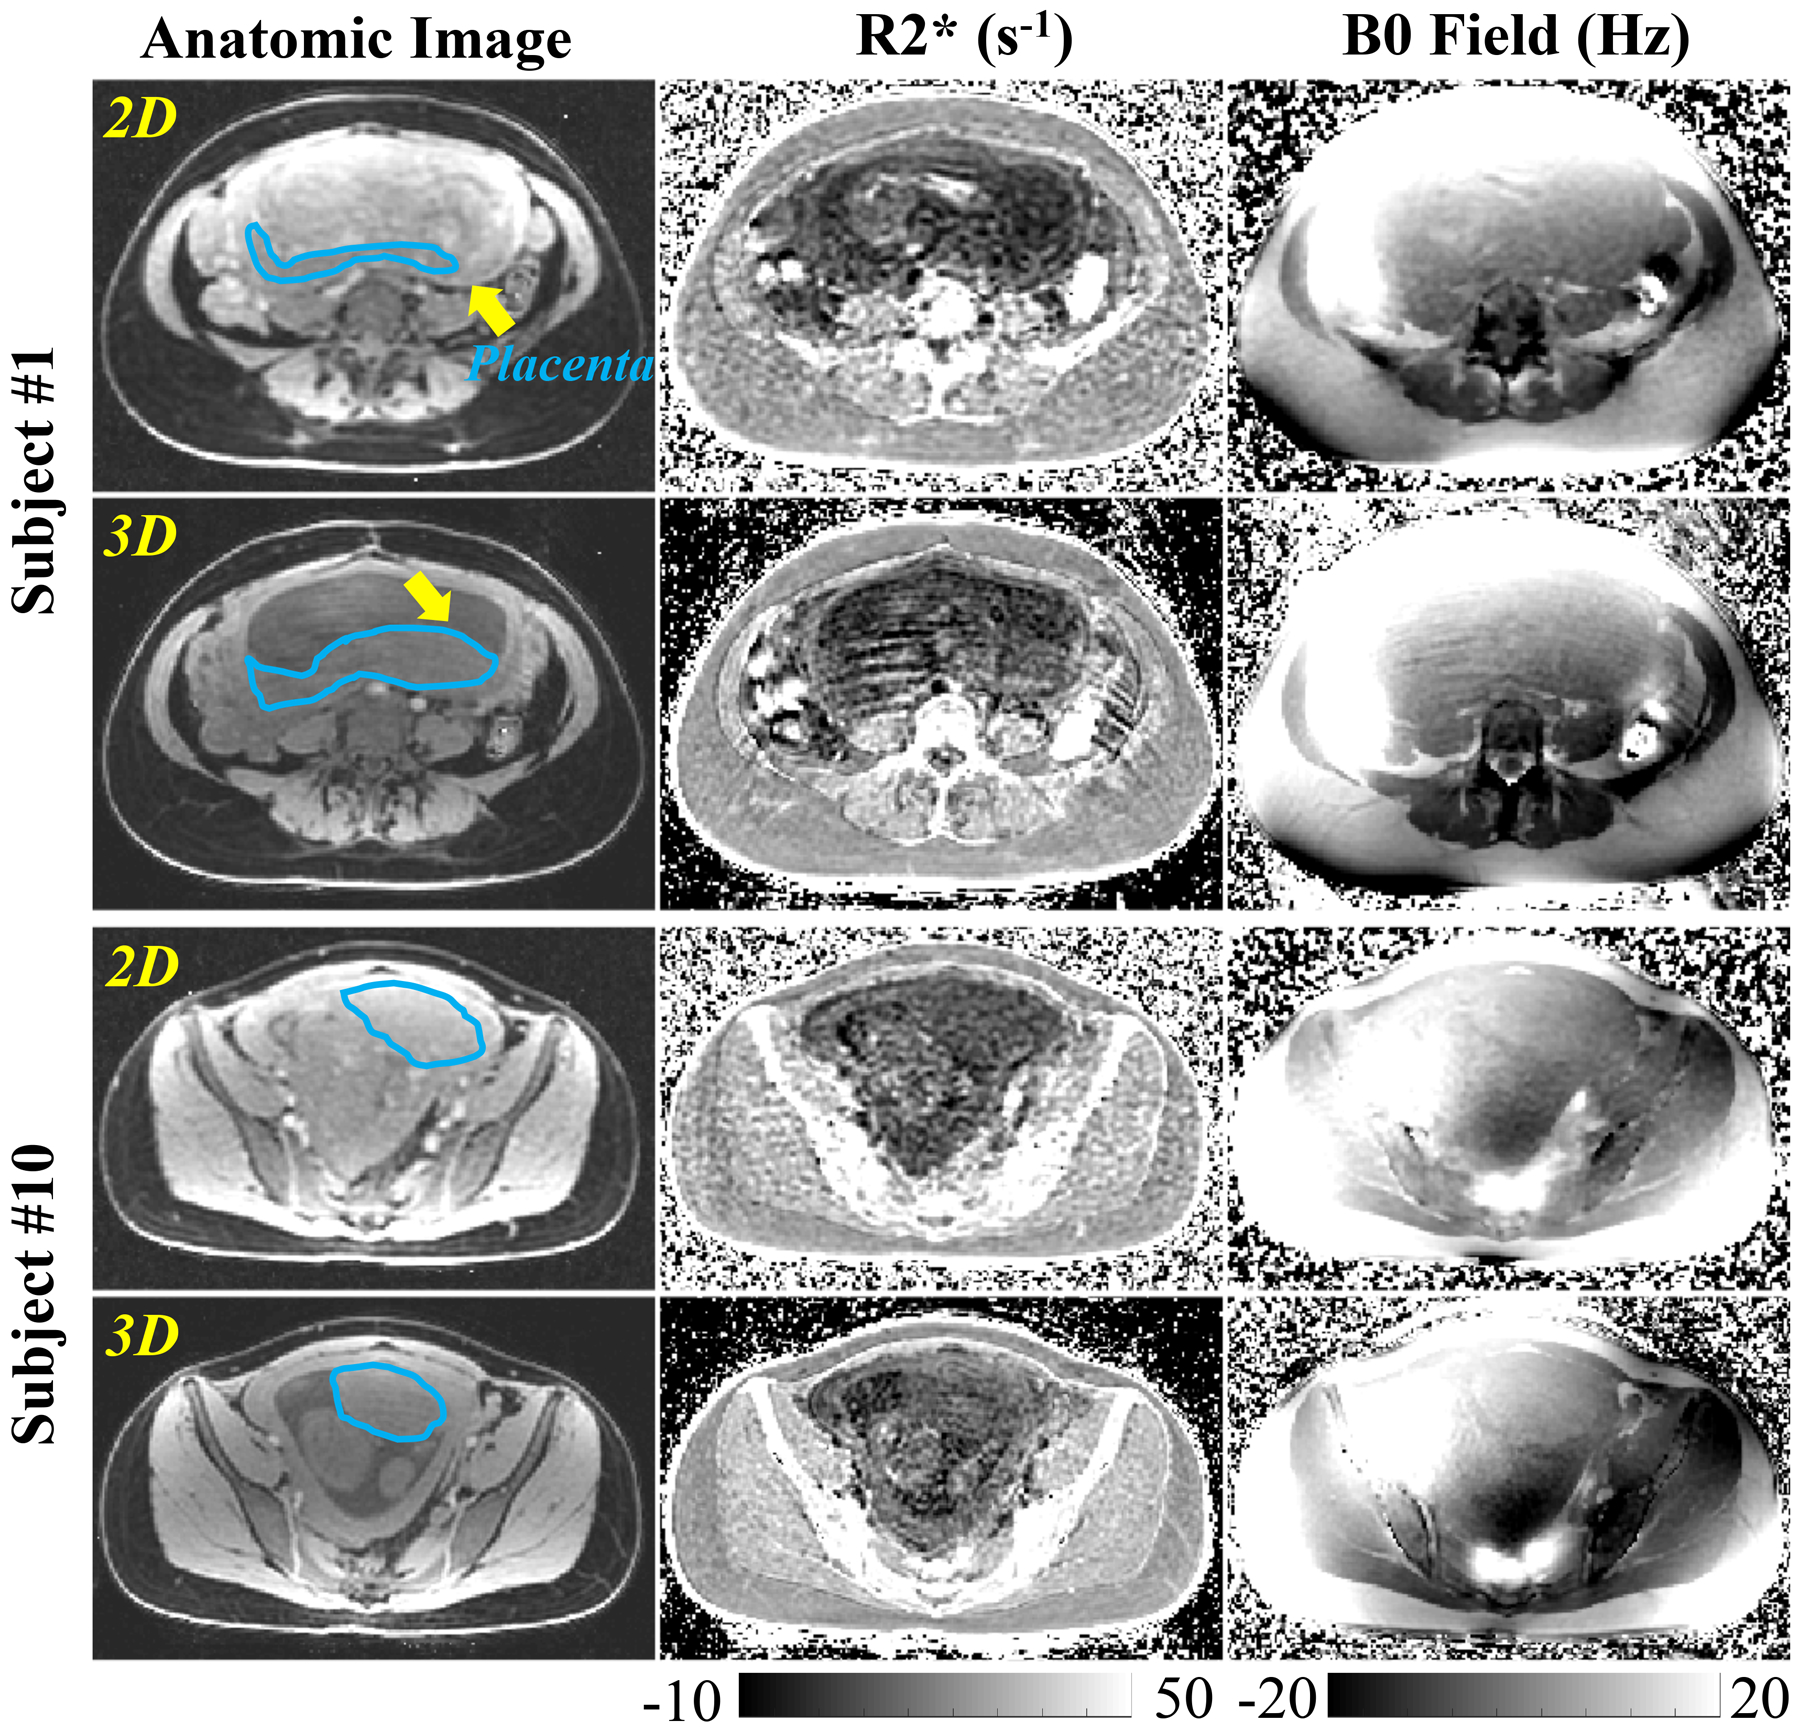
Results: In phantoms, a slope of 0.94 (r2 = 0.99, concordance correlation coefficient ρ = 0.99), and bias of -4.8 s-1 (limit of agreement [LOA], -41.4 s-1 , +31.8 s-1 ) in R2*, and a slope of 1.07 (r2 = 1.00, ρ = 0.99) and bias of 11.4 Hz (LOA -12.0 Hz, +34.8 Hz) in ΔB0 were obtained in 2D CSE-MRI compared with 3D CSE-MRI for reference R2* ≤390 s-1 . In animals, a slope of 0.92 (r2 = 0.97, ρ = 0.98) and bias of -2.2 s-1 (LOA -55.6 s-1 , +51.3 s-1 ) in R2*, and a slope of 1.05 (r2 = 0.95, ρ = 0.97) and bias of 0.4 Hz (LOA -9.0 Hz, +9.7 Hz) in ΔB0 were obtained. In humans, motion-impaired R2* maps in 3D CSE-MRI (Reader 1: 1.8 ± 0.6, Reader 2: 1.3 ± 0.7, Reader 3: 1.9 ± 0.6), while 2D CSE-MRI was motion-free (Reader 1: 2.9 ± 0.3, Reader 2: 3.0 ± 0, Reader 3: 3.0 ± 0). A mean difference of 0.66 s-1 and coefficient of repeatability of 9.48 s-1 for placental R2* were observed in the repeated 2D CSE-MRI.
Data conclusion: 2D-sequential CSE-MRI provides accurate R2* and B0 measurements in ferumoxytol-enhanced placental MRI of animals in the presence of respiratory motion, and motion-robustness in human placental imaging.
Level of evidence: 1 Technical Efficacy: Stage 1 J. Magn. Reson. Imaging 2020;51:580-592.
Keywords: B0 field; R2*; chemical shift-encoded; ferumoxytol; motion-robust; placenta.
© 2019 International Society for Magnetic Resonance in Medicine.
Figures
Similar articles
-
Validation of a motion-robust 2D sequential technique for quantification of hepatic proton density fat fraction during free breathing.J Magn Reson Imaging. 2018 Dec;48(6):1578-1585. doi: 10.1002/jmri.26056. Epub 2018 Apr 17. J Magn Reson Imaging. 2018. PMID: 29665193 Free PMC article.
-
Improved free-breathing liver fat and iron quantification using a 2D chemical shift-encoded MRI with flip angle modulation and motion-corrected averaging.Eur Radiol. 2022 Aug;32(8):5458-5467. doi: 10.1007/s00330-022-08682-x. Epub 2022 Mar 21. Eur Radiol. 2022. PMID: 35307745 Free PMC article.
-
3D mapping of the placenta during early gestation using free-breathing multiecho stack-of-radial MRI at 3T.J Magn Reson Imaging. 2019 Jan;49(1):291-303. doi: 10.1002/jmri.26203. Epub 2018 Aug 24. J Magn Reson Imaging. 2019. PMID: 30142239 Free PMC article.
-
Safety of Off-Label Use of Ferumoxtyol as a Contrast Agent for MRI: A Systematic Review and Meta-Analysis of Adverse Events.J Magn Reson Imaging. 2021 Mar;53(3):840-858. doi: 10.1002/jmri.27405. Epub 2020 Oct 24. J Magn Reson Imaging. 2021. PMID: 33098154
-
The emerging role of ferumoxytol-enhanced MRI in the management of cerebrovascular lesions.Molecules. 2013 Aug 13;18(8):9670-83. doi: 10.3390/molecules18089670. Molecules. 2013. PMID: 23945642 Free PMC article. Review.
Cited by
-
Quantitative ferumoxytol-enhanced MRI in pregnancy: A feasibility study in the nonhuman primate.Magn Reson Imaging. 2020 Jan;65:100-108. doi: 10.1016/j.mri.2019.10.006. Epub 2019 Oct 23. Magn Reson Imaging. 2020. PMID: 31655139 Free PMC article.
-
Heme oxygenase/carbon monoxide system affects the placenta and preeclampsia.Med Gas Res. 2025 Jun 1;15(2):276-287. doi: 10.4103/mgr.MEDGASRES-D-24-00081. Epub 2025 Jan 18. Med Gas Res. 2025. PMID: 39829164 Free PMC article. Review.
-
Ferumoxytol dynamic contrast enhanced magnetic resonance imaging identifies altered placental cotyledon perfusion in rhesus macaques†.Biol Reprod. 2022 Dec 10;107(6):1517-1527. doi: 10.1093/biolre/ioac168. Biol Reprod. 2022. PMID: 36018823 Free PMC article.
-
Advanced magnetic resonance imaging in human placenta: insights into fetal growth restriction and congenital heart disease.Front Cardiovasc Med. 2024 Jul 23;11:1426593. doi: 10.3389/fcvm.2024.1426593. eCollection 2024. Front Cardiovasc Med. 2024. PMID: 39108671 Free PMC article. Review.
-
The human placenta project: Funded studies, imaging technologies, and future directions.Placenta. 2023 Oct;142:27-35. doi: 10.1016/j.placenta.2023.08.067. Epub 2023 Aug 21. Placenta. 2023. PMID: 37634371 Free PMC article. Review.
References
-
- Bashir MR, Bhatti L, Marin D, Nelson RC. Emerging applications for ferumoxytol as a contrast agent in MRI. J Magn Reson Imaging 2015; 41(4):884–898. - PubMed
-
- Christen T, Ni W, Qiu D, et al. High-resolution cerebral blood volume imaging in humans using the blood pool contrast agent ferumoxytol. Magn Reson Med 2013;70:705–710. - PubMed
Publication types
MeSH terms
Substances
Grants and funding
LinkOut - more resources
Full Text Sources
Medical
Research Materials
