. 2019 Jul 5;15(7):e1007078.
doi: 10.1371/journal.pcbi.1007078. eCollection 2019 Jul.

Disease gene prediction for molecularly uncharacterized diseases

Affiliations

Disease gene prediction for molecularly uncharacterized diseases

Juan J Cáceres et al. PLoS Comput Biol. .

Abstract

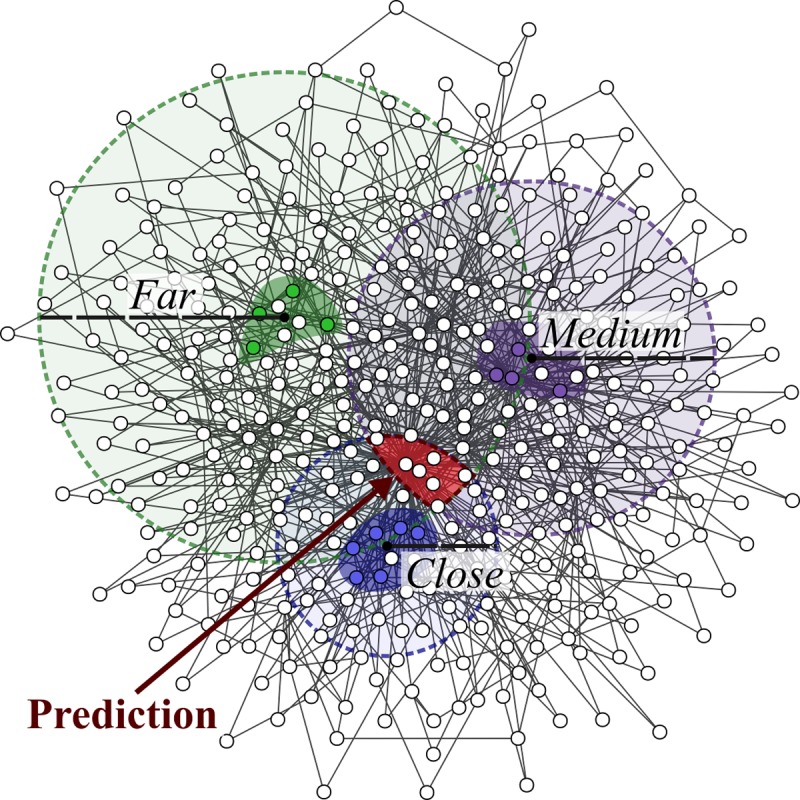
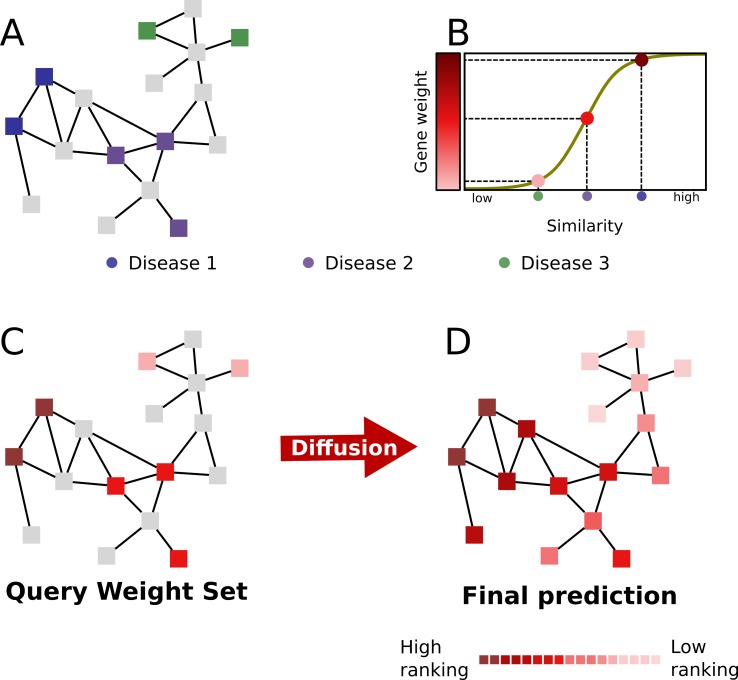
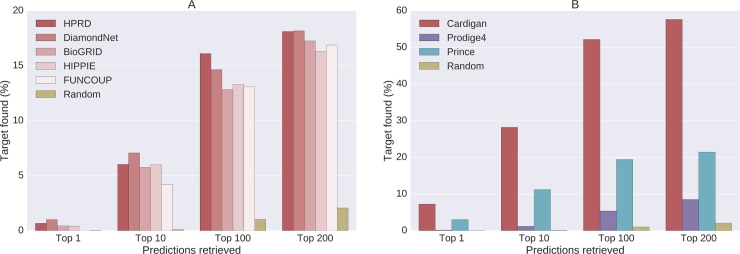
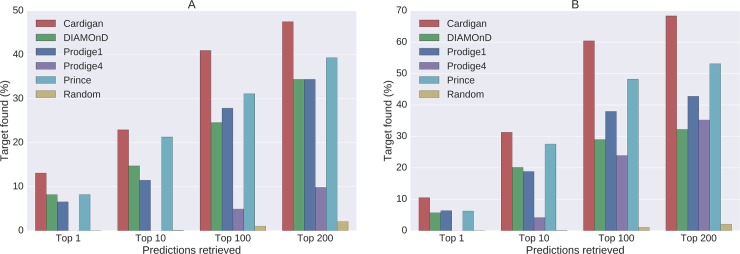
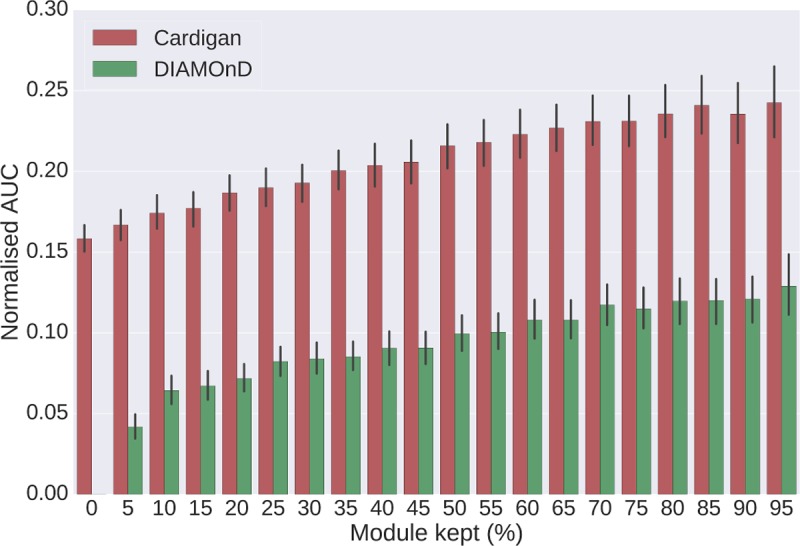
Network medicine approaches have been largely successful at increasing our knowledge of molecularly characterized diseases. Given a set of disease genes associated with a disease, neighbourhood-based methods and random walkers exploit the interactome allowing the prediction of further genes for that disease. In general, however, diseases with no known molecular basis constitute a challenge. Here we present a novel network approach to prioritize gene-disease associations that is able to also predict genes for diseases with no known molecular basis. Our method, which we have called Cardigan (ChARting DIsease Gene AssociatioNs), uses semi-supervised learning and exploits a measure of similarity between disease phenotypes. We evaluated its performance at predicting genes for both molecularly characterized and uncharacterized diseases in OMIM, using both weighted and binary interactomes, and compared it with state-of-the-art methods. Our tests, which use datasets collected at different points in time to replicate the dynamics of the disease gene discovery process, prove that Cardigan is able to accurately predict disease genes for molecularly uncharacterized diseases. Additionally, standard leave-one-out cross validation tests show how our approach outperforms state-of-the-art methods at predicting genes for molecularly characterized diseases by 14%-65%. Cardigan can also be used for disease module prediction, where it outperforms state-of-the-art methods by 87%-299%.


Conflict of interest statement

The authors have declared that no competing interests exist.

Figures

Fig 1
Fig 1. Disease module “triangulation” using disease phenotypic similarity.
The area where the module for a disease with no known genes (the query disease, in red) should be located, is identified using the distance to the modules of three charted diseases (blue, purple and green). Colored nodes represent the disease genes of each charted disease and their disease modules are represented with highlighted backgrounds. The distances between the query and the charted diseases (close, medium and far) are represented by the dashed circles and are related to the phenotype similarity (e.g. highly similar diseases should be close in the graph). The disease module for the red disease should lie in the red area.
Fig 2
Fig 2. The prediction on an uncharted disease using Cardigan.
(A) The PPI network with disease genes associated to three different diseases (green, purple, and blue), is used to predict genes for the uncharted (red) disease. (B) The Caniza similarity is transformed into a weight for the red disease. (C) The query weight set (QWS)–the initial seed set for the diffusion process. (D) The final state of the network after the diffusion process. All genes have acquired a weight. These weights are used to rank all genes and constitute Cardigan’s prediction.
Fig 3
Fig 3. Performance of disease gene prediction for uncharted diseases.
Percentage of disease genes found in the predictions vs. the number of predictions retrieved. (A) Cardigan performance for diseases which were uncharted in 2013, but were charted in 2017, measured on different PPI networks. (B) Comparison of performances of different disease gene prediction algorithm for a leave-one-out testing for diseases with a single known gene in 2017 on HPRD.
Fig 4
Fig 4. Performance of disease gene prediction for charted diseases.
Percentage of disease genes found in the predictions vs. the number of predictions retrieved. (A) Performance for predicting genes that charted diseases have acquired between 2013 and 2017. (B) Performances for a leave-one-out testing using 2017 data.
Fig 5
Fig 5. Performance at reconstructing disease modules.
Different percentages of disease modules from Ghiassian et al. are removed and modules are then reconstructed. The y-axis shows the AUC of the ROC curve normalized for the first 200 false positives predictions. Error bars were calculated using the results for all diseases, each one with 10 random selections of kept genes. The expected value for a random prediction is 0.007. All predictions were made using DiamondNet.

References

    1. Das J, Mohammed J, Yu H. Genome scale analysis of interaction dynamics reveals organization of biological networks. Bioinformatics. 2012;28 10.1093/bioinformatics/bts283 - DOI - PMC - PubMed
    1. Lathrop GM, Lalouel JM. Easy calculations of lod scores and genetic risks on small computers. American journal of human genetics. 1984;36(2):460–5. - PMC - PubMed
    1. Colhoun HM, McKeigue PM, Smith GD. Problems of reporting genetic associations with complex outcomes. The Lancet. 2003;361(9360):865–72. - PubMed
    1. Wolfe CJ, Kohane IS, Butte AJ. Systematic survey reveals general applicability of" guilt-by-association" within gene coexpression networks. BMC bioinformatics. 2005;6(1):227. - PMC - PubMed
    1. Oti M, Snel B, Huynen MA, Brunner HG. Predicting disease genes using protein–protein interactions. Journal of medical genetics. 2006;43(8):691–8. 10.1136/jmg.2006.041376 - DOI - PMC - PubMed

Publication types