

Identification of miRNAs-genes regulatory network in diabetic nephropathy based on bioinformatics analysis
- PMID: 31277135
- PMCID: PMC6635158
- DOI: 10.1097/MD.0000000000016225
Identification of miRNAs-genes regulatory network in diabetic nephropathy based on bioinformatics analysis
Abstract
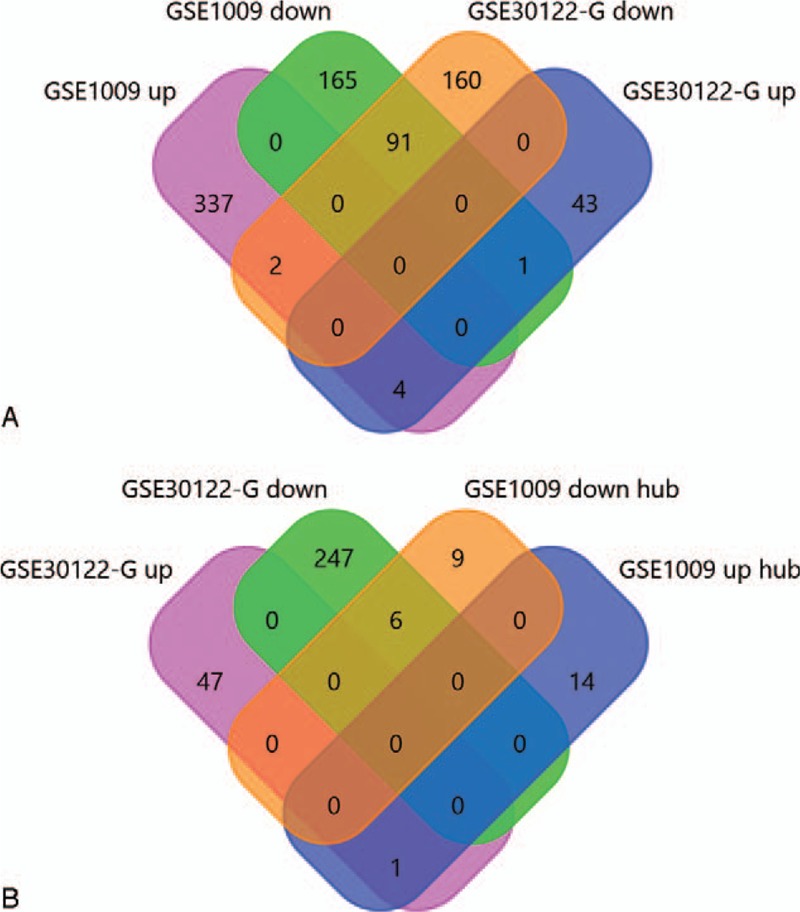
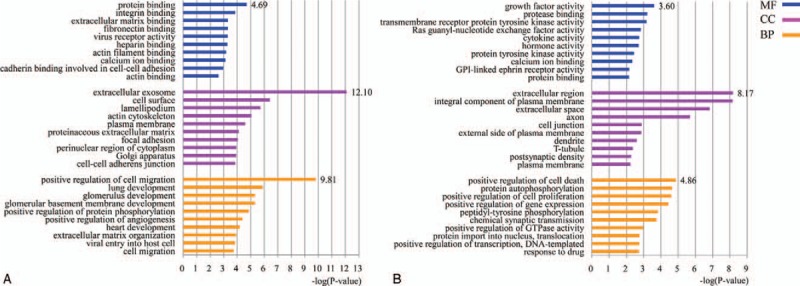
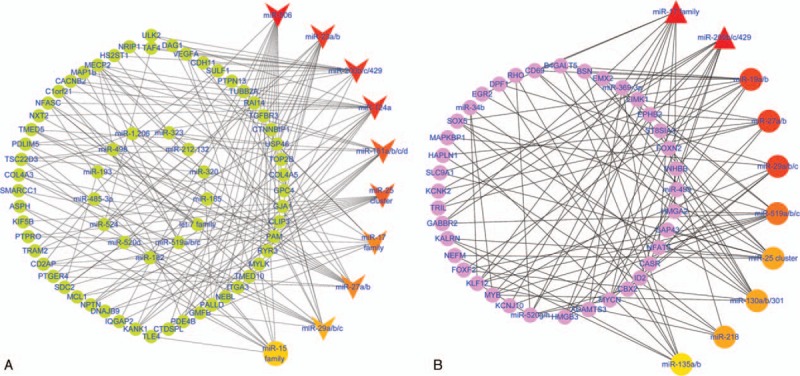
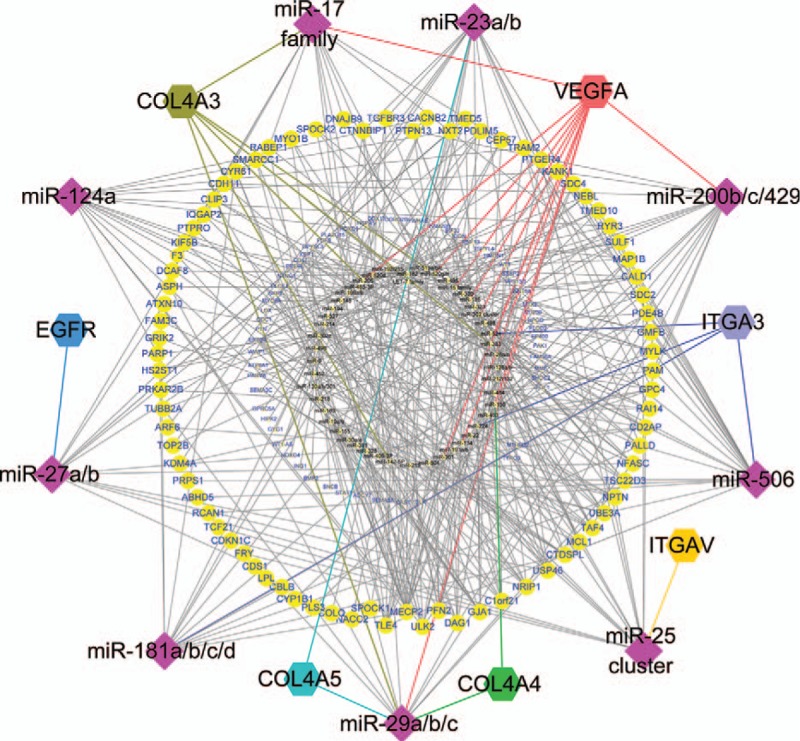
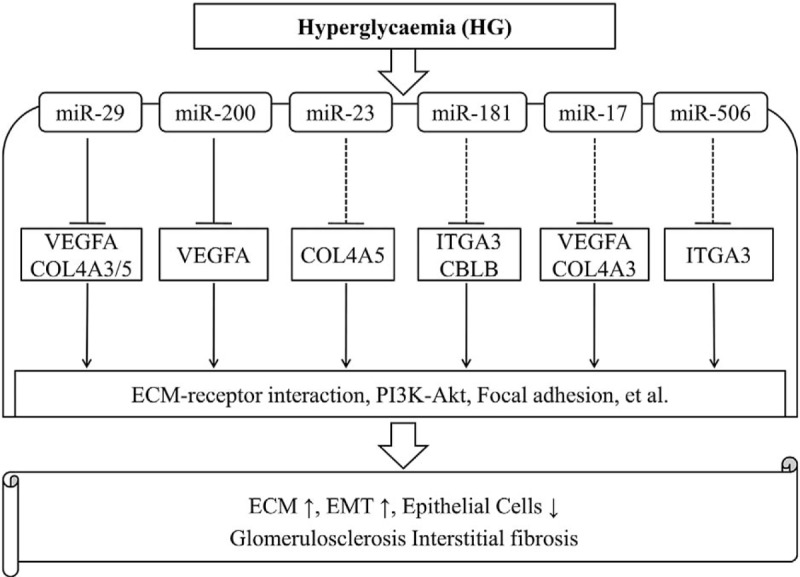
MicroRNAs (miRNAs) play a great contribution to the development of diabetic nephropathy (DN). The aim of this study was to explore potential miRNAs-genes regulatory network and biomarkers for the pathogenesis of DN using bioinformatics methods.Gene expression profiling data related to DN (GSE1009) was obtained from the Gene Expression Omnibus (GEO) database, and then differentially expressed genes (DEGs) between DN patients and normal individuals were screened using GEO2R, followed by a series of bioinformatics analyses, including identifying key genes, conducting pathway enrichment analysis, predicting and identifying key miRNAs, and establishing regulatory relationships between key miRNAs and their target genes.A total of 600 DEGs associated with DN were identified. An additional 7 key DEGs, including 6 downregulated genes, such as vascular endothelial growth factor α (VEGFA) and COL4A5, and 1 upregulated gene (CCL19), were identified in another dataset (GSE30528) from glomeruli samples. Pathway analysis showed that the down- and upregulated DEGs were enriched in 14 and 6 pathways, respectively, with 7 key genes mainly involved in extracellular matrix-receptor interaction, PI3K/Akt signaling, focal adhesion, and Rap1 signaling. The relationships between miRNAs and target genes were constructed, showing that miR-29 targeted COL4A and VEGFA, miR-200 targeted VEGFA, miR-25 targeted ITGAV, and miR-27 targeted EGFR.MiR-29 and miR-200 may play important roles in DN. VEGFA and COL4A5 were targeted by miR-29 and VEGFA by miR-200, which may mediate multiple signaling pathways leading to the pathogenesis and development of DN.
Conflict of interest statement
The authors report no conflicts of interest.
Figures
Similar articles
-
Identification of key genes and biological regulatory mechanisms in diabetic nephropathy: Meta-analysis of gene expression datasets.Nefrologia (Engl Ed). 2023 Sep-Oct;43(5):575-586. doi: 10.1016/j.nefroe.2022.06.006. Epub 2023 Jan 19. Nefrologia (Engl Ed). 2023. PMID: 36681521
-
Integrated Bioinformatics and Clinical Correlation Analysis of Key Genes, Pathways, and Potential Therapeutic Agents Related to Diabetic Nephropathy.Dis Markers. 2022 May 21;2022:9204201. doi: 10.1155/2022/9204201. eCollection 2022. Dis Markers. 2022. PMID: 35637650 Free PMC article.
-
Network pharmacology-based identification of miRNA expression of Astragalus membranaceus in the treatment of diabetic nephropathy.Medicine (Baltimore). 2022 Feb 4;101(5):e28747. doi: 10.1097/MD.0000000000028747. Medicine (Baltimore). 2022. PMID: 35119030 Free PMC article.
-
Bioinformatics Analysis of the Mechanisms of Diabetic Nephropathy via Novel Biomarkers and Competing Endogenous RNA Network.Front Endocrinol (Lausanne). 2022 Jul 14;13:934022. doi: 10.3389/fendo.2022.934022. eCollection 2022. Front Endocrinol (Lausanne). 2022. PMID: 35909518 Free PMC article.
-
Identification of candidate microRNA biomarkers in diabetic nephropathy: a meta-analysis of profiling studies.J Nephrol. 2018 Dec;31(6):813-831. doi: 10.1007/s40620-018-0511-5. Epub 2018 Jul 17. J Nephrol. 2018. PMID: 30019103 Review.
Cited by
-
Oleuropein Supplementation Ameliorates Long-Course Diabetic Nephropathy and Diabetic Cardiomyopathy Induced by Advanced Stage of Type 2 Diabetes in db/db Mice.Nutrients. 2024 Mar 15;16(6):848. doi: 10.3390/nu16060848. Nutrients. 2024. PMID: 38542759 Free PMC article.
-
Integrated bioinformatics analysis reveals novel key biomarkers in diabetic nephropathy.SAGE Open Med. 2022 Nov 11;10:20503121221137005. doi: 10.1177/20503121221137005. eCollection 2022. SAGE Open Med. 2022. PMID: 36385790 Free PMC article.
-
MiR-192-5p targets cell cycle regulation in diabetic kidney disease via cyclin-dependent kinase inhibitor 3.Noncoding RNA Res. 2024 Nov 19;11:60-72. doi: 10.1016/j.ncrna.2024.11.003. eCollection 2025 Apr. Noncoding RNA Res. 2024. PMID: 39736853 Free PMC article.
-
circRNAs Signature as Potential Diagnostic and Prognostic Biomarker for Diabetes Mellitus and Related Cardiovascular Complications.Cells. 2020 Mar 9;9(3):659. doi: 10.3390/cells9030659. Cells. 2020. PMID: 32182790 Free PMC article. Review.
-
Identification of potential shared gene signatures between gastric cancer and type 2 diabetes: a data-driven analysis.Front Med (Lausanne). 2024 Jun 6;11:1382004. doi: 10.3389/fmed.2024.1382004. eCollection 2024. Front Med (Lausanne). 2024. PMID: 38903804 Free PMC article.
References
-
- Umanath K, Lewis JB. Update on diabetic nephropathy: core Curriculum 2018. Am J Kidney Dis 2018;71:884–95. - PubMed
-
- Tuttle KR, Bakris GL, Bilous RW, et al. Diabetic kidney disease: a report from an ADA consensus conference. Am J Kidney Dis 2014;64:510–33. - PubMed
-
- Alvarez ML, DiStefano JK. Towards microRNA-based therapeutics for diabetic nephropathy. Diabetologia 2013;56:444–56. - PubMed
MeSH terms
Substances
LinkOut - more resources
Full Text Sources
Other Literature Sources
Medical
Research Materials
Miscellaneous
